Attached files
| file | filename |
|---|---|
| 8-K - OSG America L.P. | osp3q8k.htm |
| EX-99 - OSG America L.P. | osp3qx991.htm |
Exhibit 99.2
OSG America L.P.
Third Quarter Fiscal 2009
Earnings Conference Call
November 2, 2009
This presentation may contain forward-looking statements regarding the Partnership’s prospects, including
the outlook for U.S. tanker and articulated tug barge markets, the outcome of negotiations with AMSC,
OSG’s intention to tender for the outstanding common units of the Partnership, the payment of cash
distributions, the timely delivery of newbuilds in accordance with contracted terms, projected drydocking
schedule, off hire days for the fourth quarter of 2009, forecasted 2009 EBITDA, equity distribution from
affiliates, charter hire expense, cash interest, drydocking and replacement reserves and cash available for
distribution, projected distributable cash flow for the balance of 2009 and the forecast of U.S. economic
activity and U.S. oil demand. These statements are based on certain assumptions made by the
Partnership’s management based on its experience and perception of historical trends, current conditions,
expected future developments and other factors it believes are appropriate in the circumstances. Forward-
looking statements are subject to a number of risks, uncertainties and assumptions, many of which are
beyond the control of the Partnership, which may cause actual results to differ materially from those implied
or expressed by the forward-look statements. Factors, risks and uncertainties that could cause actual
results to differ from expectations reflected in such forward-looking statements are described in the
Partnership’s Annual Report on Form 10-K for 2008 and those risks discussed in other reports the
Partnership files with the Securities and Exchange Commission.
Forward Looking Statements
Quarterly Results
Third Quarter 2009 Financial Results
Continued deterioration in spot market rates
TCE revenues up by less than $1 million
Increase in expenses, specifically charter hire
Overseas Puget Sound and Overseas Galena Bay exit layup and begin grain voyages
Distribution
Cash available for distribution was $8.5M, a decline of $3.4M from 2Q09 levels of $11.9M
Distribution coverage for third quarter was 74%
Estimated term charter coverage for 4Q09 is 85%; for 2010 59% and 2011 55%
$0.8
$63.7
$64.5
TCE Revenues
$9.6
19.3
($9.7)
3Q08
($7.2)
(6.8)
(0.4)
$2.4
Adjusted net income
12.5
Impairments
($10.1)
Reported Net Loss
3Q09
($ in millions)

Lower oil demand reduced volumes across all Jones Act markets
First nine months 2009 U.S. oil demand down by about 5% from 2008 levels
2009 USGC refinery utilization averaged 84% over first 8 months, down from 86% in same
timeframe in 2008
Reduction in FCCUs further reduced manufacturing of light products
Delaware Bay Lightering: First 9 Months Market Activity
Volumes declined by 20% from last year’s levels
East Coast refining utilization levels declined to 73% from 82% in the same period last year
Announced Sunoco shutdown of Eagle Point refinery and Valero “temporary” shutdown of
units at Delaware City could adversely impact lightering activities
68 vessels trading in Jones Act coastwise market at quarter end
Nine Jones Act vessels currently in lay up, including two OSG America ships
Four deliveries expected in 4Q09
Year-end fleet forecast at 72 vessels
Jones Act Market Update
Update on Other Activities
Dividend Suspended
AMSC Negotiations
Non-binding settlement signed
Change in provisions materially altering prior agreement
Dismissal with prejudice of all claims in arbitration among parties

Financial Overview
Henry Flinter
Chief Financial Officer
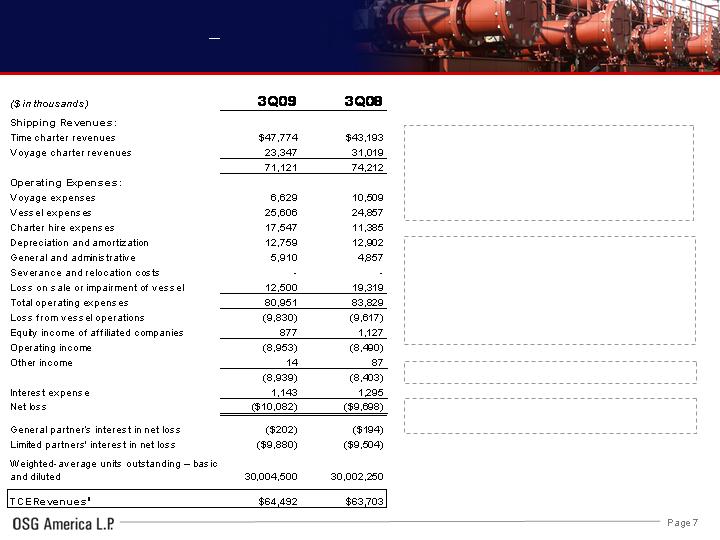
Financial Highlights Income Statement
Increase in time charter revenues primarily reflect
additional revenue days and higher rates for Jones Act
Product carriers delivered after 3Q08
TCE revenues were adversely impacted by a reduction
in international product spot rates and by the lay up of
vessels
1See Appendix for a reconciliation of this non-GAAP measure to the most directly comparable GAAP financial measure.
Lower equity income considers 2 fewer vessels under
management compared with 2008
Higher vessel expenses are due to an increase in
operating days resulting from 4 new product carriers and
the switch of the OSG 400 to bareboat charter from time
charter, somewhat offset by lower expenses for vessels
in lay up
Higher charter hire expense reflects delivery of 3 new
product carriers on bareboat from AMSC
Impairment in 2009 for 2 vessels
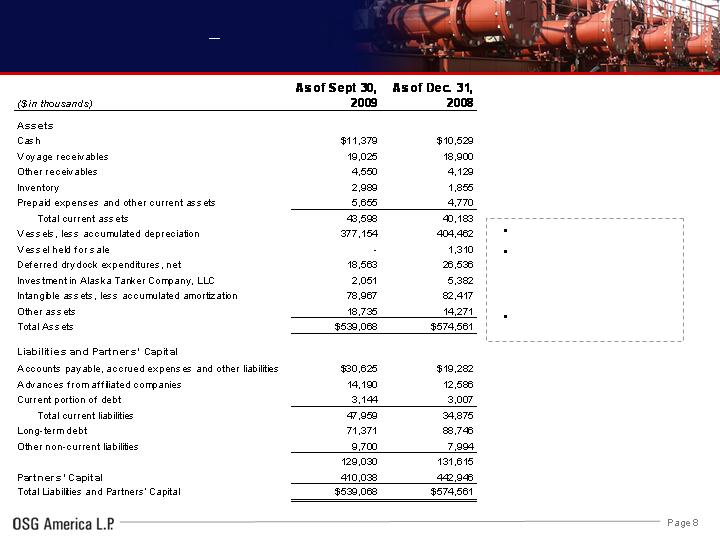
Financial Highlights Balance Sheet
Safely within debt covenants
Total debt levels have
declined by $17.2 million
over the first nine months of
2009
$170 million available under
revolver

Distributable Cash Flow1
Distribution coverage was 74%
for the third quarter and 110% for
the first nine months of 2009
1See Appendix for a reconciliation of this non-GAAP measure to the most directly comparable GAAP financial measure.
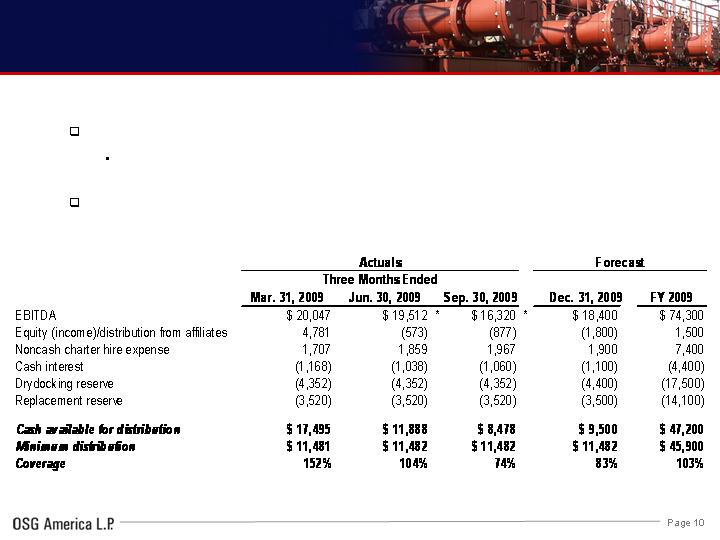
2009 Forecast
Fiscal 2009 coverage distribution is expected to be 103%
Full year coverage improved slightly from August due to the grain voyage
performed by the Galena Bay which was not anticipated in the prior guidance
2009 coverage guidance has declined from 117% (March) to 103%
(November)
*Reflects add back of loss on sale or impairment of vessel

Appendix
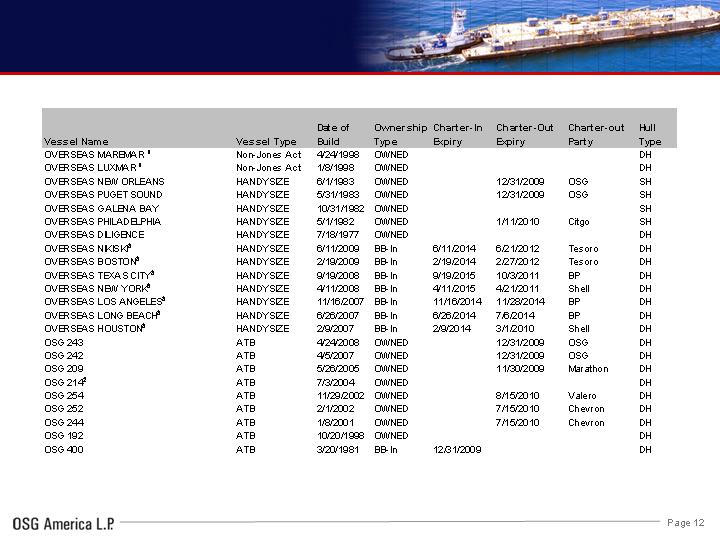
Operating Fleet
1 50% of revenue days are covered by a government contract, which has been extended through 2011; 2 Vessels in lay up;
3Charter- in
dates are for initial terms (OSG America has unlimited renewal options); charter-out dates are for initial periods only. 4 On a COA
contract servicing Sunoco in lightering. A full fleet list that includes additional information is available in the Fleet section of
osgamerica.com
As of October 31, 2009
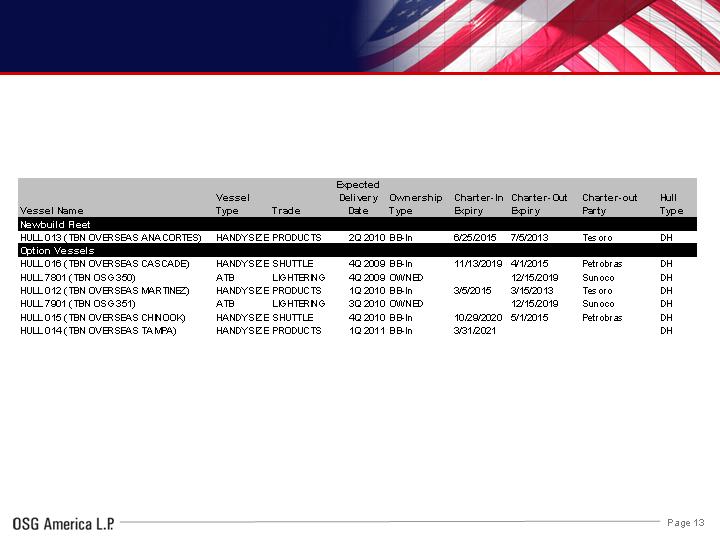
Newbuild Fleet & Option Vessels
Notes:
Newbuild vessels were contributed by OSG to OSG America at the time of its initial public offering; option vessels are
those that the Partnership has the right to acquire from OSG at to-be-negotiated purchase prices prior to the first
anniversary of the delivery of each vessel to OSG.
On October 14, 2008, American Shipping Company ("AMSC") notified OSG that AMSC was reversing the building
sequence of these two vessels. OSG disputes AMSC's ability to make this change without OSG’s consent, and OSG
has objected and requested that this dispute be arbitrated expeditiously to avoid or reduce any harm to OSG or its
ultimate customers.
As of October 31, 2009
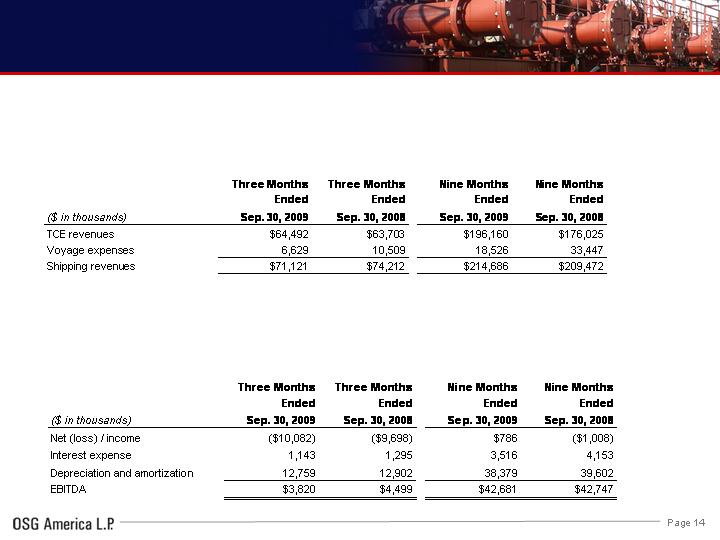
Reconciliation Tables
EBITDA
EBITDA represents operating earnings, which is before interest expense, plus other income and depreciation and amortization expense.
EBITDA is presented to provide investors with meaningful additional information that management uses to monitor ongoing operating
results and evaluate trends over comparative periods. EBITDA should not be considered a substitute for net income or cash flow from
operating activities prepared in accordance with accounting principles generally accepted in the United States or as a measure of
profitability or liquidity. While EBITDA is frequently used as a measure of operating results and performance, it is not necessarily
comparable to other similarly titled captions of other companies due to differences in methods of calculation.
TCE Revenue
Consistent with general practice in the shipping industry, the Partnership uses time charter equivalent revenues, which represents shipping
revenues less voyage expenses, as a measure to compare revenue generated from a voyage charter to revenue generated from a time charter.
Time charter equivalent revenues, a non-GAAP measure, provides additional meaningful information in conjunction with shipping revenues, the
most directly comparable GAAP measure, because it assists the Partnership’s management in making decisions regarding the deployment and
use of its vessels and in evaluating their financial performance.