Attached files
| file | filename |
|---|---|
| 8-K - FORM 8-K - M&T BANK CORP | l37993e8vk.htm |
Exhibit
99
| BancAnalysts Association of Boston 2009 Annual Bank Conference November 5th, 2009 |

| 2 Disclaimer This presentation contains forward looking statements within the meaning of the Private Securities Litigation Reform Act giving the Company's expectations or predictions of future financial or business performance or conditions. Forward-looking statements are typically identified by words such as "believe," "expect," "anticipate," "intend," "target," "estimate," "continue," "positions," "prospects" or "potential," by future conditional verbs such as "will," "would," "should," "could" or "may", or by variations of such words or by similar expressions. These forward-looking statements are subject to numerous assumptions, risks and uncertainties which change over time. Forward-looking statements speak only as of the date they are made and we assume no duty to update forward-looking statements. In addition to factors previously disclosed in our SEC reports and those identified elsewhere in this presentation, the following factors among others, could cause actual results to differ materially from forward-looking statements or historical performance: ability to obtain regulatory approvals and meet other closing conditions to the merger, including approval by Provident shareholders, on the expected terms and schedule; delay in closing the merger; difficulties and delays in integrating the M&T and Provident businesses or fully realizing cost savings and other benefits; business disruption following the merger; changes in asset quality and credit risk; the inability to sustain revenue and earnings growth; changes in interest rates and capital markets; inflation; customer acceptance of M&T products and services; customer borrowing, repayment, investment and deposit practices; customer disintermediation; the introduction, withdrawal, success and timing of business initiatives; competitive conditions; the inability to realize cost savings or revenues or to implement integration plans and other consequences associated with mergers, acquisitions and divestitures; economic conditions; and the impact, extent and timing of technological changes, capital management activities, and other actions of the Federal Reserve Board and legislative and regulatory actions and reforms. Annualized, pro forma, projected and estimated numbers are used for illustrative purpose only, are not forecasts and may not reflect actual results. |

| 3 Top 20 US-based full-service commercial bank holding company by assets and Top 15 by market cap* $69 billion total assets 832 branches in seven states / District of Columbia 92% in NY, PA, MD 7% in VA Over 1,900 ATMs across retail bank footprint Over 2 million retail customers Over 190,000 commercial customers M&T Bank Corporation - Overview *As of September 30, 2009 |
| 4 M&T's Culture - "Understanding what's important." For more than 150 years, M&T Bank has delivered on our promise of "Understanding what's important" by building deep, long-lasting relationships with our customers and by investing in our communities. Focused on long term shareholder returns Conservatively and consistently managed Committed to execution at the local level |

| 5 Focus on Long Term Shareholder Returns Management's Interest aligned with Shareholders' Interests Approximately 50% Ownership between AIB, M&T Insiders and Warren Buffett Berkshire Hathaway- Warren Buffett M&T Management, Directors and Employees Ownership as of 9/30/09, as available, otherwise as of 2/27/09. Inside calculation includes options & deferred bonus shares. 21.2% 5.7% AIB 22.6% Other Shareholders 50.5% |

| M&T Bank average employee tenure (as of 7/6/09): 9.9 years M&T Bank average tenure of employees with >1 yr service: 10.9 years vs. US Dept. of Labor financial services industry average tenure: 4.7 years 6 M&T's Core Foundation is Stability... Management Group average tenure: 21.5 years Senior Vice President average tenure: 18.4 years Regional President average tenure: 17.9 years Branch Manager average tenure: 12.7 years Commercial RM average tenure: 9.8 years Teller average tenure: 7.7 years ... However, we are always challenging that stability by bringing in experienced professionals and maintaining a pipeline of new talent through campus recruitment programs |

| 7 Keep decisions close to customer Specific product expertise is structured centrally, but delivered locally Ability to quickly respond to strategic priorities of the Bank Centrally controlled, but regionally managed, risk creation process Advantages of M&T's Community Bank Model We lend in the markets where we live and work to people and enterprises whom we know |
| 8 September 2009 YTD Results |
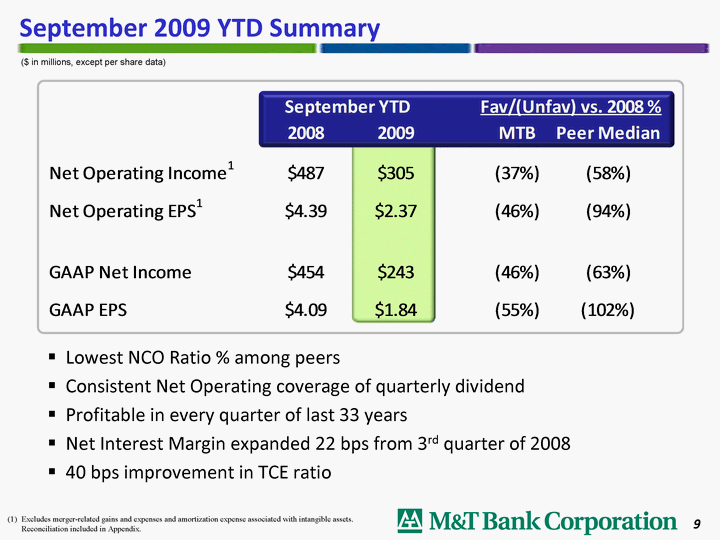
| 9 September 2009 YTD Summary ($ in millions, except per share data) Excludes merger-related gains and expenses and amortization expense associated with intangible assets. Reconciliation included in Appendix. Lowest NCO Ratio % among peers Consistent Net Operating coverage of quarterly dividend Profitable in every quarter of last 33 years Net Interest Margin expanded 22 bps from 3rd quarter of 2008 40 bps improvement in TCE ratio |

| 10 Key Ratios Excludes merger-related gains and expenses and amortization expense associated with intangible assets. Reconciliation included in Appendix. Efficiency Ratio reflects non-interest expense (excluding amortization expense associated with intangible assets, merger-related expenses and other non-recurring expenses) as a percentage of fully taxable equivalent net interest income and non-interest revenues (excluding gains from securities transactions and non-recurring items). Allowance to legacy M&T loans. Per SFAS No. 141R and SOP 03-3, Provident and Bradford loans were marked to fair value at acquisition with no related reserves. * Preliminary * * * |

| 11 Operating Return on Avg. Tangible Common Equity - Sept '09 YTD Note: Excludes amortization of intangibles and goodwill impairment, merger-related items, and other nonrecurring items as noted by SNL. 2009 includes the FDIC special assessment. 10 of 15 peer banks reported losses for the first nine months of 2009 M&T is one of only 3 peer banks to report a profit in every quarter of 2007, 2008 and 2009 |

| 12 M&T's focus on returns and relationships rather than volumes allows it to maintain a modest advantage over the peer group Note: Taxable Equivalent net interest margin used for M&T and for peer banks when available. Net Interest Margin % |

| Risk-Adjusted Net Interest Margin *FTE Net Interest Income less Net Charge-Offs as a percentage of average earning assets. * |

| 14 Credit Quality vs. Peer Banks |

| 15 Historically, M&T's Nonaccrual ratio has closely tracked the peer median. However, there is a favorable divergence in the current cycle Historically, M&T's NCO ratio has been lower than the peers. The out-performance is even more pronounced in the current cycle Source: SNL Interactive. FR Y9C data used. September 2009 YTD data from peer bank earnings releases. Historical Credit Cycle: 1991 - Q3 2009 |

| 16 Credit Quality - September 2009 YTD Source: SNL Interactive, peer bank earnings releases. * September 2009 YTD Annualized Net Charge-Offs ** Reserves to Legacy M&T Loans. 1.66% including 2009 loans acquired at fair value without reserves. M&T has the second highest coverage ratio among peers while maintaining the lowest ratio of net charge-offs to average loans Rank #3/15 Rank #1/15 Rank #15/15 Rank #2/15 ** |

| 17 Commercial Credit Quality vs Peers - June 30, 2009 Source: SNL Interactive. FR Y9C data as of June 30, 2009. MTB's CRE concentration has remained stable as the industry has ramped up exposure Peers have grown CRE concentrations 3x more than MTB over the last 10 years Disciplined credit underwriting with a focus on core credit principals: Long institutional memory with senior management involvement in all large relationships Maintained consistent underwriting standards Did not underwrite to anticipatory values Focused on cash flow |

| 18 Consumer Credit Quality vs Peers - June 30, 2009 Source: SNL Interactive. FR Y9C data as of June 30, 2009. |

| 19 Capital & Reserve Coverage of Problem Assets Tangible Common Equity + Loan Loss Reserves as a % of Non-Performing Assets Peer Median Peer Median Tangible Common Equity + Loan Loss Reserves as a % of Net Charge-Offs* Source: SNL Interactive. * September 2009 YTD Annualized Net Charge-Offs |
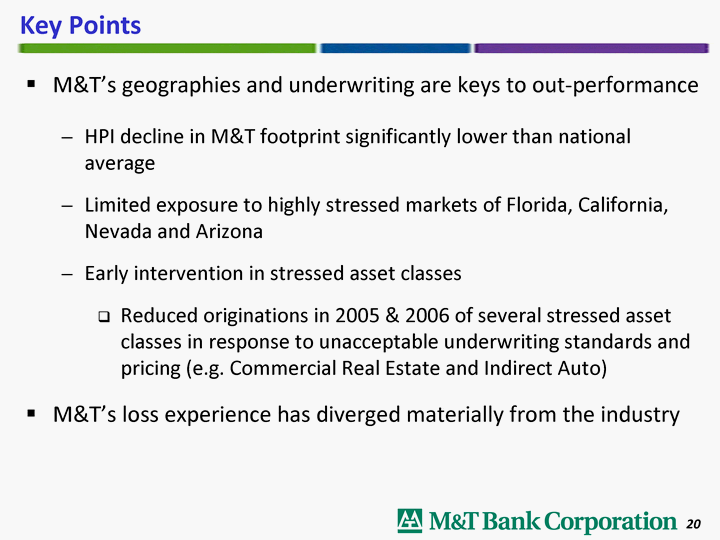
| 20 M&T's geographies and underwriting are keys to out-performance HPI decline in M&T footprint significantly lower than national average Limited exposure to highly stressed markets of Florida, California, Nevada and Arizona Early intervention in stressed asset classes Reduced originations in 2005 & 2006 of several stressed asset classes in response to unacceptable underwriting standards and pricing (e.g. Commercial Real Estate and Indirect Auto) M&T's loss experience has diverged materially from the industry Key Points |

| 21 Provident Acquisition: Growing When and Where it Makes Sense |

| Deal Value at Announcement and Tangible Equity at Most Recent Quarter before Announcement Although Provident was less than $1.0 Billion in Deal Value, it has been included for reference Source: SNL Financial Median: 3.03 Bank Acquisitions Since 2000: Deal Value/Tangible Equity 22 |

| As a result of the Provident acquisition, M&T now has a similar presence in MD as it does in Upstate New York, with a #1 branch share and #2 deposit share However, the MD area offers a larger, wealthier and faster growing population with more business opportunities. As a result, M&T has made MD a focal point for future growth prospects Market Comparison 23 Upstate vs. Maryland Data include only those counties within the M&T Bank branch footprint. Upstate includes WNY, Rochester, Syracuse & Southern CBRs State of Maryland. Includes Provident and Bradford branches as reported to the FDIC as of June 30, 2009. Provident- related consolidations not reflected. Credit unions included. Branch count includes only branches with deposits as of June 30, 2009. Target Segments: Financial Services, Healthcare, High Tech, Light Mfg, Professional Services, Specialty Construction and Wholesale Dist. |

| 24 Opportunity in the Community Bank Model Opportunity Opportunity * Data reflects Western New York vs. Baltimore/Greater Washington regions Opportunity |
| 25 MTB: A Solid Investment |

| 26 M&T Bank Corporation... a solid investment Nearly 18% annual growth in operating earnings per share since 1983 >16% annualized total return to shareholders since 1983* MTB's stock has outperformed the Standard & Poor's Bank Index by 19%, 29% and 88% over the past 3, 5 and 10-year periods, respectively* *As of September 30, 2009 |
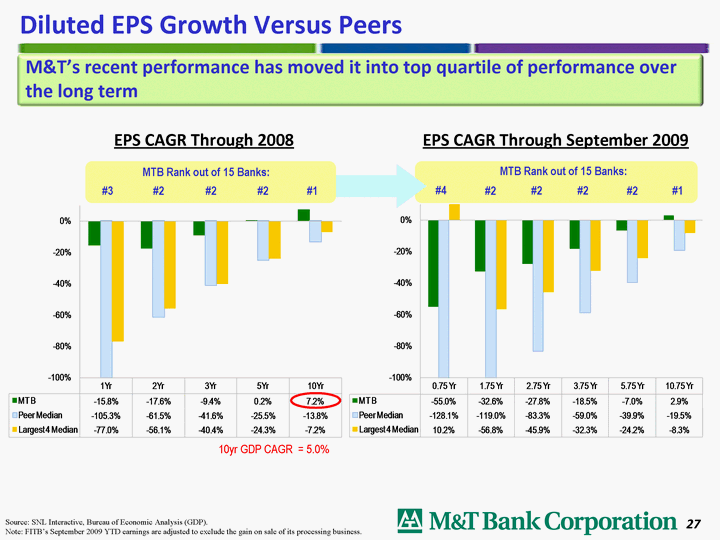
| 27 27 Source: SNL Interactive, Bureau of Economic Analysis (GDP). Note: FITB's September 2009 YTD earnings are adjusted to exclude the gain on sale of its processing business. M&T's recent performance has moved it into top quartile of performance over the long term Diluted EPS Growth Versus Peers EPS CAGR Through 2008 EPS CAGR Through September 2009 10yr GDP CAGR = 5.0% #2 #2 #2 #1 #2 MTB Rank out of 15 Banks: #4 #2 #2 #2 #1 #3 MTB Rank out of 15 Banks: |

| 28 Of the largest 100 banks operating in 1983, only 25 remain today M&T Bank Corporation... a solid investment Among the remaining, M&T ranks 2nd highest in stock price growth |
| 29 Appendix |

| 30 Reconciliation of GAAP and Non-GAAP Results of Operation * Excludes gain/(loss) on sale of securities. |

| 31 Reconciliation of GAAP and Non-GAAP Results of Operation |

| United States M&T Footprint NYS, Central PA, Philadelphia, MD, DC, NoVa & Richmond -4.9% Sept 2008 0.2% Although employment losses have increased since the third quarter of 2008, the rate of decline in the M&T footprint remains well below the U.S. average 2004 2005 2006 2007 2008 2009 Sept Source: U.S. Bureau of Labor Statistics -3.0% Private Sector Employment Growth in the M&T Footprint YoY % Change |

| Source: Federal Housing Finance Agency. The FHFA "all-transactions" index tracks average house price changes in repeat sales or re-financings of the same single-family properties based on data obtained from Fannie Mae and Freddie Mac for conventional, conforming mortgage transactions. Excludes properties financed with subprime, Alt-A, Jumbo mortgages, etc. Rankings are for 294 U.S. metro areas containing 15,000 or more transactions over the last 10 years. Smaller M&T markets (Williamsport, Altoona, Binghamton, Ithaca, Utica-Rome, State College, Salisbury, MD) are unranked. 33 Existing Home Price Appreciation - Q2 2009 |
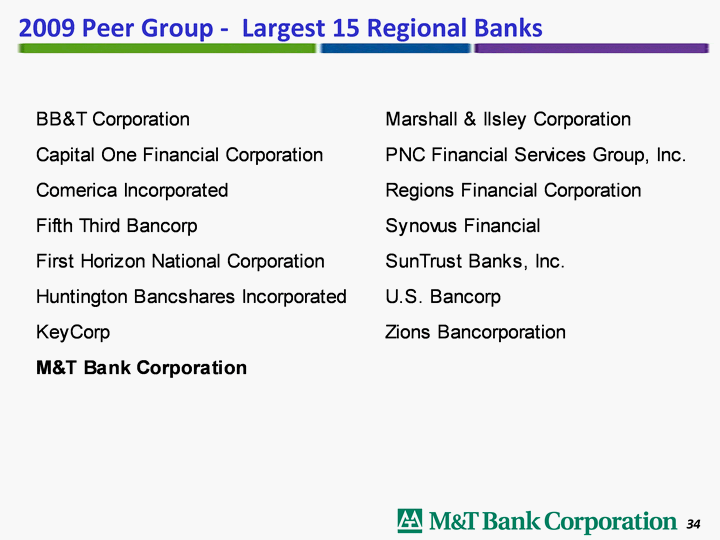
| 34 2009 Peer Group - Largest 15 Regional Banks |

| BancAnalysts Association of Boston 2009 Annual Bank Conference November 5th, 2009 |
