Attached files
| file | filename |
|---|---|
| 8-K - 8-K - IBASIS INC | a09-33026_18k.htm |
Exhibit 99.1
|
|
2010-2014 Projections - Statement of Profit and Loss (USD, rounded to millions) 2010 2011 2012 2013 2014 Minutes 23,898.0 29,077.3 34,515.9 40,245.6 46,302.2 ARPM 0.0510 0.0477 0.0446 0.0417 0.0389 Total Revenue $ 1,219.9 $ 1,388.1 $ 1,540.1 $ 1,677.8 $ 1,803.0 Total Cost of Revenue 1,068.3 1,210.5 1,333.1 1,439.7 1,531.9 Gross Profit 151.6 177.6 207.0 238.1 271.1 Gross Margin % 12.4% 12.8% 13.4% 14.2% 15.0% Gross Profit / minute 0.0063 0.0061 0.0060 0.0059 0.0059 Total Operating Expenses 98.1 108.6 118.9 130.0 141.1 Adjusted EBITDA* 53.5 69.0 88.1 108.0 130.0 Adjusted EBITDA % * 4.4% 5.0% 5.7% 6.4% 7.2% Depreciation and Amortization 37.9 37.1 36.5 25.5 29.5 Income from Operations 15.6 31.9 51.6 82.5 100.5 Other Income and Expense (0.2) 0.3 0.9 1.7 2.6 Income Before Income Tax Expense 15.4 32.1 52.5 84.2 103.1 Income Tax Expense 7.7 9.6 11.7 14.3 16.8 Net Income $ 7.8 $ 22.6 $ 40.8 $ 69.9 $ 86.4 * Adjusted EBITDA and adjusted EBITDA % are Non-GAAP financial measures. 1 |
|
|
2010-2014 Projections - Revenue and Margin Detail (USD, rounded to millions) TRADING Minutes ARPMRevenue Gross Profit Gross Margin % Gross Profit/minute RETAIL Minutes ARPMRevenue Gross Profit Gross Margin % Gross Profit/minute EXISTING OUTSOURCED Minutes ARPMRevenue Gross Profit Gross Margin % Gross Profit/minute NEW OUTSOURCED Minutes ARPMRevenue Gross Profit Gross Margin % Gross Profit/minute CONSOLIDATED Minutes ARPMTotal Revenue Gross Profit Gross Margin % Gross Profit/minute 2010 2011 2012 2013 2014 15,922.5 17,920.9 20,170.1 22,701.7 25,550.9 0.0469 0.0437 0.0407 0.0378 0.0352 $ 747.0 $ 783.0 $ 820.4 $ 859.2 $ 899.6 $ 93.0 $ 104.8 $ 118.2 $ 133.3 $ 150.2 12.4% 13.4% 0.0058 0.0059 2,041.1 2,145.1 0.0412 0.0398 $ 84.2 $ 85.4 $ 13.6 $ 13.8 14.4% 0.0059 2,254.4 0.0384 $ 86.6 $ 14.0 15.5% 0.0059 2,369.2 0.0371 $ 87.9 $ 14.2 16.7% 0.0059 2,489.9 0.0358 $ 89.2 $ 14.4 16.2% 16.2% 0.0067 0.0064 2,934.4 3,011.3 0.0830 0.0834 $ 243.4 $ 251.1 $ 29.8 $ 28.8 16.2% 0.0062 3,091.4 0.0838 $ 259.1 $ 29.6 16.2% 0.0060 3,174.7 0.0842 $ 267.4 $ 30.4 16.2% 0.0058 3,261.4 0.0846 $ 276.0 $ 31.3 12.3% 11.5% 0.0102 0.0096 3,000.0 6,000.0 0.0475 0.0443 $ 142.4 $ 265.7 $ 15.0 $ 30.0 11.4% 0.0096 9,000.0 0.0412 $ 371.1 $ 45.0 11.4% 0.0096 12,000.0 0.0384 $ 460.4 $ 60.0 11.3% 0.0096 15,000.0 0.0357 $ 535.3 $ 75.0 10.5% 11.3% 0.0050 0.0050 23,898.0 29,077.3 0.0510 0.0477 $ 1,219.9 $ 1,388.1 $ 151.6 $ 177.6 12.1% 0.0050 34,515.9 0.0446 $ 1,540.1 $ 207.0 13.0% 0.0050 40,245.6 0.0417 $ 1,677.8 $ 238.1 14.0% 0.0050 46,302.2 0.0389 $ 1,803.0 $ 271.1 12.4% 12.8% 13.4% 14.2% 15.0% 0.0063 0.0061 0.0060 0.0059 0.0059 2 |
|
|
2010-2014 Projections – Key Profit and Loss Assumptions • Assumptions relating to Revenue/Margin • Trading Business • Minute growth of 12% per year • Average Revenue Per Minute decline of 7% per year • Gross Profit per minute flat at $.0059 from Q2 09 • Retail Business • Minute growth of 5% per year • ARPM decline of 3.5% per year • Gross Margin % flat from Q2 09 • Existing Outsourced Business (KPN Fixed) • Flat minutes from Q2 09 • Gross Margin 30% in 2010 and 25% in each of 2011-2014 • Existing Outsourced Business (KPN Mobile entities) • Minute growth of 4% per year • Gross Margin flat at 11% per year • New Outsourced Business • New deal every 6 months (beginning Oct 2009) • Each deal generates 1.5b minutes/year • ARPM decline of 7% per year • Gross Profit per minute flat at $.0050/minute • Note: Actual size and timing of transactions may vary with some being larger and at different intervals; no new outsourcing transactions were completed in Oct 2009 • Assumptions relating to Operating Expenses & other • Operating Expenses grow by approximately $10m / year to support growth in business • Operating Expenses per minute declines from $.0044 in 2009 to $.0030 in 2014 • U.S. entity begins charging Netherlands technology-based royalty of 2.5% of revenue beginning in 2010 • Assumptions relating to Tax Expense • 25.5% of Netherlands Income • U.S. Net Operating Losses ($120m) are enough to cover U.S. net income 3 |
|
|
2010-2014 Projections - Balance Sheet (USD, rounded to millions) 12/31/2010 12/31/2011 12/31/2012 12/31/2013 12/31/2014 Assets: Current Assets: Cash and Cash Equivalents $99.1 $150.1 $216.6 $300.5 $404.7 Accounts receivable, net 288.1 322.5 353.1 380.5 405.0 Prepaid expenses and other current assets 4.7 4.7 4.7 4.7 4.7 Property and equipment, net 26.6 25.1 22.9 26.5 27.9 Intangible assets, net 49.9 33.6 21.0 17.2 13.3 Goodwill 17.3 17.3 17.3 17.3 17.3 Other assets 1.4 1.4 1.4 1.4 1.4 Total assets $487.3 $554.7 $637.2 $748.1 $874.3 Liabilities and Stockholders Equity Liabilities: Accounts Payable, net $351.9 $395.3 $434.5 $470.0 $502.4 Other Accrued Expenses 8.7 9.2 10.0 10.8 11.6 Deferred Revenue 10.6 10.7 10.9 11.0 11.2 Bank line of credit 19.0 19.0 19.0 19.0 19.0 Other liabilities 2.7 2.0 1.4 1.1 0.9 Total Liabilities $392.8 $436.2 $475.7 $511.9 $545.1 Stockholders equity $94.5 $118.6 $161.5 $236.2 $329.2 Total liabilities and owners equity $487.3 $554.7 $637.2 $748.1 $874.3 4 |
|
|
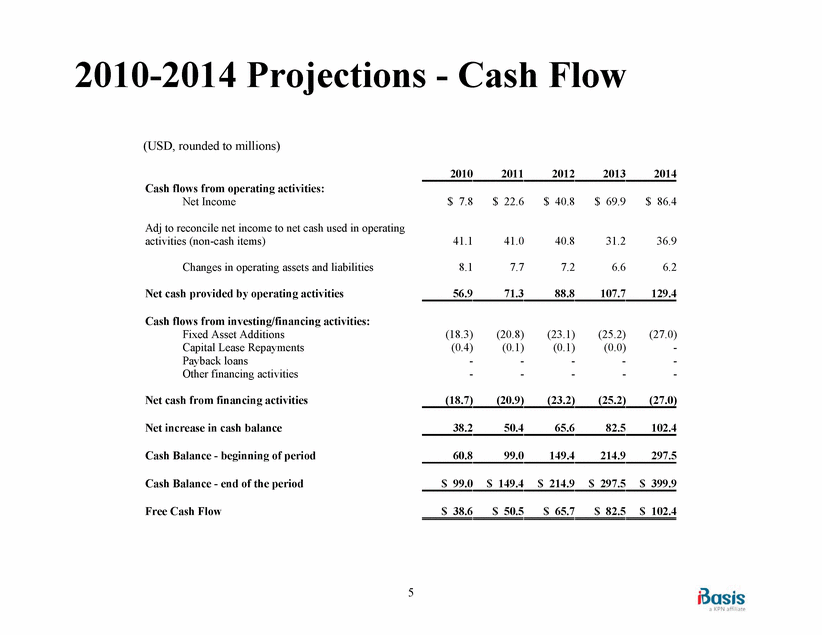
2010-2014 Projections - Cash Flow (USD, rounded to millions) 2010 2011 2012 2013 2014 Cash flows from operating activities: Net Income $ 7.8 $ 22.6 $ 40.8 $ 69.9 $ 86.4 Adj to reconcile net income to net cash used in operating activities (non-cash items) 41.1 41.0 40.8 31.2 36.9 Changes in operating assets and liabilities 8.1 7.7 7.2 6.6 6.2 Net cash provided by operating activities 56.9 71.3 88.8 107.7 129.4 Cash flows from investing/financing activities: Fixed Asset Additions (18.3) (20.8) (23.1) (25.2) (27.0) Capital Lease Repayments (0.4) (0.1) (0.1) (0.0) - Payback loans ----- Other financing activities ----- Net cash from financing activities (18.7) (20.9) (23.2) (25.2) (27.0) Net increase in cash balance 38.2 50.4 65.6 82.5 102.4 Cash Balance - beginning of period 60.8 99.0 149.4 214.9 297.5 Cash Balance - end of the period $ 99.0 $ 149.4 $ 214.9 $ 297.5 $ 399.9 Free Cash Flow $ 38.6 $ 50.5 $ 65.7 $ 82.5 $ 102.4 5 |
|
|
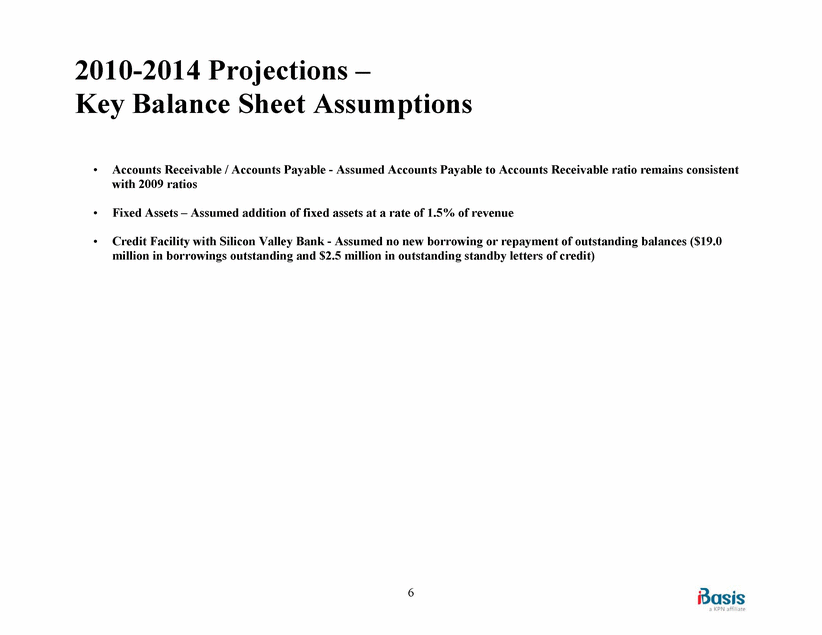
2010-2014 Projections – Key Balance Sheet Assumptions • Accounts Receivable / Accounts Payable - Assumed Accounts Payable to Accounts Receivable ratio remains consistent with 2009 ratios • Fixed Assets – Assumed addition of fixed assets at a rate of 1.5% of revenue • Credit Facility with Silicon Valley Bank - Assumed no new borrowing or repayment of outstanding balances ($19.0 million in borrowings outstanding and $2.5 million in outstanding standby letters of credit) 6 |


