Attached files
| file | filename |
|---|---|
| 8-K - FORM 8-K - MEDCO HEALTH SOLUTIONS INC | c91832e8vk.htm |
Exhibit 99.1
| Advancing Pharmacy - Reforming Healthcare Oppenheimer & Co. 20th Annual Healthcare Conference November 4, 2009 Timothy C. Wentworth Group President, Employer Accounts Richard J. Rubino SVP, Finance and CFO |
| Forward-Looking Statements This presentation contains "forward-looking statements" as that term is defined in the Private Securities Litigation Reform Act of 1995. These statements involve risks and uncertainties that may cause results to differ materially from those set forth in the statements. No forward-looking statement can be guaranteed, and actual results may differ materially from those projected. We undertake no obligation to publicly update any forward-looking statement, whether as a result of new information, future events or otherwise. The forward-looking statements are not historical facts, but rather are based on current expectations, estimates, assumptions and projections about the business and future financial results of the pharmacy benefit management ("PBM") and specialty pharmacy industries, and other legal, regulatory and economic developments. We use words such as "anticipates," "believes," "plans," "expects," "projects," "future," "intends," "may," "will," "should," "could," "estimates," "predicts," "potential," "continue," "guidance" and similar expressions to identify these forward-looking statements. Medco's actual results could differ materially from the results contemplated by these forward-looking statements due to a number of factors. Forward-looking statements in this presentation should be evaluated together with the risks and uncertainties that affect our business, particularly those mentioned in the Risk Factors section of the Company's Annual Report on Form 10-K, Quarterly Reports on Form 10-Q and other documents filed from time to time with the Securities and Exchange Commission. |
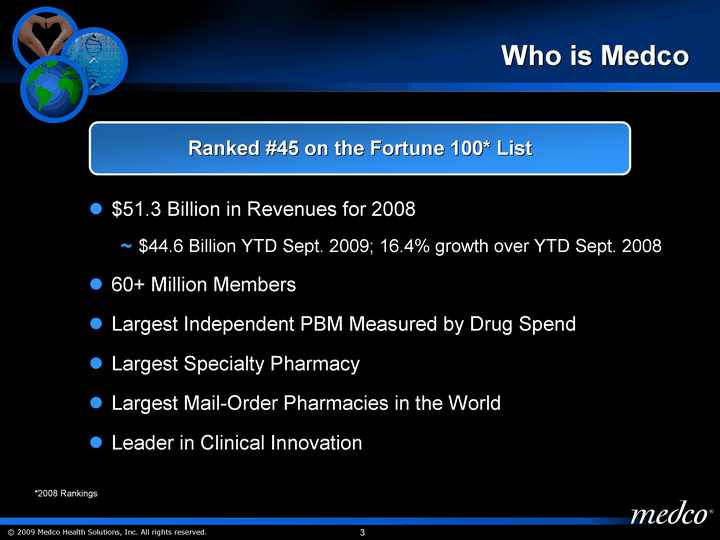
| Who is Medco Ranked #45 on the Fortune 100* List $51.3 Billion in Revenues for 2008 $44.6 Billion YTD Sept. 2009; 16.4% growth over YTD Sept. 2008 60+ Million Members Largest Independent PBM Measured by Drug Spend Largest Specialty Pharmacy Largest Mail-Order Pharmacies in the World Leader in Clinical Innovation *2008 Rankings |
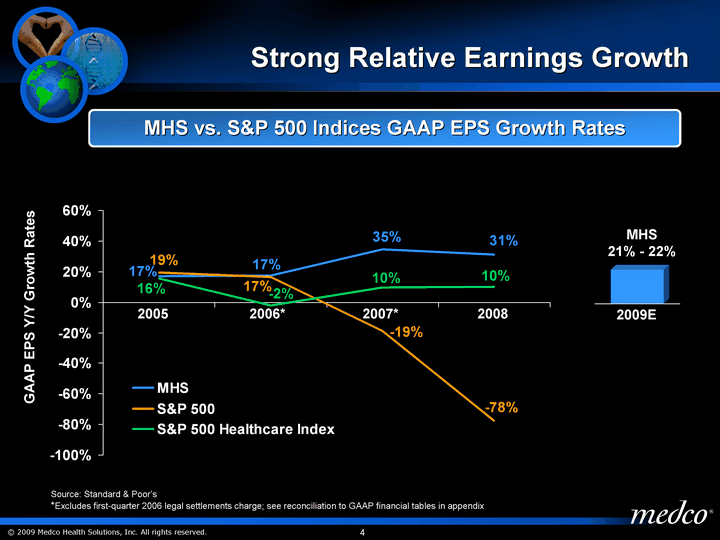
| 2005 2006* 2007* 2008 Strong Relative Earnings Growth 2005 2006* 2007* 2008E** MHS 0.1705 0.1748 0.347 0.31 S&P 500 0.194 0.166 -0.188 -0.775 S&P 500 Healthcare Index 0.157 -0.022 0.095 0.099 GAAP EPS Y/Y Growth Rates MHS vs. S&P 500 Indices GAAP EPS Growth Rates 2009E GAAP EPS 0.21 MHS 21% - 22% 2009E Source: Standard & Poor's *Excludes first-quarter 2006 legal settlements charge; see reconciliation to GAAP financial tables in appendix |
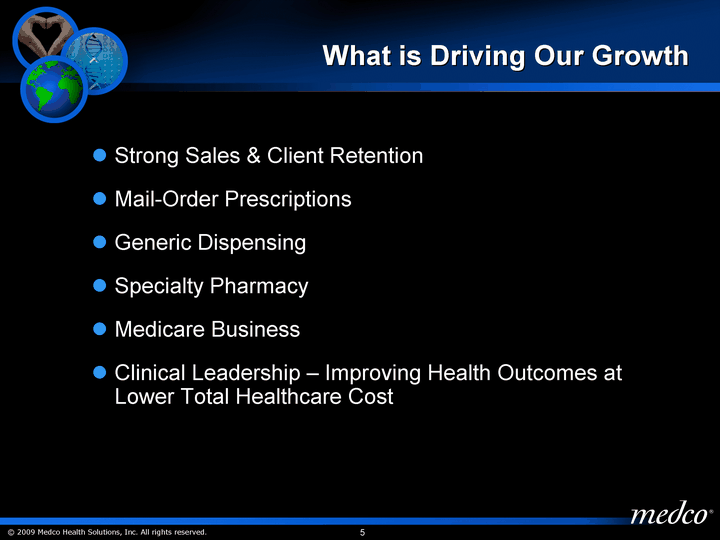
| What is Driving Our Growth Strong Sales & Client Retention Mail-Order Prescriptions Generic Dispensing Specialty Pharmacy Medicare Business Clinical Leadership - Improving Health Outcomes at Lower Total Healthcare Cost |
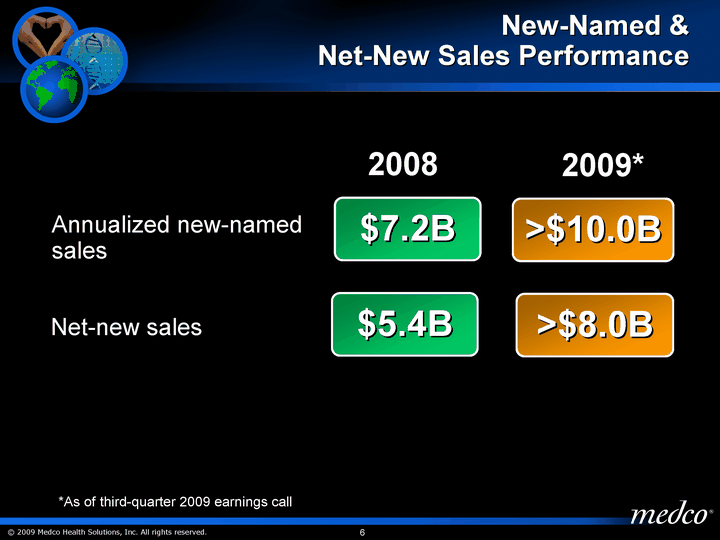
| New-Named & Net-New Sales Performance *As of third-quarter 2009 earnings call $7.2B Annualized new-named sales Net-new sales >$10.0B $5.4B >$8.0B 2008 2009* |
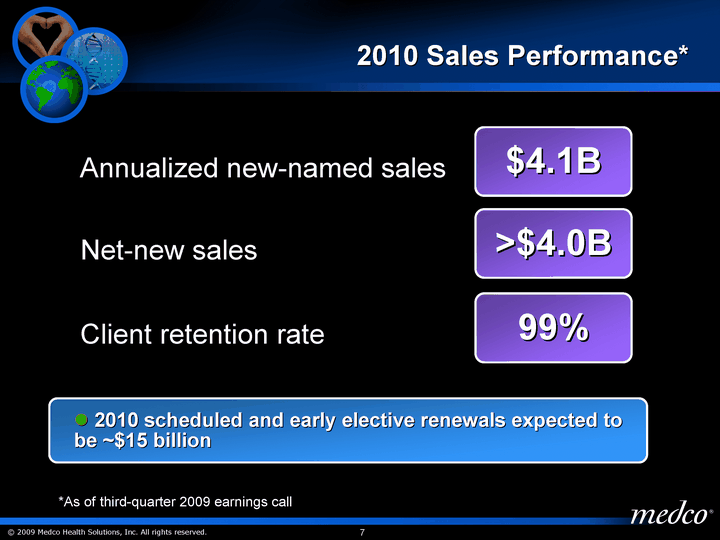
| 2010 Sales Performance* *As of third-quarter 2009 earnings call Annualized new-named sales $4.1B 2010 scheduled and early elective renewals expected to be ~$15 billion Client retention rate 99% Net-new sales >$4.0B |
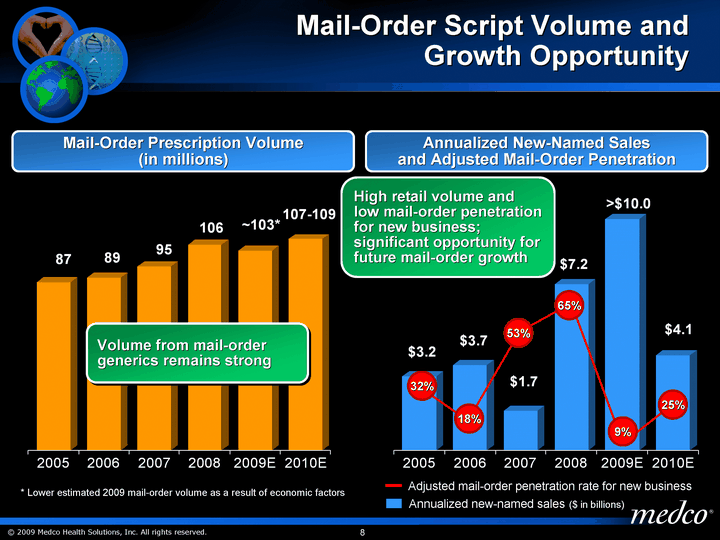
| Mail-Order Script Volume and Growth Opportunity Annualized new-named sales ($ in billions) 2005 2006 2007 2008 2009E 2010E New Business 4 4.7 2.9 Mail-Order Volume 87 89 95 106 103 109 Mail-Order Prescription Volume (in millions) Annualized New-Named Sales and Adjusted Mail-Order Penetration 2005 2006 2007 2008 2009E 2010E New Business 3.2 3.7 1.7 7.2 10 4.1 2005 A 2006 2007E 2008 2009E East % Penetration Rate 0.32 0.1789 0.532 0.6451 0.089 0.25 32% 18% 53% 65% 9% * Lower estimated 2009 mail-order volume as a result of economic factors Adjusted mail-order penetration rate for new business High retail volume and low mail-order penetration for new business; significant opportunity for future mail-order growth Volume from mail-order generics remains strong 25% |
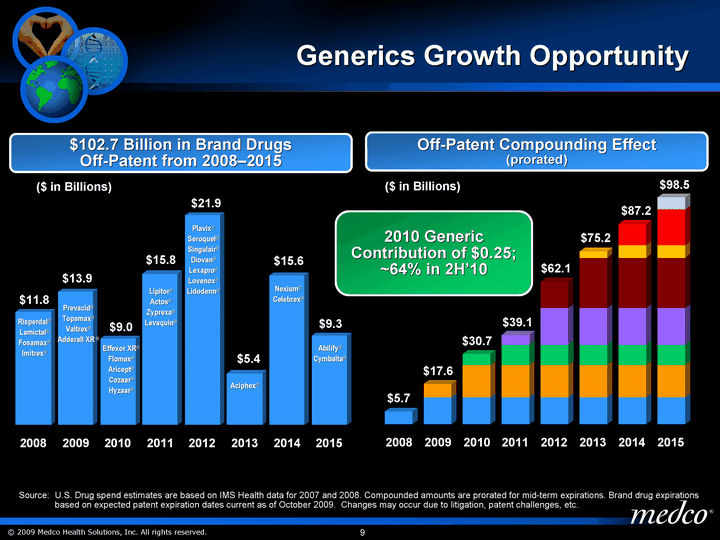
| 2008 2009 2010 2011 2012 2013 2014 2015 Acute Chronic/Complex 11.8 13.9 9 15.8 21.9 5.4 15.6 9.3 Generics Growth Opportunity Risperdal(r) Lamictal(r) Fosamax(r) Imitrex(r) Prevacid(r) Topamax(r) Valtrex(r) Adderall XR (r) Effexor XR(r) Flomax(r) Aricept(r) Cozaar(r) Hyzaar(r) Lipitor(r) Actos(r) Zyprexa(r) Levaquin(r) Plavix(r) Seroquel(r) Singulair(r) Diovan(r) Lexapro(r) Lovenox(r) Lidoderm(r) Source: U.S. Drug spend estimates are based on IMS Health data for 2007 and 2008. Compounded amounts are prorated for mid-term expirations. Brand drug expirations based on expected patent expiration dates current as of October 2009. Changes may occur due to litigation, patent challenges, etc. $11.8 $13.9 $9.0 $15.8 $21.9 $5.4 $15.6 $9.3 Aciphex(r) Nexium(r) Celebrex(r) Abilify(r) Cymbalta(r) 2008 2009 2010 2011 2012 2013 2014 2015 5.7 11.8 11.8 11.8 11.8 11.8 11.8 11.8 5.8 13.9 13.9 13.9 13.9 13.9 13.9 4.9 9 9 9 9 9 4.3 15.8 15.8 15.8 15.8 11.5 21.9 21.9 21.9 2.7 5.4 5.4 9.3 15.6 5.1 $5.7 $17.6 $30.7 $39.1 $62.1 $75.2 $87.2 $98.5 ($ in Billions) ($ in Billions) 2010 Generic Contribution of $0.25; ~64% in 2H'10 $102.7 Billion in Brand Drugs Off-Patent from 2008-2015 Off-Patent Compounding Effect (prorated) |
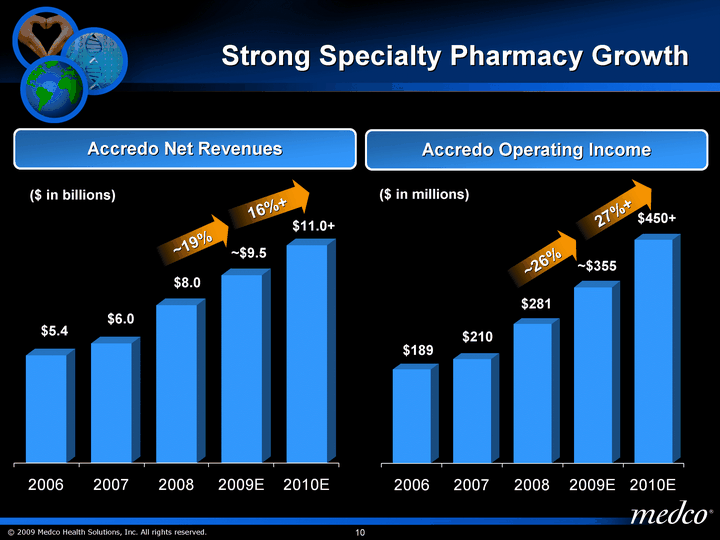
| 2006 2007 2008 2009E 2010E Acute Chronic/Complex 5437 6043 7974 9500 11000 Strong Specialty Pharmacy Growth Accredo Net Revenues $5.4 ~$9.5 $8.0 $6.0 Accredo Operating Income 2006 2007 2008 2009E 2010E 189 210 281 355 450 $189 $281 ~$355 $210 ~19% ($ in billions) ($ in millions) 16%+ $450+ $11.0+ ~26% 27%+ |
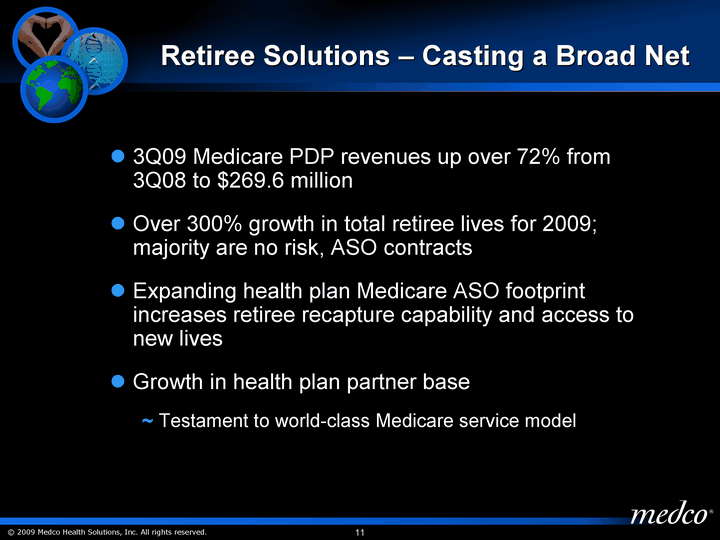
| Retiree Solutions - Casting a Broad Net 3Q09 Medicare PDP revenues up over 72% from 3Q08 to $269.6 million Over 300% growth in total retiree lives for 2009; majority are no risk, ASO contracts Expanding health plan Medicare ASO footprint increases retiree recapture capability and access to new lives Growth in health plan partner base Testament to world-class Medicare service model |
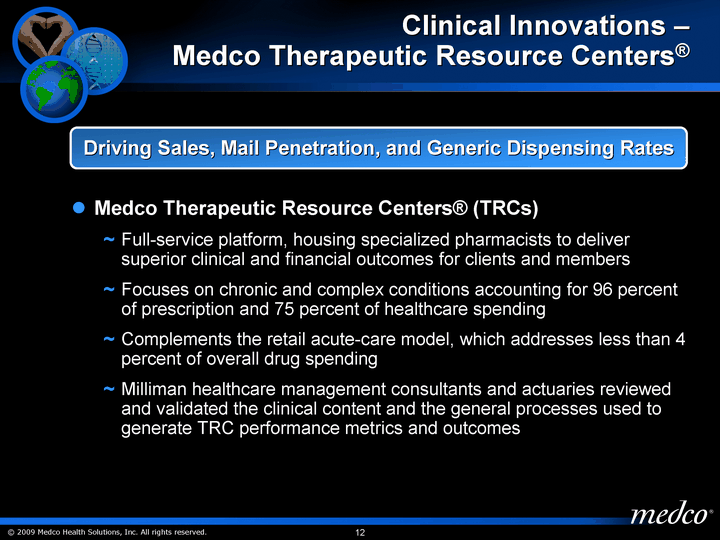
| Clinical Innovations - Medco Therapeutic Resource Centers(r) Medco Therapeutic Resource Centers(r) (TRCs) Full-service platform, housing specialized pharmacists to deliver superior clinical and financial outcomes for clients and members Focuses on chronic and complex conditions accounting for 96 percent of prescription and 75 percent of healthcare spending Complements the retail acute-care model, which addresses less than 4 percent of overall drug spending Milliman healthcare management consultants and actuaries reviewed and validated the clinical content and the general processes used to generate TRC performance metrics and outcomes Driving Sales, Mail Penetration, and Generic Dispensing Rates |
| Clinical Innovations - Personalized Medicine Pharmacogenomics ("Personalized Medicine") Leveraging the TRC platform, Medco launched two pilots using genetic tests to personalize with precision drug selection/delivery/dosing Collaboration with The Mayo Clinic for Coumadin Collaboration with LabCorp for Tamoxifen Intervention at the point of care results in reduction of overall healthcare costs New Indiana automated dispensing facility includes a world-class research center for personalized medicine |
| International Initiatives Acquired a majority stake in Netherlands-based Europa Apotheek Venlo, a mail-order pharmacy serving Germany Germany market had 2008 drug spend of $31 billion (Rx) and $6 billion (OTC) Opportunity leverages Medco's core competencies Partnered with Apoteket to create the first drug utilization review system in Sweden 2008 2009 Entered into a joint venture with United Drug plc, a Pan-European healthcare leader, to provide home-based pharmacy care services in the United Kingdom for patients covered by the country's National Health Service (NHS) U.K. is the third largest prescription drug market in Europe, with a population of over 60 million and drug spend over $23 billion Homecare pharmacy services currently comprise ~$1.6 billion of the U.K.'s prescription drug spending |
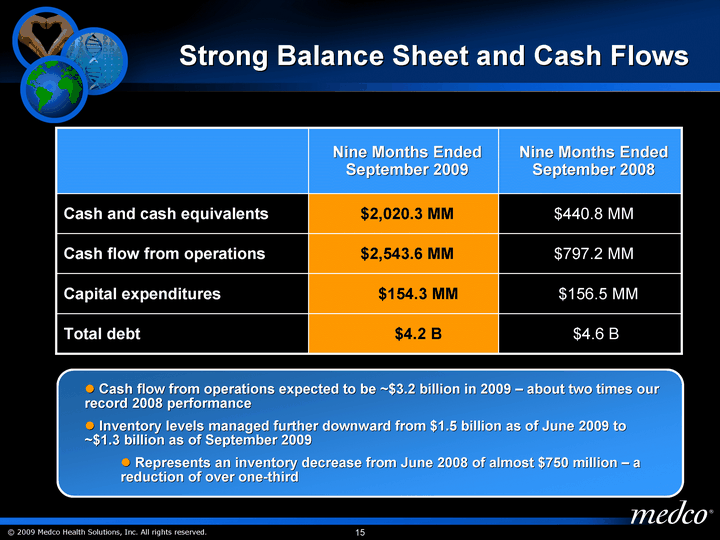
| Strong Balance Sheet and Cash Flows Nine Months Ended September 2009 Nine Months Ended September 2008 Cash and cash equivalents $2,020.3 MM $440.8 MM Cash flow from operations $2,543.6 MM $797.2 MM Capital expenditures $154.3 MM $156.5 MM Total debt $4.2 B $4.6 B Cash flow from operations expected to be ~$3.2 billion in 2009 - about two times our record 2008 performance Inventory levels managed further downward from $1.5 billion as of June 2009 to ~$1.3 billion as of September 2009 Represents an inventory decrease from June 2008 of almost $750 million - a reduction of over one-third |
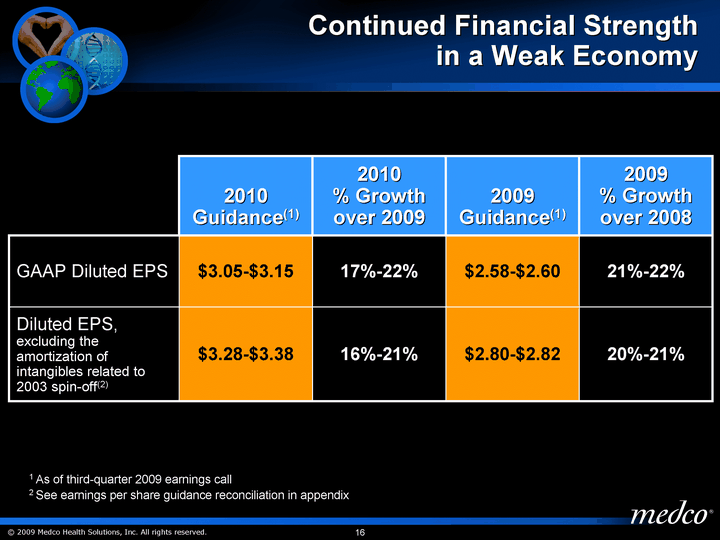
| Continued Financial Strength in a Weak Economy 2010 Guidance(1) 2010 % Growth over 2009 2009 Guidance(1) 2009 % Growth over 2008 GAAP Diluted EPS $3.05-$3.15 17%-22% $2.58-$2.60 21%-22% Diluted EPS, excluding the amortization of intangibles related to 2003 spin-off(2) $3.28-$3.38 16%-21% $2.80-$2.82 20%-21% 1 As of third-quarter 2009 earnings call 2 See earnings per share guidance reconciliation in appendix |

| (r) |
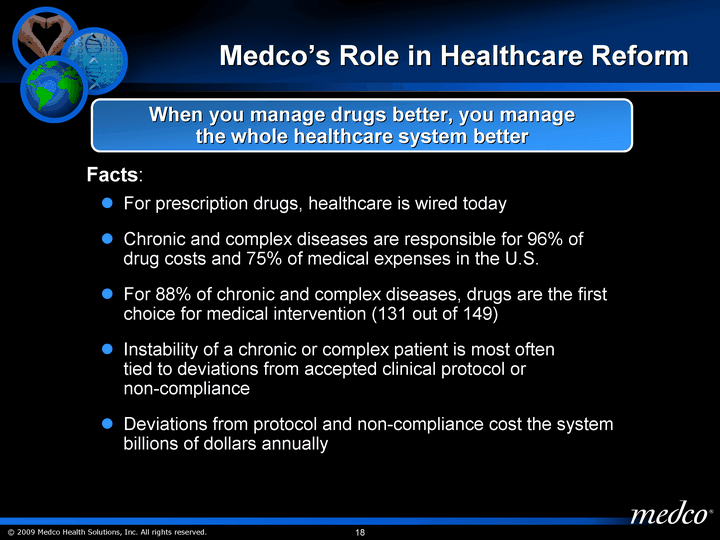
| Medco's Role in Healthcare Reform Facts: When you manage drugs better, you manage the whole healthcare system better For prescription drugs, healthcare is wired today Chronic and complex diseases are responsible for 96% of drug costs and 75% of medical expenses in the U.S. For 88% of chronic and complex diseases, drugs are the first choice for medical intervention (131 out of 149) Instability of a chronic or complex patient is most often tied to deviations from accepted clinical protocol or non-compliance Deviations from protocol and non-compliance cost the system billions of dollars annually |
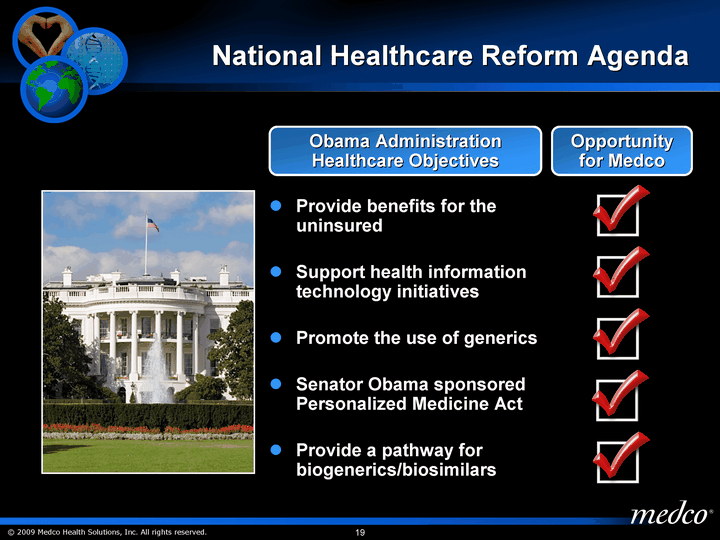
| National Healthcare Reform Agenda Provide benefits for the uninsured Support health information technology initiatives Promote the use of generics Senator Obama sponsored Personalized Medicine Act Provide a pathway for biogenerics/biosimilars Opportunity for Medco Obama Administration Healthcare Objectives |
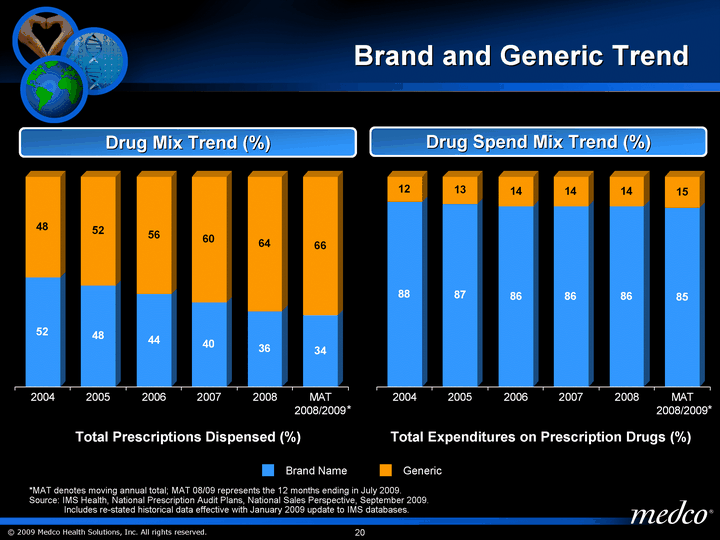
| Brand and Generic Trend *MAT denotes moving annual total; MAT 08/09 represents the 12 months ending in July 2009. Source: IMS Health, National Prescription Audit Plans, National Sales Perspective, September 2009. Includes re-stated historical data effective with January 2009 update to IMS databases. Brand Name Generic Total Prescriptions Dispensed (%) 2004 52 48 2005 48 52 2006 44 56 2007 40 60 2008 36 64 MAT 2008/2009 34 66 Drug Mix Trend (%) 2004 88 12 2005 87 13 2006 86 14 2007 86 14 2008 86 14 MAT 2008/2009 85 15 Drug Spend Mix Trend (%) Total Expenditures on Prescription Drugs (%) * * |
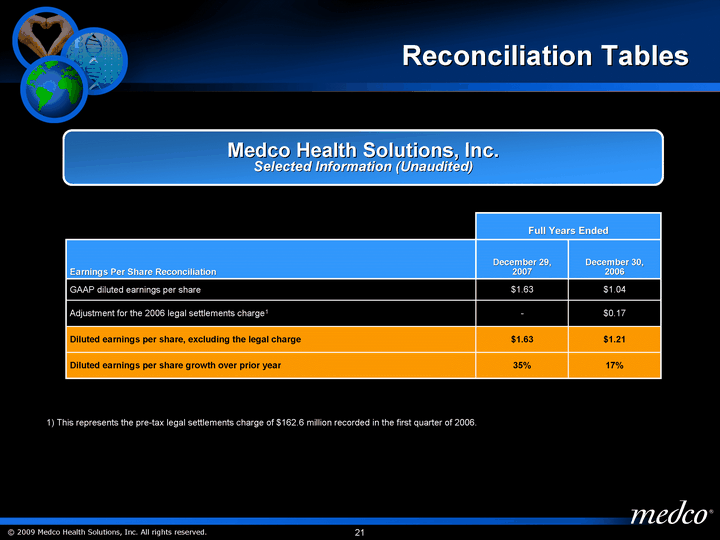
| Reconciliation Tables Medco Health Solutions, Inc. Selected Information (Unaudited) Full Years Ended Full Years Ended Earnings Per Share Reconciliation December 29, 2007 December 30, 2006 GAAP diluted earnings per share $1.63 $1.04 Adjustment for the 2006 legal settlements charge1 - $0.17 Diluted earnings per share, excluding the legal charge $1.63 $1.21 Diluted earnings per share growth over prior year 35% 17% 1) This represents the pre-tax legal settlements charge of $162.6 million recorded in the first quarter of 2006. |
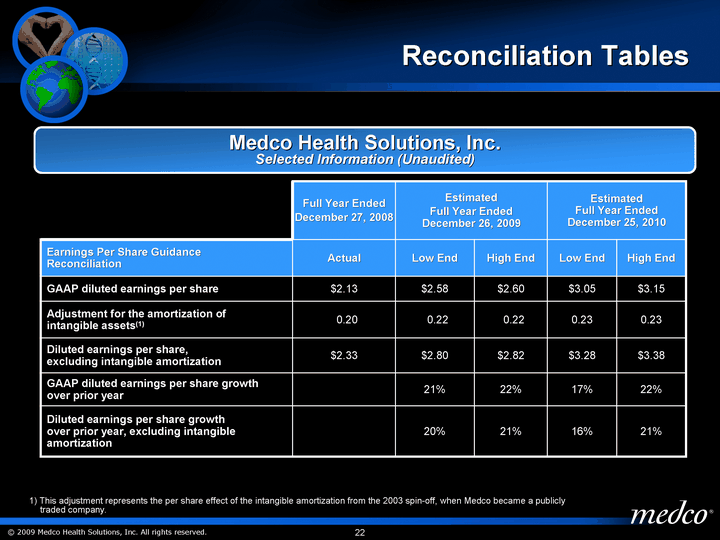
| Reconciliation Tables Full Year Ended December 27, 2008 Estimated Full Year Ended December 26, 2009 Estimated Full Year Ended December 26, 2009 Estimated Full Year Ended December 25, 2010 Estimated Full Year Ended December 25, 2010 Earnings Per Share Guidance Reconciliation Actual Low End High End Low End High End GAAP diluted earnings per share $2.13 $2.58 $2.60 $3.05 $3.15 Adjustment for the amortization of intangible assets(1) 0.20 0.22 0.22 0.23 0.23 Diluted earnings per share, excluding intangible amortization $2.33 $2.80 $2.82 $3.28 $3.38 GAAP diluted earnings per share growth over prior year 21% 22% 17% 22% Diluted earnings per share growth over prior year, excluding intangible amortization 20% 21% 16% 21% Medco Health Solutions, Inc. Selected Information (Unaudited) 1) This adjustment represents the per share effect of the intangible amortization from the 2003 spin-off, when Medco became a publicly traded company. |
