Ally Financial Inc. - FORM 8-K - EX-99.2 - November 4, 2009
Attached files
 Preliminary
2009 Third Quarter Results
November 4, 2009
9:00 AM EST
Contact GMAC Investor Relations at (866) 710-4623 or investor.relations@gmacfs.com
 Forward-Looking Statements
In the presentation that follows and related comments by GMAC Inc. (“GMAC”) management, the use of the words “expect,”
Forward-Looking Statements
In the presentation that follows and related comments by GMAC Inc. (“GMAC”) management, the use of the words “expect,”
“anticipate,” “estimate,” “forecast,”
“initiative,” “objective,” “plan,” “goal,” “project,” “outlook,” “priorities,” “target,” “intend,”
“evaluate,” “pursue,” “seek,” “may,”
“would,” “could,” “should,” “believe,” “potential,” “continue,” or similar expressions is intended
to identify forward-looking statements. All statements herein and in related management comments,
other than statements of
historical fact, including without limitation, statements about future events and financial performance, are forward-looking
statements that involve certain risks and uncertainties. While these statements represent our current
judgment on what the future
may hold, and we believe these judgments are reasonable, these statements are not guarantees of any events or financial
results, and GMAC’s and Residential Capital, LLC’s (“ResCap”) actual results may
differ materially due to numerous important
factors that are described in the most recent reports on SEC Forms 10-K and 10-Q for GMAC and ResCap, each of which may
be revised or supplemented in subsequent reports on SEC Forms 10-Q and 8-K. Such factors
include, among others, the
following: our inability to successfully accommodate the additional risk exposure relating to providing wholesale and retail
financing to Chrysler dealers and customers and the resulting impact to our financial stability;
uncertainty related to Chrysler’s
and GM’s recent exits from bankruptcy; uncertainty related to the new financing arrangement between GMAC and Chrysler;
securing low cost funding for GMAC and ResCap and maintaining the mutually beneficial
relationship between GMAC and GM,
and GMAC and Chrysler; our ability to maintain an appropriate level of debt and capital; the profitability and financial condition of
GM and Chrysler; our ability to realize the anticipated benefits associated with
our recent conversion to a bank holding company,
and the increased regulation and restrictions that we are subject to; continued challenges in the residential mortgage and capital
markets; the potential for deterioration in the residual value of off-lease
vehicles; the continuing negative impact on ResCap of
the decline in the U.S. housing market; changes in U.S. government-sponsored mortgage programs or disruptions in the markets
in which our mortgage subsidiaries operate; disruptions in the market
in which we fund GMAC’s and ResCap’s operations, with
resulting negative impact on our liquidity; changes in our accounting assumptions that may require or that result from changes in
the accounting rules or their application, which could
result in an impact on earnings; changes in the credit ratings of ResCap,
GMAC, Chrysler or GM; changes in economic conditions, currency exchange rates or political stability in the markets in which we
operate; and changes in the existing or the adoption
of new laws, regulations, policies or other activities of governments,
agencies and similar organizations. Investors are cautioned not to place undue reliance on forward-looking statements. GMAC
undertakes no obligation to update publicly
or otherwise revise any forward-looking statements except where expressly required
by law. A reconciliation of certain non-GAAP financial measures included within this presentation is provided in
the supplemental charts.
Use of the term “loans” describes products associated with direct and indirect lending activities of GMAC’s global operations.
The specific products include retail installment sales
contracts, loans, lines of credit, leases or other financing products. The term
“originate” refers to GMAC’s purchase, acquisition or direct origination of various “loan” products.
2
 GMAC: Significant Recent Events
4/09 Became preferred provider of financing for
GMAC: Significant Recent Events
4/09 Became preferred provider of financing for
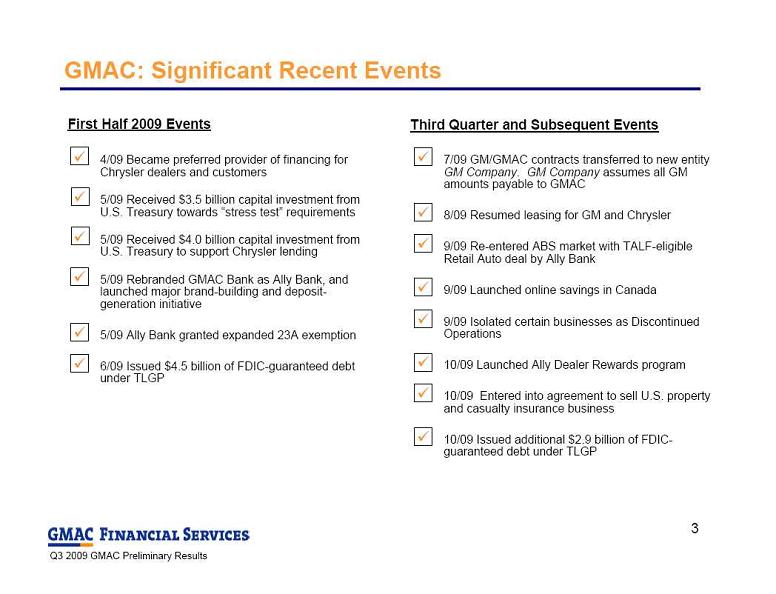
Chrysler dealers and customers
5/09 Received $3.5 billion capital investment from
U.S. Treasury towards “stress test” requirements
5/09 Received $4.0 billion capital investment from
U.S. Treasury to support Chrysler lending
5/09 Rebranded GMAC Bank as Ally Bank, and
launched major brand-building and deposit-
generation initiative
5/09 Ally Bank granted expanded 23A exemption
6/09 Issued $4.5 billion of FDIC-guaranteed debt
under TLGP
7/09 GM/GMAC contracts transferred to new entity
GM Company
. GM Company assumes all GM
amounts payable to GMAC
8/09 Resumed leasing for GM and Chrysler
9/09 Re-entered ABS market with TALF-eligible
Retail Auto deal by Ally Bank
9/09 Launched online savings in Canada
9/09 Isolated certain businesses as Discontinued
Operations
10/09 Launched Ally Dealer Rewards program
10/09 Entered into agreement to sell U.S. property
and casualty insurance business
10/09 Issued additional $2.9 billion of FDIC-
guaranteed debt under TLGP
First Half 2009 Events
Third Quarter and Subsequent Events
3
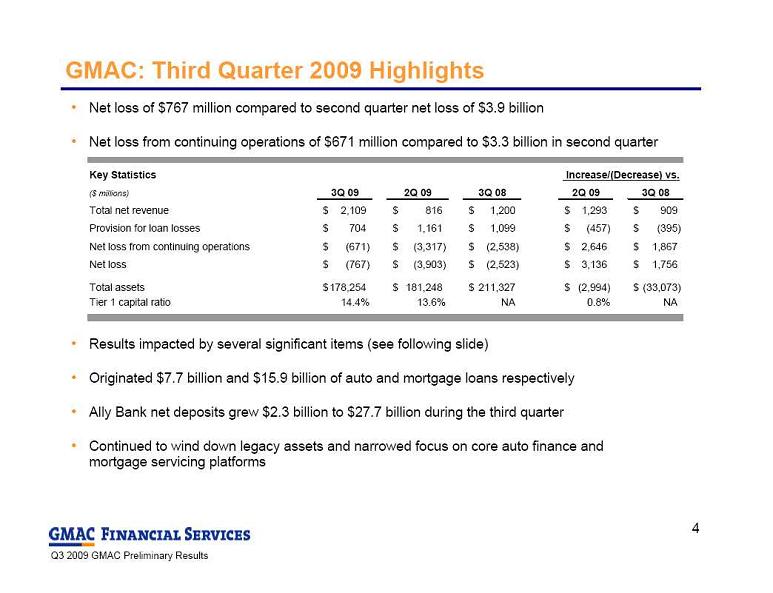 Net loss of $767 million compared to second quarter net loss of $3.9 billion
Net loss from continuing operations of $671 million compared to $3.3 billion in second quarter
Results impacted by several significant items (see following slide)
Originated $7.7 billion and $15.9 billion of auto and mortgage loans respectively
Ally Bank net deposits grew $2.3 billion to $27.7 billion during the third quarter
Continued to wind down legacy assets and narrowed focus on core auto finance and
Net loss of $767 million compared to second quarter net loss of $3.9 billion
Net loss from continuing operations of $671 million compared to $3.3 billion in second quarter
Results impacted by several significant items (see following slide)
Originated $7.7 billion and $15.9 billion of auto and mortgage loans respectively
Ally Bank net deposits grew $2.3 billion to $27.7 billion during the third quarter
Continued to wind down legacy assets and narrowed focus on core auto finance and
mortgage servicing platforms
GMAC: Third Quarter 2009 Highlights
Key Statistics
($ millions)
3Q 09
2Q 09
3Q 08
2Q 09
3Q 08
Total net revenue
2,109
$
816
$
1,200
$
1,293
$
909
$
Provision for loan losses
704
$
1,161
$
1,099
$
(457)
$
(395)
$
Net loss from continuing operations
(671)
$
(3,317)
$
(2,538)
$
2,646
$
1,867
$
Net loss
(767)
$
(3,903)
$
(2,523)
$
3,136
$
1,756
$
Total assets
178,254
$
181,248
$
211,327
$
(2,994)
$
(33,073)
$
Tier 1 capital ratio
14.4%
13.6%
NA
0.8%
NA
Increase/(Decrease) vs.
4
 Certain business lines were isolated as discontinued operations as they are being sold
Several significant items impacted third quarter results
GMAC: Significant Items Impacting Earnings
(1) Includes provision, impairments and reserves on certain non-bank mortgage assets.
Note: Loss of ($266) million includes additional significant items that were not reflected in the ($429) million loss shown in the second quarter earnings
Certain business lines were isolated as discontinued operations as they are being sold
Several significant items impacted third quarter results
GMAC: Significant Items Impacting Earnings
(1) Includes provision, impairments and reserves on certain non-bank mortgage assets.
Note: Loss of ($266) million includes additional significant items that were not reflected in the ($429) million loss shown in the second quarter earnings
presentation: $344 million amortization of bond
exchange discount and $62 million of mark-to-market on auto retained interests. 2Q09 loss above excludes $114
million of tax expense related to discontinued operations.
($ millions)
3Q 09
2Q 09
Loss from continuing operations
(671)
$
(3,317)
$
Income tax (benefit) expense from continuing operations
(292)
1,099
Loss from continuing operations before income tax expense
(963)
(2,218)
Mortgage repurchase reserve expense
515
231
Loss provision on resort finance assets
161
105
Legacy mortgage provision expense
1
79
504
Commercial and International mortgage portfolio marks / write-downs
(23)
830
Amortization of bond exchange discount
309
344
Mark-to-market on auto retained interests (gain)
(155)
(62)
Loss excluding above items
(77)
$
(266)
$
5
 GMAC: Income by Segment
(1) Corporate and Other segment includes Commercial Finance, equity investments, amortization of original issue discount from GMAC bond exchange, and
GMAC: Income by Segment
(1) Corporate and Other segment includes Commercial Finance, equity investments, amortization of original issue discount from GMAC bond exchange, and
other corporate activities.
(2) Discontinued Operations currently includes: U.S. property and casualty insurance (Insurance segment); Argentina operations, United Kingdom full-service
leasing and Italy full-service leasing from International
Operations (Global Automotive Finance Segment). Other businesses may be included in discontinued
operations in the future.
Global Auto Finance: Continued normalization of origination volumes, credit expenses
and used vehicle
prices
Insurance: Increased focus on dealer related products to complement auto finance business
Mortgage Operations: Further credit related costs outweigh stronger net revenue
Corporate/Other: Continued amortization of original issue discount from the 2008 bond exchanges and loss
provision on the Resort Finance
portfolio
($ millions)
3Q 09
2Q 09
3Q 08
2Q 09
3Q 08
North American Automotive Finance
345
$
302
$
(323)
$
43
$
668
$
International Automotive Finance
50
45
(56)
5
106
Global Automotive Finance
395
347
(379)
48
774
Insurance
81
95
73
(14)
8
Mortgage Operations
(747)
(2,044)
(1,949)
1,297
1,202
Corporate and Other
1
(692)
(616)
(384)
(76)
(308)
Loss from continuing operations
(963)
(2,218)
(2,639)
1,255
1,676
Income tax (benefit) expense
(292)
1,099
(101)
(1,391)
(191)
Discontinued Operations
2
(96)
(586)
15
490
(111)
Loss
(767)
$
(3,903)
$
(2,523)
$
3,136
$
1,756
$
Increase/(Decrease) vs.
6
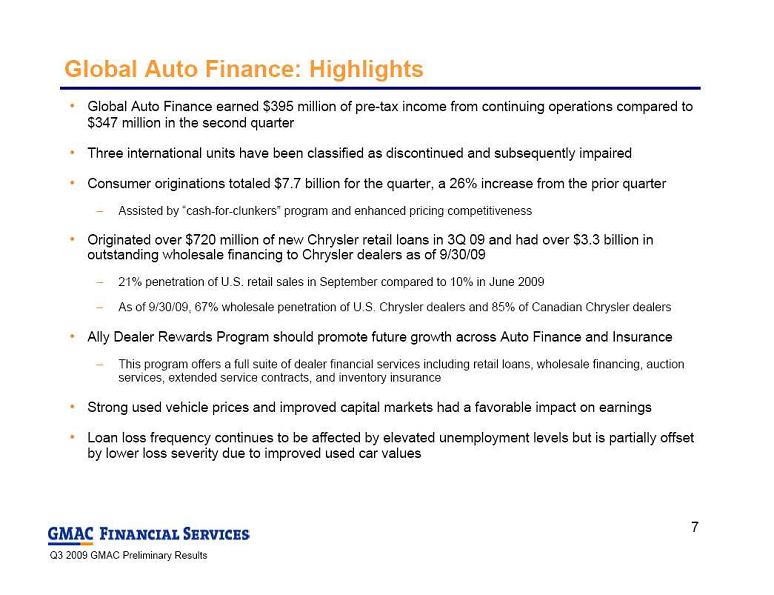 Global Auto Finance: Highlights
Global Auto Finance earned $395 million of pre-tax income from continuing operations compared to
Global Auto Finance: Highlights
Global Auto Finance earned $395 million of pre-tax income from continuing operations compared to
$347
million in the second quarter
Three international units have been classified as discontinued and subsequently impaired
Consumer originations totaled $7.7 billion for the quarter, a 26% increase from the prior quarter
Assisted by “cash-for-clunkers” program and enhanced pricing competitiveness
Originated over $720 million of new Chrysler retail loans in 3Q 09 and had over $3.3 billion in
outstanding wholesale financing to Chrysler dealers as
of 9/30/09
21% penetration of U.S. retail sales in September compared to 10% in June 2009
As of 9/30/09, 67% wholesale penetration of U.S. Chrysler dealers and 85% of Canadian Chrysler dealers
Ally Dealer Rewards Program should promote future growth across Auto Finance and Insurance
This program offers a full suite of dealer financial services including retail loans, wholesale financing, auction
services, extended service contracts, and inventory insurance
Strong used vehicle prices and improved capital markets had a favorable impact on earnings
Loan loss frequency continues to be affected by elevated unemployment levels but is partially offset
by lower loss severity due to improved used car values
7
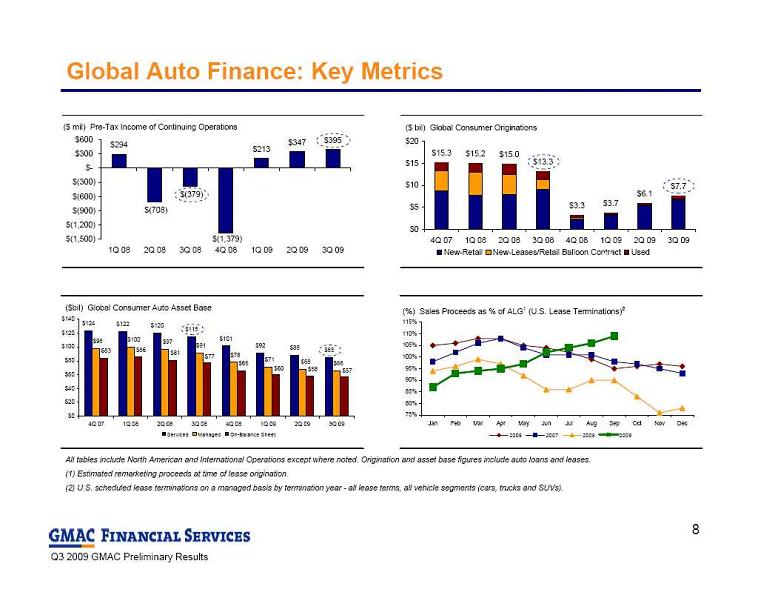 Global Auto Finance: Key Metrics
All tables include North American and International Operations except where noted. Origination and asset base figures include auto loans and leases.
(1) Estimated remarketing proceeds at time of lease origination.
(2) U.S. scheduled lease terminations on a managed basis by termination year - all lease terms, all vehicle segments (cars, trucks and SUVs).
0.4
($ mil) Pre-Tax Income of Continuing Operations
$294
$(708)
$(379)
$213
$347
$395
$(1,379)
$(1,500)
$(1,200)
$(900)
$(600)
$(300)
$-
$300
$600
1Q 08
2Q 08
3Q 08
4Q 08
1Q 09
2Q 09
3Q 09
($ bil) Global Consumer Originations
$15.3
$15.2
$15.0
$13.3
$3.3
$3.7
$6.1
$7.7
$0
$5
$10
$15
$20
4Q 07
1Q 08
2Q 08
3Q 08
4Q 08
1Q 09
2Q 09
3Q 09
New-Retail
New-Leases/Retail Balloon Contract
Used
Total
($bil) Global Consumer Auto Asset Base
$124
$122
$120
$115
$101
$92
$88
$85
$66
$68
$71
$78
$91
$97
$100
$98
$57
$58
$60
$66
$77
$81
$86
$83
$0
$20
$40
$60
$80
$100
$120
$140
4Q 07
1Q 08
2Q 08
3Q 08
4Q 08
1Q 09
2Q 09
3Q 09
Serviced
Managed
On-Balance Sheet
(%) Sales Proceeds as % of ALG
1
(U.S. Lease Terminations)
2
75%
80%
85%
90%
95%
100%
105%
110%
115%
Jan
Feb
Mar
Apr
May
Jun
Jul
Aug
Sep
Oct
Nov
Dec
2006
2007
2008
2009
8
Global Auto Finance: Key Metrics
All tables include North American and International Operations except where noted. Origination and asset base figures include auto loans and leases.
(1) Estimated remarketing proceeds at time of lease origination.
(2) U.S. scheduled lease terminations on a managed basis by termination year - all lease terms, all vehicle segments (cars, trucks and SUVs).
0.4
($ mil) Pre-Tax Income of Continuing Operations
$294
$(708)
$(379)
$213
$347
$395
$(1,379)
$(1,500)
$(1,200)
$(900)
$(600)
$(300)
$-
$300
$600
1Q 08
2Q 08
3Q 08
4Q 08
1Q 09
2Q 09
3Q 09
($ bil) Global Consumer Originations
$15.3
$15.2
$15.0
$13.3
$3.3
$3.7
$6.1
$7.7
$0
$5
$10
$15
$20
4Q 07
1Q 08
2Q 08
3Q 08
4Q 08
1Q 09
2Q 09
3Q 09
New-Retail
New-Leases/Retail Balloon Contract
Used
Total
($bil) Global Consumer Auto Asset Base
$124
$122
$120
$115
$101
$92
$88
$85
$66
$68
$71
$78
$91
$97
$100
$98
$57
$58
$60
$66
$77
$81
$86
$83
$0
$20
$40
$60
$80
$100
$120
$140
4Q 07
1Q 08
2Q 08
3Q 08
4Q 08
1Q 09
2Q 09
3Q 09
Serviced
Managed
On-Balance Sheet
(%) Sales Proceeds as % of ALG
1
(U.S. Lease Terminations)
2
75%
80%
85%
90%
95%
100%
105%
110%
115%
Jan
Feb
Mar
Apr
May
Jun
Jul
Aug
Sep
Oct
Nov
Dec
2006
2007
2008
2009
8
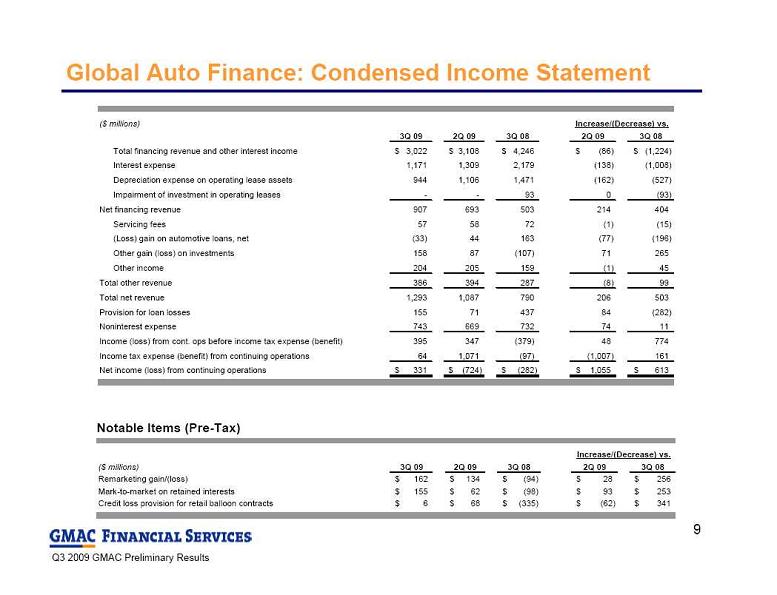 Global Auto Finance: Condensed Income Statement
Notable Items (Pre-Tax)
($ millions)
3Q 09
2Q 09
3Q 08
2Q 09
3Q 08
Total financing revenue and other interest income
3,022
$
3,108
$
4,246
$
(86)
$
(1,224)
$
Interest expense
1,171
1,309
2,179
(138)
(1,008)
Depreciation expense on operating lease assets
944
1,106
1,471
(162)
(527)
Impairment of investment in operating leases
-
-
93
0
(93)
Net financing revenue
907
693
503
214
404
Servicing fees
57
58
72
(1)
(15)
(Loss) gain on automotive loans, net
(33)
44
163
(77)
(196)
Other gain (loss) on investments
158
87
(107)
71
265
Other income
204
205
159
(1)
45
Total other revenue
386
394
287
(8)
99
Total net revenue
1,293
1,087
790
206
503
Provision for loan losses
155
71
437
84
(282)
Noninterest expense
743
669
732
74
11
Income (loss) from cont. ops before income tax expense (benefit)
395
347
(379)
48
774
Income tax expense (benefit) from continuing operations
64
1,071
(97)
(1,007)
161
Net income (loss) from continuing operations
331
$
(724)
$
(282)
$
1,055
$
613
$
Increase/(Decrease) vs.
($ millions)
3Q 09
2Q 09
3Q 08
2Q 09
3Q 08
Remarketing gain/(loss)
162
$
134
$
(94)
$
28
$
256
$
Mark-to-market on retained interests
155
$
62
$
(98)
$
93
$
253
$
Credit loss provision for retail balloon contracts
6
$
68
$
(335)
$
(62)
$
341
$
Increase/(Decrease) vs.
9
Global Auto Finance: Condensed Income Statement
Notable Items (Pre-Tax)
($ millions)
3Q 09
2Q 09
3Q 08
2Q 09
3Q 08
Total financing revenue and other interest income
3,022
$
3,108
$
4,246
$
(86)
$
(1,224)
$
Interest expense
1,171
1,309
2,179
(138)
(1,008)
Depreciation expense on operating lease assets
944
1,106
1,471
(162)
(527)
Impairment of investment in operating leases
-
-
93
0
(93)
Net financing revenue
907
693
503
214
404
Servicing fees
57
58
72
(1)
(15)
(Loss) gain on automotive loans, net
(33)
44
163
(77)
(196)
Other gain (loss) on investments
158
87
(107)
71
265
Other income
204
205
159
(1)
45
Total other revenue
386
394
287
(8)
99
Total net revenue
1,293
1,087
790
206
503
Provision for loan losses
155
71
437
84
(282)
Noninterest expense
743
669
732
74
11
Income (loss) from cont. ops before income tax expense (benefit)
395
347
(379)
48
774
Income tax expense (benefit) from continuing operations
64
1,071
(97)
(1,007)
161
Net income (loss) from continuing operations
331
$
(724)
$
(282)
$
1,055
$
613
$
Increase/(Decrease) vs.
($ millions)
3Q 09
2Q 09
3Q 08
2Q 09
3Q 08
Remarketing gain/(loss)
162
$
134
$
(94)
$
28
$
256
$
Mark-to-market on retained interests
155
$
62
$
(98)
$
93
$
253
$
Credit loss provision for retail balloon contracts
6
$
68
$
(335)
$
(62)
$
341
$
Increase/(Decrease) vs.
9
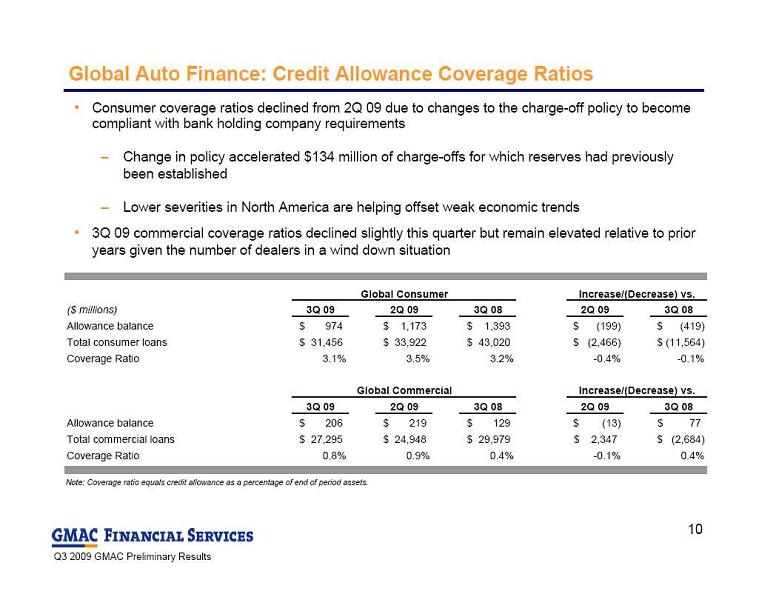 Global Auto Finance: Credit Allowance Coverage Ratios
Consumer coverage ratios declined from 2Q 09 due to changes to the charge-off policy to become
Global Auto Finance: Credit Allowance Coverage Ratios
Consumer coverage ratios declined from 2Q 09 due to changes to the charge-off policy to become
compliant with bank holding company requirements
Change in policy accelerated $134 million of charge-offs for which reserves had previously
been established
Lower severities in North America are helping offset weak economic trends
3Q 09 commercial coverage ratios declined slightly this quarter but remain elevated relative to prior
years given the number of dealers in a wind down
situation
Note: Coverage ratio equals credit allowance as a percentage of end of period assets.
Global Consumer
($ millions)
3Q 09
2Q 09
3Q 08
2Q 09
3Q 08
Allowance balance
974
$
1,173
$
1,393
$
(199)
$
(419)
$
Total consumer loans
31,456
$
33,922
$
43,020
$
(2,466)
$
(11,564)
$
Coverage Ratio
3.1%
3.5%
3.2%
-0.4%
-0.1%
Global Commercial
3Q 09
2Q 09
3Q 08
2Q 09
3Q 08
Allowance balance
206
$
219
$
129
$
(13)
$
77
$
Total commercial loans
27,295
$
24,948
$
29,979
$
2,347
$
(2,684)
$
Coverage Ratio
0.8%
0.9%
0.4%
-0.1%
0.4%
Increase/(Decrease) vs.
Increase/(Decrease) vs.
10
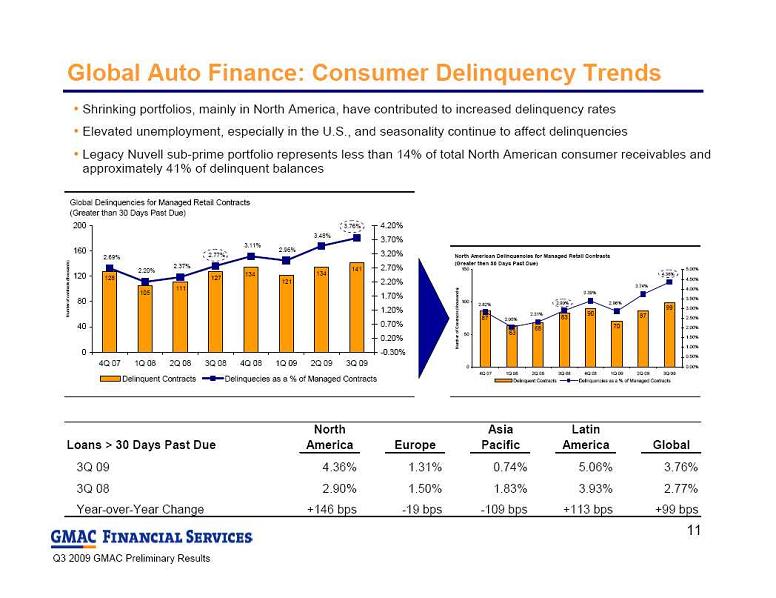 Shrinking portfolios, mainly in North America, have contributed to increased delinquency rates
Elevated unemployment, especially in the U.S., and seasonality continue to affect delinquencies
Legacy Nuvell sub-prime portfolio represents less than 14% of total North American consumer receivables and
Shrinking portfolios, mainly in North America, have contributed to increased delinquency rates
Elevated unemployment, especially in the U.S., and seasonality continue to affect delinquencies
Legacy Nuvell sub-prime portfolio represents less than 14% of total North American consumer receivables and
approximately 41% of delinquent balances
Global Auto Finance: Consumer Delinquency Trends
Global Delinquencies for Managed Retail Contracts
(Greater than 30 Days Past Due)
141
134
134
127
111
105
128
121
3.76%
3.48%
2.96%
3.11%
2.77%
2.37%
2.20%
2.69%
0
40
80
120
160
200
4Q 07
1Q 08
2Q 08
3Q 08
4Q 08
1Q 09
2Q 09
3Q 09
-0.30%
0.20%
0.70%
1.20%
1.70%
2.20%
2.70%
3.20%
3.70%
4.20%
Delinquent Contracts
Delinquecies as a % of Managed Contracts
North American Delinquencies for Managed Retail Contracts
(Greater then 30 Days Past Due)
99
87
70
90
83
68
63
87
4.36%
3.74%
2.86%
3.39%
2.90%
2.31%
2.05%
2.82%
0
50
100
150
4Q 07
1Q 08
2Q 08
3Q 08
4Q 08
1Q 09
2Q 09
3Q 09
0.00%
0.50%
1.00%
1.50%
2.00%
2.50%
3.00%
3.50%
4.00%
4.50%
5.00%
Delinquent Contracts
Delinquencies as a % of Managed Contracts
Loans > 30 Days Past Due
North
America
Europe
Asia
Pacific
Latin
America
Global
3Q 09
4.36%
1.31%
0.74%
5.06%
3.76%
3Q 08
2.90%
1.50%
1.83%
3.93%
2.77%
Year-over-Year Change
+146 bps
-19 bps
-109 bps
+113 bps
+99 bps
11
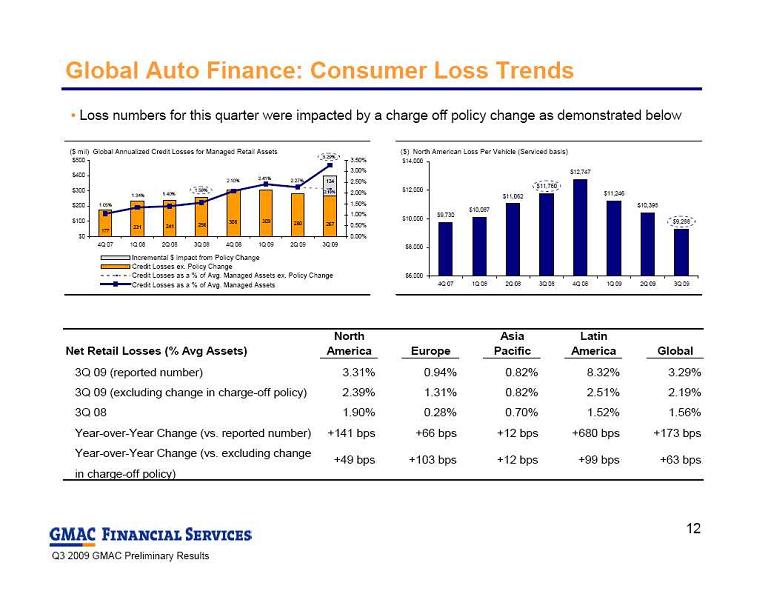 Global Auto Finance: Consumer Loss Trends
Loss numbers for this quarter were impacted by a charge off policy change as demonstrated below
($ mil) Global Annualized Credit Losses for Managed Retail Assets
267
280
306
256
241
231
177
309
134
3.29%
2.27%
2.41%
2.10%
1.56%
1.40%
1.34%
1.05%
2.19%
$0
$100
$200
$300
$400
$500
4Q 07
1Q 08
2Q 08
3Q 08
4Q 08
1Q 09
2Q 09
3Q 09
0.00%
0.50%
1.00%
1.50%
2.00%
2.50%
3.00%
3.50%
Incremental $ Impact from Policy Change
Credit Losses ex. Policy Change
Credit Losses as a % of Avg. Managed Assets ex. Policy Change
Credit Losses as a % of Avg. Managed Assets
Delinquent
Contracts
Delinquencies
as a % of
Managed
Contracts
($) North American Loss Per Vehicle (Serviced basis)
$9,730
$10,087
$11,062
$11,760
$12,747
$11,246
$10,398
$9,288
$6,000
$8,000
$10,000
$12,000
$14,000
4Q 07
1Q 08
2Q 08
3Q 08
4Q 08
1Q 09
2Q 09
3Q 09
Net Retail Losses (% Avg Assets)
North
America
Europe
Asia
Pacific
Latin
America
Global
3Q 09 (reported number)
3.31%
0.94%
0.82%
8.32%
3.29%
3Q 09 (excluding change in charge-off policy)
2.39%
1.31%
0.82%
2.51%
2.19%
3Q 08
1.90%
0.28%
0.70%
1.52%
1.56%
Year-over-Year Change (vs. reported number)
+141 bps
+66 bps
+12 bps
+680 bps
+173 bps
Year-over-Year Change (vs. excluding change
in charge-off policy)
+63 bps
+49 bps
+103 bps
+12 bps
+99 bps
12
Global Auto Finance: Consumer Loss Trends
Loss numbers for this quarter were impacted by a charge off policy change as demonstrated below
($ mil) Global Annualized Credit Losses for Managed Retail Assets
267
280
306
256
241
231
177
309
134
3.29%
2.27%
2.41%
2.10%
1.56%
1.40%
1.34%
1.05%
2.19%
$0
$100
$200
$300
$400
$500
4Q 07
1Q 08
2Q 08
3Q 08
4Q 08
1Q 09
2Q 09
3Q 09
0.00%
0.50%
1.00%
1.50%
2.00%
2.50%
3.00%
3.50%
Incremental $ Impact from Policy Change
Credit Losses ex. Policy Change
Credit Losses as a % of Avg. Managed Assets ex. Policy Change
Credit Losses as a % of Avg. Managed Assets
Delinquent
Contracts
Delinquencies
as a % of
Managed
Contracts
($) North American Loss Per Vehicle (Serviced basis)
$9,730
$10,087
$11,062
$11,760
$12,747
$11,246
$10,398
$9,288
$6,000
$8,000
$10,000
$12,000
$14,000
4Q 07
1Q 08
2Q 08
3Q 08
4Q 08
1Q 09
2Q 09
3Q 09
Net Retail Losses (% Avg Assets)
North
America
Europe
Asia
Pacific
Latin
America
Global
3Q 09 (reported number)
3.31%
0.94%
0.82%
8.32%
3.29%
3Q 09 (excluding change in charge-off policy)
2.39%
1.31%
0.82%
2.51%
2.19%
3Q 08
1.90%
0.28%
0.70%
1.52%
1.56%
Year-over-Year Change (vs. reported number)
+141 bps
+66 bps
+12 bps
+680 bps
+173 bps
Year-over-Year Change (vs. excluding change
in charge-off policy)
+63 bps
+49 bps
+103 bps
+12 bps
+99 bps
12
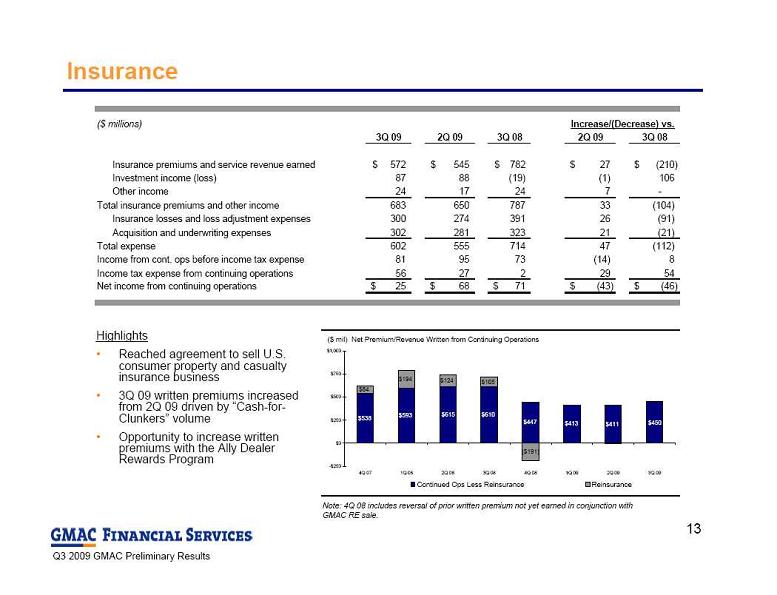 Insurance
Highlights
Reached agreement to sell U.S.
Insurance
Highlights
Reached agreement to sell U.S.
consumer property and casualty
insurance business
3Q 09 written premiums increased
from 2Q 09 driven by “Cash-for-
Clunkers” volume
Opportunity to increase written
premiums with the Ally Dealer
Rewards Program
Note: 4Q 08 includes reversal of prior written premium not yet earned in conjunction with
GMAC RE sale.
($ millions)
3Q 09
2Q 09
3Q 08
2Q 09
3Q 08
Insurance premiums and service revenue earned
572
$
545
$
782
$
27
$
(210)
$
Investment income (loss)
87
88
(19)
(1)
106
Other income
24
17
24
7
-
Total insurance premiums and other income
683
650
787
33
(104)
Insurance losses and loss adjustment expenses
300
274
391
26
(91)
Acquisition and underwriting expenses
302
281
323
21
(21)
Total expense
602
555
714
47
(112)
Income from cont. ops before income tax expense
81
95
73
(14)
8
Income tax expense from continuing operations
56
27
2
29
54
Net income from continuing operations
25
$
68
$
71
$
(43)
$
(46)
$
Increase/(Decrease) vs.
($ mil) Net Premium/Revenue Written from Continuing Operations
$593
$610
$411
$84
$194
$124
$105
($191)
$538
$615
$447
$413
$450
-$250
$0
$250
$500
$750
$1,000
4Q 07
1Q 08
2Q 08
3Q 08
4Q 08
1Q 09
2Q 09
3Q 09
Continued Ops Less Reinsurance
Reinsurance
13
 Mortgage Operations: Highlights
Mortgage Operations includes ResCap, LLC as well as the mortgage activities of Ally Bank and
Mortgage Operations: Highlights
Mortgage Operations includes ResCap, LLC as well as the mortgage activities of Ally Bank and
ResMor Trust
Mortgage Operations results differ materially from ResCap, LLC
The Mortgage Operations segment experienced a net loss for the quarter driven primarily by repurchase
reserve expense
Provision for loan losses decreased to $349 million in the third quarter from $916 million in the
second quarter
Loan repurchase reserves were increased resulting in an expense of $515 million
Stronger net revenue of $585 million driven by improved core business margins and net servicing
revenue
Originated $15.9 billion of new mortgage loans consisting of conforming, government and limited
amount of high quality jumbo loans
Down slightly from last quarter due to lower refinancing volume but up 34% year over year
GMAC continues to help homeowners restructure their loans through participation in the Home
Affordable Modification Program
14
 Mortgage Operations: Key Metrics
Note: Government and prime second liens are included in prime non-conforming.
Total assets include $3.8 billion of assets securitized
Mortgage Operations: Key Metrics
Note: Government and prime second liens are included in prime non-conforming.
Total assets include $3.8 billion of assets securitized
on-balance sheet and $1.8 billion of assets related to
other balance sheet gross-ups at 9/30/09
($ mil) Pre-Tax Income
$(932)
$(905)
$(1,761)
$(1,949)
$(1,068)
$(1,138)
$(2,044)
$(747)
$(2,500)
$(2,000)
$(1,500)
$(1,000)
$(500)
$-
4Q 07
1Q 08
2Q 08
3Q 08
4Q 08
1Q 09
2Q 09
3Q 09
($ bil) Total Assets
$82
$74
$65
$58
$48
$50
$54
$57
$-
$20
$40
$60
$80
$100
4Q 07
1Q 08
2Q 08
3Q 08
4Q 08
1Q 09
2Q 09
3Q 09
($ bil) Mortgage Loan Production by Type
$20.8
$20.9
$18.1
$11.9
$8.5
$13.4
$18.8
$15.9
$0
$5
$10
$15
$20
4Q 07
1Q 08
2Q 08
3Q 08
4Q 08
1Q 09
2Q 09
3Q 09
Total Originations
Prime Conforming
Prime Non Conforming
Government
Non Prime
Prime Second Lien
Total International
($ bil) Primary Servicing - Period End
$462
$460
$437
$426
$394
$386
$381
$380
$0
$100
$200
$300
$400
$500
$600
4Q 07
1Q 08
2Q 08
3Q 08
4Q 08
1Q 09
2Q 09
3Q 09
Prime Conforming
Prime Non-Conforming
Non Prime
1
15
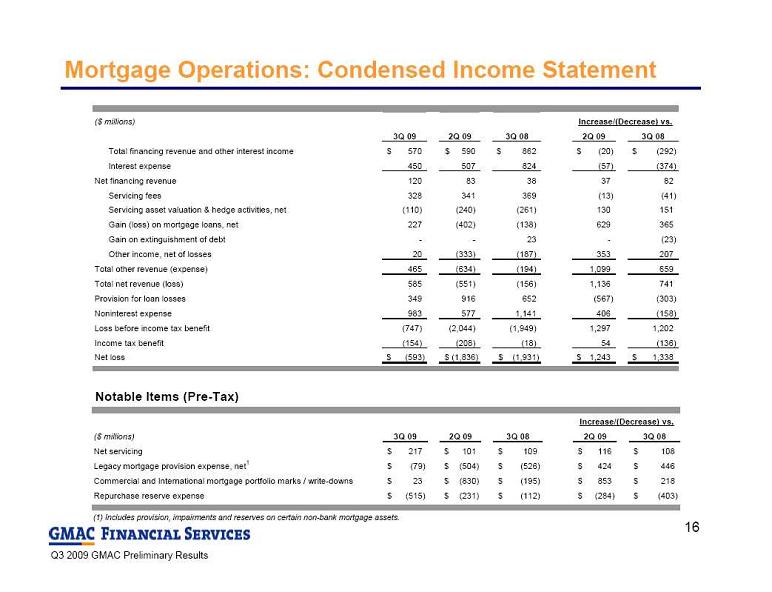 Mortgage Operations: Condensed Income Statement
Notable Items (Pre-Tax)
(1) Includes provision, impairments and reserves on certain non-bank mortgage assets.
($ millions)
3Q 09
2Q 09
3Q 08
2Q 09
3Q 08
Total financing revenue and other interest income
570
$
590
$
862
$
(20)
$
(292)
$
Interest expense
450
507
824
(57)
(374)
Net financing revenue
120
83
38
37
82
Servicing fees
328
341
369
(13)
(41)
Servicing asset valuation & hedge activities, net
(110)
(240)
(261)
130
151
Gain (loss) on mortgage loans, net
227
(402)
(138)
629
365
Gain on extinguishment of debt
-
-
23
-
(23)
Other income, net of losses
20
(333)
(187)
353
207
Total other revenue (expense)
465
(634)
(194)
1,099
659
Total net revenue (loss)
585
(551)
(156)
1,136
741
Provision for loan losses
349
916
652
(567)
(303)
Noninterest expense
983
577
1,141
406
(158)
Loss before income tax benefit
(747)
(2,044)
(1,949)
1,297
1,202
Income tax benefit
(154)
(208)
(18)
54
(136)
Net loss
(593)
$
(1,836)
$
(1,931)
$
1,243
$
1,338
$
Increase/(Decrease) vs.
($ millions)
3Q 09
2Q 09
3Q 08
2Q 09
3Q 08
Net servicing
217
$
101
$
109
$
116
$
108
$
Legacy mortgage provision expense, net
1
(79)
$
(504)
$
(526)
$
424
$
446
$
Commercial and International mortgage portfolio marks / write-downs
23
$
(830)
$
(195)
$
853
$
218
$
Repurchase reserve expense
(515)
$
(231)
$
(112)
$
(284)
$
(403)
$
Increase/(Decrease) vs.
16
Mortgage Operations: Condensed Income Statement
Notable Items (Pre-Tax)
(1) Includes provision, impairments and reserves on certain non-bank mortgage assets.
($ millions)
3Q 09
2Q 09
3Q 08
2Q 09
3Q 08
Total financing revenue and other interest income
570
$
590
$
862
$
(20)
$
(292)
$
Interest expense
450
507
824
(57)
(374)
Net financing revenue
120
83
38
37
82
Servicing fees
328
341
369
(13)
(41)
Servicing asset valuation & hedge activities, net
(110)
(240)
(261)
130
151
Gain (loss) on mortgage loans, net
227
(402)
(138)
629
365
Gain on extinguishment of debt
-
-
23
-
(23)
Other income, net of losses
20
(333)
(187)
353
207
Total other revenue (expense)
465
(634)
(194)
1,099
659
Total net revenue (loss)
585
(551)
(156)
1,136
741
Provision for loan losses
349
916
652
(567)
(303)
Noninterest expense
983
577
1,141
406
(158)
Loss before income tax benefit
(747)
(2,044)
(1,949)
1,297
1,202
Income tax benefit
(154)
(208)
(18)
54
(136)
Net loss
(593)
$
(1,836)
$
(1,931)
$
1,243
$
1,338
$
Increase/(Decrease) vs.
($ millions)
3Q 09
2Q 09
3Q 08
2Q 09
3Q 08
Net servicing
217
$
101
$
109
$
116
$
108
$
Legacy mortgage provision expense, net
1
(79)
$
(504)
$
(526)
$
424
$
446
$
Commercial and International mortgage portfolio marks / write-downs
23
$
(830)
$
(195)
$
853
$
218
$
Repurchase reserve expense
(515)
$
(231)
$
(112)
$
(284)
$
(403)
$
Increase/(Decrease) vs.
16
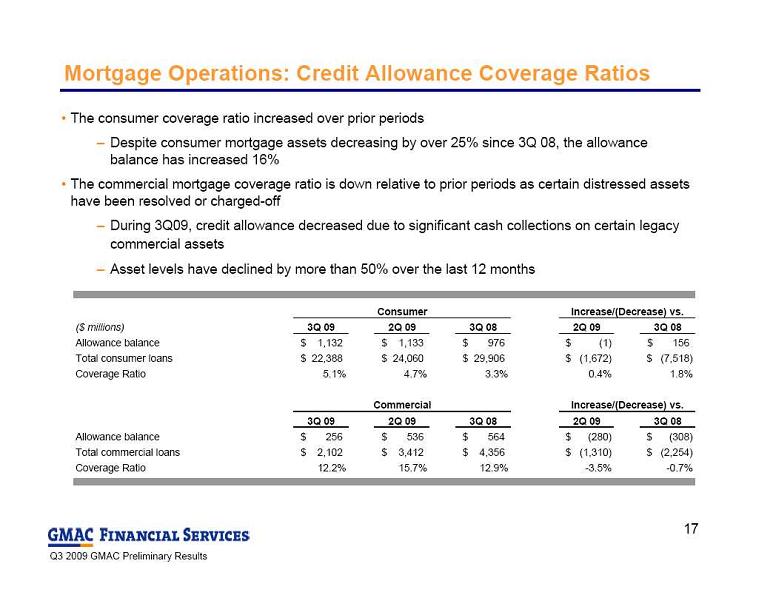 Mortgage Operations: Credit Allowance Coverage Ratios
The consumer coverage ratio increased over prior periods
Despite consumer mortgage assets decreasing by over 25% since 3Q 08, the allowance
Mortgage Operations: Credit Allowance Coverage Ratios
The consumer coverage ratio increased over prior periods
Despite consumer mortgage assets decreasing by over 25% since 3Q 08, the allowance
balance has increased 16%
The commercial mortgage coverage ratio is down relative to prior periods as certain distressed assets
have been resolved or charged-off
During 3Q09, credit allowance decreased due to significant cash collections on certain legacy
commercial assets
Asset levels have declined by more than 50% over the last 12 months
Consumer
($ millions)
3Q 09
2Q 09
3Q 08
2Q 09
3Q 08
Allowance balance
1,132
$
1,133
$
976
$
(1)
$
156
$
Total consumer loans
22,388
$
24,060
$
29,906
$
(1,672)
$
(7,518)
$
Coverage Ratio
5.1%
4.7%
3.3%
0.4%
1.8%
Commercial
3Q 09
2Q 09
3Q 08
2Q 09
3Q 08
Allowance balance
256
$
536
$
564
$
(280)
$
(308)
$
Total commercial loans
2,102
$
3,412
$
4,356
$
(1,310)
$
(2,254)
$
Coverage Ratio
12.2%
15.7%
12.9%
-3.5%
-0.7%
Increase/(Decrease) vs.
Increase/(Decrease) vs.
17
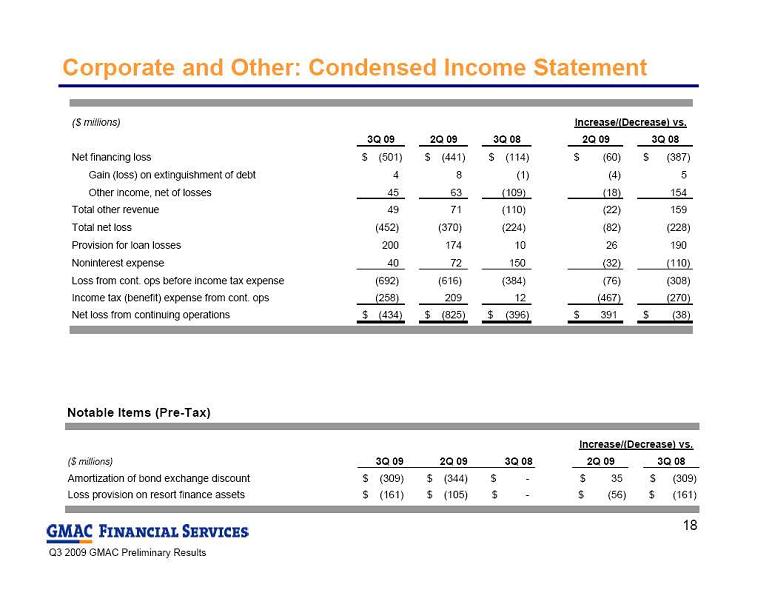 Corporate and Other: Condensed Income Statement
Notable Items (Pre-Tax)
($ millions)
3Q 09
2Q 09
3Q 08
2Q 09
3Q 08
Net financing loss
(501)
$
(441)
$
(114)
$
(60)
$
(387)
$
Gain (loss) on extinguishment of debt
4
8
(1)
(4)
5
Other income, net of losses
45
63
(109)
(18)
154
Total other revenue
49
71
(110)
(22)
159
Total net loss
(452)
(370)
(224)
(82)
(228)
Provision for loan losses
200
174
10
26
190
Noninterest expense
40
72
150
(32)
(110)
Loss from cont. ops before income tax expense
(692)
(616)
(384)
(76)
(308)
Income tax (benefit) expense from cont. ops
(258)
209
12
(467)
(270)
Net loss from continuing operations
(434)
$
(825)
$
(396)
$
391
$
(38)
$
Increase/(Decrease) vs.
($ millions)
3Q 09
2Q 09
3Q 08
2Q 09
3Q 08
Amortization of bond exchange discount
(309)
$
(344)
$
-
$
35
$
(309)
$
Loss provision on resort finance assets
(161)
$
(105)
$
-
$
(56)
$
(161)
$
Increase/(Decrease) vs.
18
Corporate and Other: Condensed Income Statement
Notable Items (Pre-Tax)
($ millions)
3Q 09
2Q 09
3Q 08
2Q 09
3Q 08
Net financing loss
(501)
$
(441)
$
(114)
$
(60)
$
(387)
$
Gain (loss) on extinguishment of debt
4
8
(1)
(4)
5
Other income, net of losses
45
63
(109)
(18)
154
Total other revenue
49
71
(110)
(22)
159
Total net loss
(452)
(370)
(224)
(82)
(228)
Provision for loan losses
200
174
10
26
190
Noninterest expense
40
72
150
(32)
(110)
Loss from cont. ops before income tax expense
(692)
(616)
(384)
(76)
(308)
Income tax (benefit) expense from cont. ops
(258)
209
12
(467)
(270)
Net loss from continuing operations
(434)
$
(825)
$
(396)
$
391
$
(38)
$
Increase/(Decrease) vs.
($ millions)
3Q 09
2Q 09
3Q 08
2Q 09
3Q 08
Amortization of bond exchange discount
(309)
$
(344)
$
-
$
35
$
(309)
$
Loss provision on resort finance assets
(161)
$
(105)
$
-
$
(56)
$
(161)
$
Increase/(Decrease) vs.
18
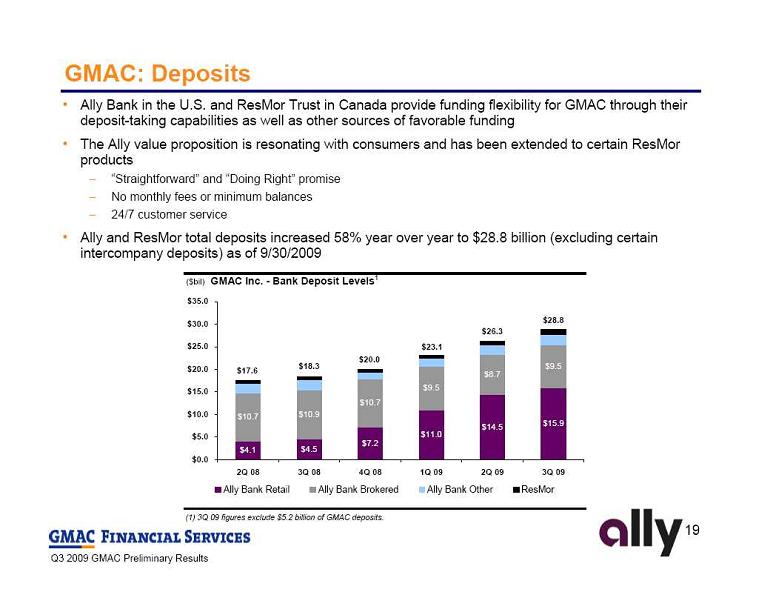 Ally Bank in the U.S. and ResMor Trust in Canada provide funding flexibility for GMAC through their
deposit-taking capabilities as well as other sources of favorable funding
The Ally value proposition is resonating with consumers and has been extended to certain ResMor
products
“Straightforward” and “Doing Right” promise
No monthly fees or minimum balances
24/7 customer service
Ally and ResMor total deposits increased 58% year over year to $28.8 billion (excluding certain
intercompany deposits) as of 9/30/2009
GMAC: Deposits
(1) 3Q 09 figures exclude $5.2 billion of GMAC deposits.
($bil)
GMAC Inc. - Bank Deposit Levels
1
$4.1
$4.5
$7.2
$11.0
$14.5
$15.9
$10.7
$10.9
$10.7
$9.5
$8.7
$9.5
$17.6
$18.3
$20.0
$23.1
$26.3
$28.8
$0.0
$5.0
$10.0
$15.0
$20.0
$25.0
$30.0
$35.0
2Q 08
3Q 08
4Q 08
1Q 09
2Q 09
3Q 09
Ally Bank Retail
Ally Bank Brokered
Ally Bank Other
ResMor
19
 GMAC: Liquidity
Parent company available
GMAC: Liquidity
Parent company available
liquidity stands at $29.7 billion
$9.5 billion of this
liquidity is available
based on current
collateral
$8.3 billion of available
cash liquidity
ABS market conditions
significantly improved
(1) GMAC Consolidated includes Insurance, ResCap, and Ally Bank.
(2) Includes approximately $5.2 billion of overnight funds on deposit at Ally Bank.
(3) ResCap legal entity information. Does not include Ally Bank.
Note: Numbers may not foot due to rounding.
(1) Includes approximately $5.2 billion of overnight funds on deposit at Ally Bank.
(2) Capacity is subject to availability of incremental collateral.
Note: Numbers may not foot due to rounding.
GMAC ex.
GMAC
Ins., ResCap,
Ally
($ billions)
Consolidated
1
Ally Bank
2
Insurance
ResCap LLC
3
Bank
Cash & Cash Equivalents (6/30/09)
$18.7
$9.4
$0.9
$1.2
$7.2
Net Increase (Decrease) in Unsecured Debt
(3.3)
(3.1)
(0.2)
Change in Assets net of On-Balance Sheet securitizations
1.9
3.8
0.1
(2.0)
Change in Intercompany Secured Loans
=
0.6
+
+
(0.6)
+
Net Purchase of Investment Securities
(4.4)
(0.6)
(0.3)
(3.5)
Internal Capital Contributions
(1.5)
1.5
Increase (Decrease) in Deposits
3.2
0.9
2.3
Other
(1.8)
(1.2)
(0.5)
0.4
(0.5)
Cash & Cash Equivalents (9/30/09)
$14.2
$8.3
$0.1
$0.9
$5.0
Net Change in Cash & Cash Equivalents in Q3
($4.4)
($1.1)
($0.8)
($0.3)
($2.2)
Parent Company Available Liquidity to Support Asset Generation
($ billions)
9/30/09
6/30/09
% Change
Cash and Cash Equivalents
1
8.3
$
9.4
$
-12%
Unencumbered Securities
0.1
0.4
-75%
Current Secured Committed Unused Capacity
1.0
5.0
-80%
Current Unsecured Committed Unused Capacity
0.1
0.1
0%
Total Current Available Liquidity
9.5
14.9
-36%
Potential Secured Committed Unused Capacity
2
7.9
7.9
0%
Potential Unsecured Committed Unused Capacity
2
-
-
-
Whole Loan Forward Flow Agreements
2
12.3
13.1
-6%
Total Available Liquidity
29.7
$
35.9
$
-17%
20
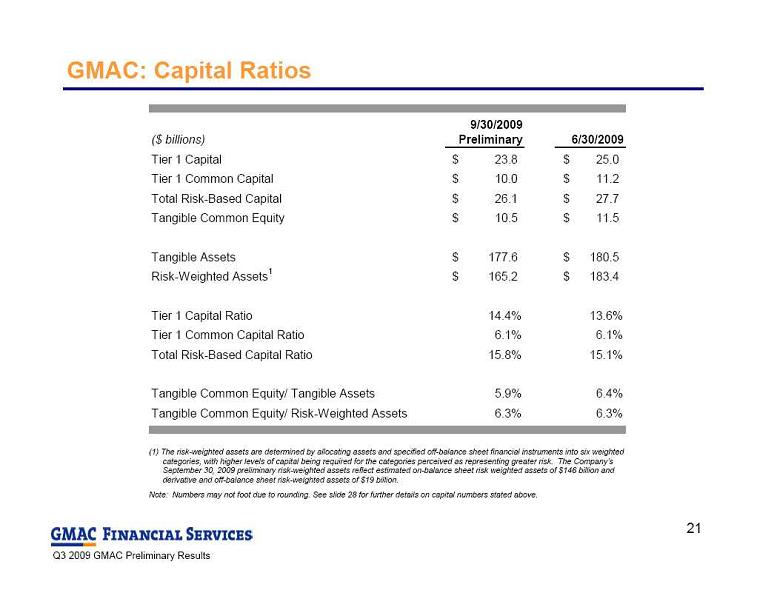 GMAC: Capital Ratios
(1) The risk-weighted assets are determined by allocating assets and specified off-balance sheet financial instruments into six weighted
GMAC: Capital Ratios
(1) The risk-weighted assets are determined by allocating assets and specified off-balance sheet financial instruments into six weighted
categories, with higher levels of capital being required for the categories
perceived as representing greater risk. The Company’s
September 30, 2009 preliminary risk-weighted assets reflect estimated on-balance sheet risk weighted assets of $146 billion and
derivative and off-balance sheet risk-weighted assets
of $19 billion.
Note: Numbers may not foot due to rounding. See slide 28 for further details on capital numbers stated above.
($ billions)
9/30/2009
Preliminary
6/30/2009
Tier 1 Capital
23.8
$
25.0
$
Tier 1 Common Capital
10.0
$
11.2
$
Total Risk-Based Capital
26.1
$
27.7
$
Tangible Common Equity
10.5
$
11.5
$
Tangible Assets
177.6
$
180.5
$
Risk-Weighted Assets
1
165.2
$
183.4
$
Tier 1 Capital Ratio
14.4%
13.6%
Tier 1 Common Capital Ratio
6.1%
6.1%
Total Risk-Based Capital Ratio
15.8%
15.1%
Tangible Common Equity/ Tangible Assets
5.9%
6.4%
Tangible Common Equity/ Risk-Weighted Assets
6.3%
6.3%
21
 GMAC: Conclusion
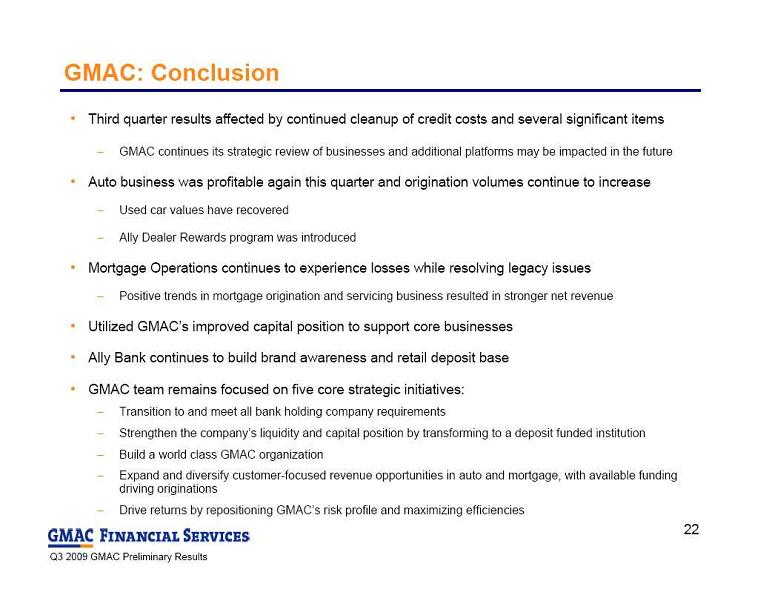
Third quarter results affected by continued cleanup of credit costs and several significant items
GMAC continues its strategic review of businesses and additional platforms may be impacted in the future
Auto business was profitable again this quarter and origination volumes continue to increase
Used car values have recovered
Ally Dealer Rewards program was introduced
Mortgage Operations continues to experience losses while resolving legacy issues
Positive trends in mortgage origination and servicing business resulted in stronger net revenue
Utilized GMAC’s improved capital position to support core businesses
Ally Bank continues to build brand awareness and retail deposit base
GMAC team remains focused on five core strategic initiatives:
Transition to and meet all bank holding company requirements
Strengthen the company’s liquidity and capital position by transforming to a deposit funded institution
Build a world class GMAC organization
Expand and diversify customer-focused revenue opportunities in auto and mortgage, with available funding
GMAC: Conclusion
Third quarter results affected by continued cleanup of credit costs and several significant items
GMAC continues its strategic review of businesses and additional platforms may be impacted in the future
Auto business was profitable again this quarter and origination volumes continue to increase
Used car values have recovered
Ally Dealer Rewards program was introduced
Mortgage Operations continues to experience losses while resolving legacy issues
Positive trends in mortgage origination and servicing business resulted in stronger net revenue
Utilized GMAC’s improved capital position to support core businesses
Ally Bank continues to build brand awareness and retail deposit base
GMAC team remains focused on five core strategic initiatives:
Transition to and meet all bank holding company requirements
Strengthen the company’s liquidity and capital position by transforming to a deposit funded institution
Build a world class GMAC organization
Expand and diversify customer-focused revenue opportunities in auto and mortgage, with available funding
driving originations
Drive returns by repositioning GMAC’s risk profile and maximizing efficiencies
22
 Supplemental Charts
23
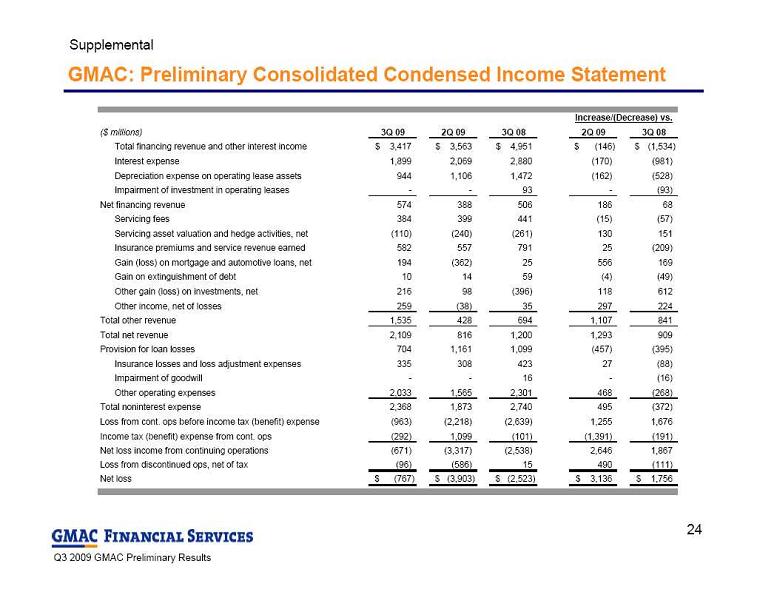 GMAC: Preliminary Consolidated Condensed Income Statement
Supplemental
($ millions)
3Q 09
2Q 09
3Q 08
2Q 09
3Q 08
Total financing revenue and other interest income
3,417
$
3,563
$
4,951
$
(146)
$
(1,534)
$
Interest expense
1,899
2,069
2,880
(170)
(981)
Depreciation expense on operating lease assets
944
1,106
1,472
(162)
(528)
Impairment of investment in operating leases
-
-
93
-
(93)
Net financing revenue
574
388
506
186
68
Servicing fees
384
399
441
(15)
(57)
Servicing asset valuation and hedge activities, net
(110)
(240)
(261)
130
151
Insurance premiums and service revenue earned
582
557
791
25
(209)
Gain (loss) on mortgage and automotive loans, net
194
(362)
25
556
169
Gain on extinguishment of debt
10
14
59
(4)
(49)
Other gain (loss) on investments, net
216
98
(396)
118
612
Other income, net of losses
259
(38)
35
297
224
Total other revenue
1,535
428
694
1,107
841
Total net revenue
2,109
816
1,200
1,293
909
Provision for loan losses
704
1,161
1,099
(457)
(395)
Insurance losses and loss adjustment expenses
335
308
423
27
(88)
Impairment of goodwill
-
-
16
-
(16)
Other operating expenses
2,033
1,565
2,301
468
(268)
Total noninterest expense
2,368
1,873
2,740
495
(372)
Loss from cont. ops before income tax (benefit) expense
(963)
(2,218)
(2,639)
1,255
1,676
Income tax (benefit) expense from cont. ops
(292)
1,099
(101)
(1,391)
(191)
Net loss income from continuing operations
(671)
(3,317)
(2,538)
2,646
1,867
Loss from discontinued ops, net of tax
(96)
(586)
15
490
(111)
Net loss
(767)
$
(3,903)
$
(2,523)
$
3,136
$
1,756
$
Increase/(Decrease) vs.
24
GMAC: Preliminary Consolidated Condensed Income Statement
Supplemental
($ millions)
3Q 09
2Q 09
3Q 08
2Q 09
3Q 08
Total financing revenue and other interest income
3,417
$
3,563
$
4,951
$
(146)
$
(1,534)
$
Interest expense
1,899
2,069
2,880
(170)
(981)
Depreciation expense on operating lease assets
944
1,106
1,472
(162)
(528)
Impairment of investment in operating leases
-
-
93
-
(93)
Net financing revenue
574
388
506
186
68
Servicing fees
384
399
441
(15)
(57)
Servicing asset valuation and hedge activities, net
(110)
(240)
(261)
130
151
Insurance premiums and service revenue earned
582
557
791
25
(209)
Gain (loss) on mortgage and automotive loans, net
194
(362)
25
556
169
Gain on extinguishment of debt
10
14
59
(4)
(49)
Other gain (loss) on investments, net
216
98
(396)
118
612
Other income, net of losses
259
(38)
35
297
224
Total other revenue
1,535
428
694
1,107
841
Total net revenue
2,109
816
1,200
1,293
909
Provision for loan losses
704
1,161
1,099
(457)
(395)
Insurance losses and loss adjustment expenses
335
308
423
27
(88)
Impairment of goodwill
-
-
16
-
(16)
Other operating expenses
2,033
1,565
2,301
468
(268)
Total noninterest expense
2,368
1,873
2,740
495
(372)
Loss from cont. ops before income tax (benefit) expense
(963)
(2,218)
(2,639)
1,255
1,676
Income tax (benefit) expense from cont. ops
(292)
1,099
(101)
(1,391)
(191)
Net loss income from continuing operations
(671)
(3,317)
(2,538)
2,646
1,867
Loss from discontinued ops, net of tax
(96)
(586)
15
490
(111)
Net loss
(767)
$
(3,903)
$
(2,523)
$
3,136
$
1,756
$
Increase/(Decrease) vs.
24
 GMAC: Preliminary Consolidated Condensed Balance Sheet
Supplemental
Increase/
(Decrease) vs.
($ millions)
9/30/09
12/31/08
12/31/08
Cash and cash equivalents
14,225
$
15,151
$
(925)
$
Investment securities
14,376
7,444
6,932
Loans held-for-sale
14,963
7,919
7,044
Finance receivables and loans, net of unearned Income
87,452
100,073
(12,621)
Allowance for loan losses
(2,974)
(3,433)
459
Total finance receivables and loans, net
84,478
96,640
(12,162)
Investment in operating leases, net
18,867
26,390
(7,524)
Other assets
28,906
35,932
(7,026)
Assets of discontinued operations held-for-sale
2,439
-
2,439
Total assets
178,254
$
189,476
$
(11,222)
$
Unsecured debt
45,295
$
53,213
$
(7,918)
$
Secured debt
56,746
73,108
(16,362)
Total debt
102,041
126,321
(24,280)
Deposit liabilities
29,324
19,807
9,517
Other liabilities
20,166
21,494
(1,328)
Liabilities of discontinued operation held-for-sale
1,782
-
1,782
Total liabilities
153,313
167,622
(14,309)
Equity
24,941
21,854
3,087
Total liabilities and equity
178,254
$
189,476
$
(11,222)
$
25
GMAC: Preliminary Consolidated Condensed Balance Sheet
Supplemental
Increase/
(Decrease) vs.
($ millions)
9/30/09
12/31/08
12/31/08
Cash and cash equivalents
14,225
$
15,151
$
(925)
$
Investment securities
14,376
7,444
6,932
Loans held-for-sale
14,963
7,919
7,044
Finance receivables and loans, net of unearned Income
87,452
100,073
(12,621)
Allowance for loan losses
(2,974)
(3,433)
459
Total finance receivables and loans, net
84,478
96,640
(12,162)
Investment in operating leases, net
18,867
26,390
(7,524)
Other assets
28,906
35,932
(7,026)
Assets of discontinued operations held-for-sale
2,439
-
2,439
Total assets
178,254
$
189,476
$
(11,222)
$
Unsecured debt
45,295
$
53,213
$
(7,918)
$
Secured debt
56,746
73,108
(16,362)
Total debt
102,041
126,321
(24,280)
Deposit liabilities
29,324
19,807
9,517
Other liabilities
20,166
21,494
(1,328)
Liabilities of discontinued operation held-for-sale
1,782
-
1,782
Total liabilities
153,313
167,622
(14,309)
Equity
24,941
21,854
3,087
Total liabilities and equity
178,254
$
189,476
$
(11,222)
$
25
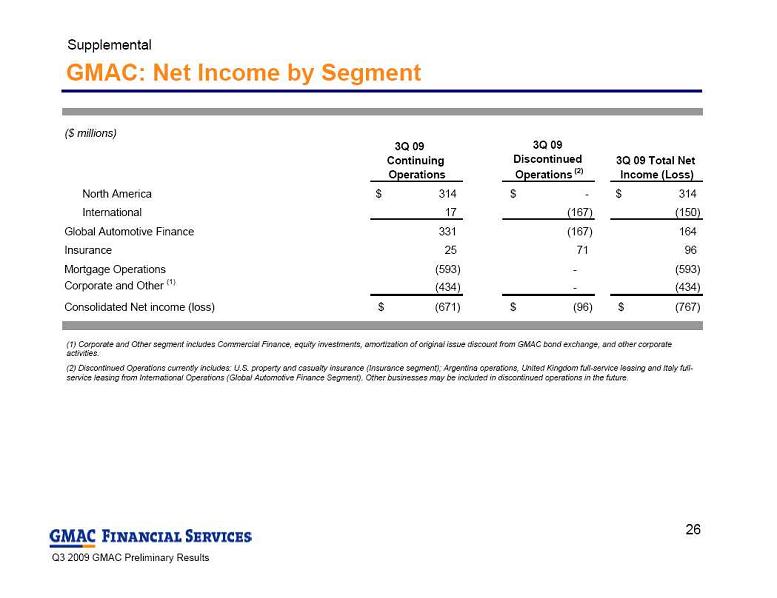 GMAC: Net Income by Segment
Supplemental
(1) Corporate and Other segment includes Commercial Finance, equity investments, amortization of original issue discount from GMAC bond exchange, and other corporate
GMAC: Net Income by Segment
Supplemental
(1) Corporate and Other segment includes Commercial Finance, equity investments, amortization of original issue discount from GMAC bond exchange, and other corporate
activities.
(2) Discontinued Operations currently includes: U.S. property and casualty insurance (Insurance segment); Argentina operations, United Kingdom full-service leasing and Italy full-
service leasing from International
Operations (Global Automotive Finance Segment). Other businesses may be included in discontinued operations in the future.
($ millions)
3Q 09
Continuing
Operations
3Q 09
Discontinued
Operations
(2)
3Q 09 Total Net
Income (Loss)
North America
314
$
-
$
314
$
International
17
(167)
(150)
Global Automotive Finance
331
(167)
164
Insurance
25
71
96
Mortgage Operations
(593)
-
(593)
Corporate and Other
(1)
(434)
-
(434)
Consolidated Net income (loss)
(671)
$
(96)
$
(767)
$
26
 ResCap, LLC: Key Financial Information
(1) For the purpose of ResCap’s tangible net worth covenants, consolidated tangible net worth is defined as the company’s
ResCap, LLC: Key Financial Information
(1) For the purpose of ResCap’s tangible net worth covenants, consolidated tangible net worth is defined as the company’s
consolidated equity, excluding intangible assets and any equity in Ally
Bank to the extent included in ResCap’s consolidated
balance sheet.
Note: Results as they appear on a ResCap, LLC reported basis and include ownership of ResMor Trust through 1/1/2009 and
Ally Bank through 1/30/2009.
Supplemental
ResCap, LLC met its covenants at quarter end with tangible net worth of $409 million at the
end of the third quarter
($ millions)
3Q 09
3Q 08
Net loss
(649)
$
(1,912)
$
Net loss excluding gain on debt extinguishment
(649)
$
(1,954)
$
($ millions)
9/30/2009
12/31/2008
Cash & cash equivalents
919
$
6,983
$
Tangible net worth
409
$
350
$
Total assets
19,749
$
57,961
$
27
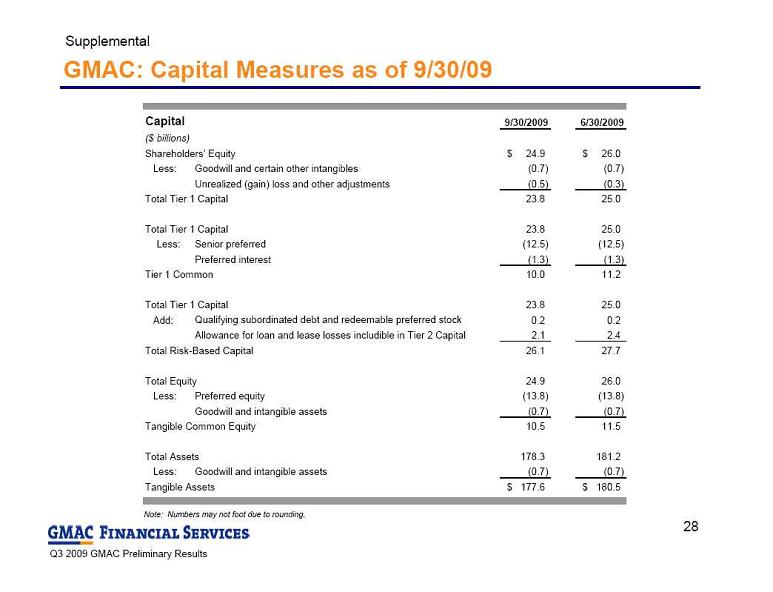 GMAC: Capital Measures as of 9/30/09
Supplemental
Note: Numbers may not foot due to rounding.
Capital
9/30/2009
6/30/2009
Shareholders’ Equity
24.9
$
26.0
$
Less:
Goodwill and certain other intangibles
(0.7)
(0.7)
Unrealized (gain) loss and other adjustments
(0.5)
(0.3)
Total Tier 1 Capital
23.8
25.0
Total Tier 1 Capital
23.8
25.0
Less:
Senior preferred
(12.5)
(12.5)
Preferred interest
(1.3)
(1.3)
Tier 1 Common
10.0
11.2
Total Tier 1 Capital
23.8
25.0
Add:
Qualifying subordinated debt and redeemable preferred stock
0.2
0.2
Allowance for loan and lease losses includible in Tier 2 Capital
2.1
2.4
Total Risk-Based Capital
26.1
27.7
Total Equity
24.9
26.0
Less:
Preferred equity
(13.8)
(13.8)
Goodwill and intangible assets
(0.7)
(0.7)
Tangible Common Equity
10.5
11.5
Total Assets
178.3
181.2
Less:
Goodwill and intangible assets
(0.7)
(0.7)
Tangible Assets
177.6
$
180.5
$
($ billions)
28
GMAC: Capital Measures as of 9/30/09
Supplemental
Note: Numbers may not foot due to rounding.
Capital
9/30/2009
6/30/2009
Shareholders’ Equity
24.9
$
26.0
$
Less:
Goodwill and certain other intangibles
(0.7)
(0.7)
Unrealized (gain) loss and other adjustments
(0.5)
(0.3)
Total Tier 1 Capital
23.8
25.0
Total Tier 1 Capital
23.8
25.0
Less:
Senior preferred
(12.5)
(12.5)
Preferred interest
(1.3)
(1.3)
Tier 1 Common
10.0
11.2
Total Tier 1 Capital
23.8
25.0
Add:
Qualifying subordinated debt and redeemable preferred stock
0.2
0.2
Allowance for loan and lease losses includible in Tier 2 Capital
2.1
2.4
Total Risk-Based Capital
26.1
27.7
Total Equity
24.9
26.0
Less:
Preferred equity
(13.8)
(13.8)
Goodwill and intangible assets
(0.7)
(0.7)
Tangible Common Equity
10.5
11.5
Total Assets
178.3
181.2
Less:
Goodwill and intangible assets
(0.7)
(0.7)
Tangible Assets
177.6
$
180.5
$
($ billions)
28
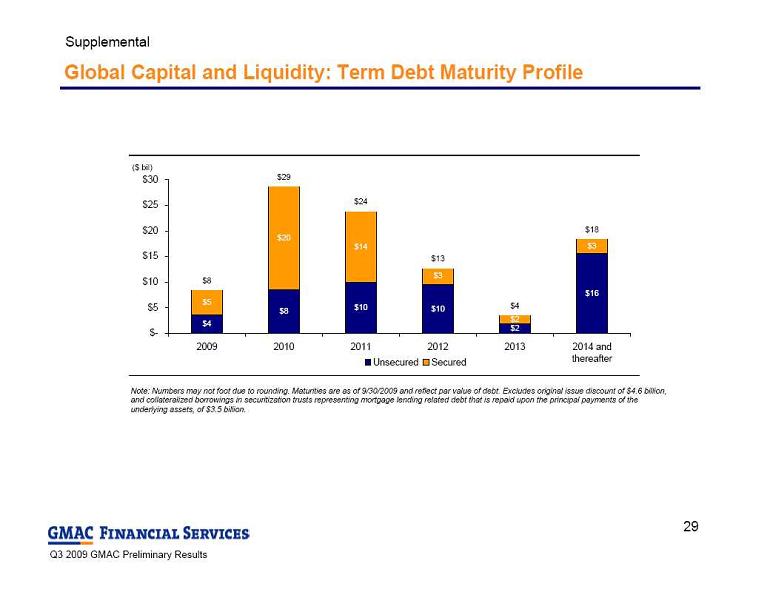 Global Capital and Liquidity: Term Debt Maturity Profile
Supplemental
Note: Numbers may not foot due to rounding. Maturities are as of 9/30/2009 and reflect par value of debt. Excludes original issue discount of $4.6 billion,
Global Capital and Liquidity: Term Debt Maturity Profile
Supplemental
Note: Numbers may not foot due to rounding. Maturities are as of 9/30/2009 and reflect par value of debt. Excludes original issue discount of $4.6 billion,
and collateralized borrowings in securitization
trusts representing mortgage lending related debt that is repaid upon the principal payments of the
underlying assets, of $3.5 billion.
($ bil)
$4
$8
$10
$10
$2
$16
$5
$20
$14
$3
$2
$3
$8
$29
$24
$13
$4
$18
$-
$5
$10
$15
$20
$25
$30
2009
2010
2011
2012
2013
2014 and
thereafter
Unsecured
Secured
Total
29
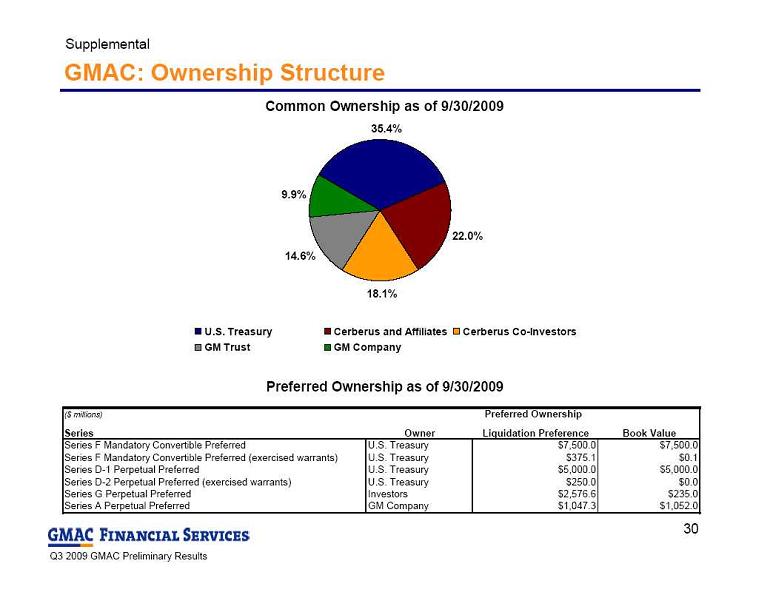 GMAC: Ownership Structure
Supplemental
Preferred Ownership as of 9/30/2009
Common Ownership as of 9/30/2009
35.4%
22.0%
18.1%
14.6%
9.9%
U.S. Treasury
Cerberus and Affiliates
Cerberus Co-Investors
GM Trust
GM Company
($ millions)
Series
Owner
Liquidation Preference
Book Value
Series F Mandatory Convertible Preferred
U.S. Treasury
$7,500.0
$7,500.0
Series F Mandatory Convertible Preferred (exercised warrants)
U.S. Treasury
$375.1
$0.1
Series D-1 Perpetual Preferred
U.S. Treasury
$5,000.0
$5,000.0
Series D-2 Perpetual Preferred (exercised warrants)
U.S. Treasury
$250.0
$0.0
Series G Perpetual Preferred
Investors
$2,576.6
$235.0
Series A Perpetual Preferred
GM Company
$1,047.3
$1,052.0
Preferred Ownership
30
GMAC: Ownership Structure
Supplemental
Preferred Ownership as of 9/30/2009
Common Ownership as of 9/30/2009
35.4%
22.0%
18.1%
14.6%
9.9%
U.S. Treasury
Cerberus and Affiliates
Cerberus Co-Investors
GM Trust
GM Company
($ millions)
Series
Owner
Liquidation Preference
Book Value
Series F Mandatory Convertible Preferred
U.S. Treasury
$7,500.0
$7,500.0
Series F Mandatory Convertible Preferred (exercised warrants)
U.S. Treasury
$375.1
$0.1
Series D-1 Perpetual Preferred
U.S. Treasury
$5,000.0
$5,000.0
Series D-2 Perpetual Preferred (exercised warrants)
U.S. Treasury
$250.0
$0.0
Series G Perpetual Preferred
Investors
$2,576.6
$235.0
Series A Perpetual Preferred
GM Company
$1,047.3
$1,052.0
Preferred Ownership
30