Attached files
| file | filename |
|---|---|
| 8-K - FORM 8-K - Argo Group International Holdings, Ltd. | d8k.htm |
 Investor Presentation November 2009 Exhibit 99.1 |
 2. Forward-Looking Statements This presentation contains “forward-looking statements” which are made pursuant to the
safe harbor provisions of the Private Securities Litigation Reform Act of 1995. The
forward-looking statements are based on the Company's current expectations and beliefs
concerning future developments and their potential effects on the Company. There can be no
assurance that actual developments will be those anticipated by the Company. Actual results may
differ materially from those projected as a result of significant risks and uncertainties,
including non-receipt of the expected payments, changes in interest rates, effect of the
performance of financial markets on investment income and fair values of investments,
development of claims and the effect on loss reserves, accuracy in projecting loss reserves, the
impact of competition and pricing environments, changes in the demand for the Company's
products, the effect of general economic conditions, adverse state and federal legislation,
regulations and regulatory investigations into industry practices, developments relating
to existing agreements, heightened competition, changes in pricing environments, and
changes in asset valuations. The Company undertakes no obligation to publicly update any
forward-looking statements as a result of events or developments subsequent to the
presentation. |
 3. The Argo Group Story The Company Argo Group is an international specialty underwriter of property/casualty insurance and reinsurance focused in niche markets. The Objective To maintain our profitable growth record while maximizing on the opportunities afforded us through our international platform. The Strategy Apply our proven business model to deploy capital in attractive niche markets that offer opportunities for maximum return.
|
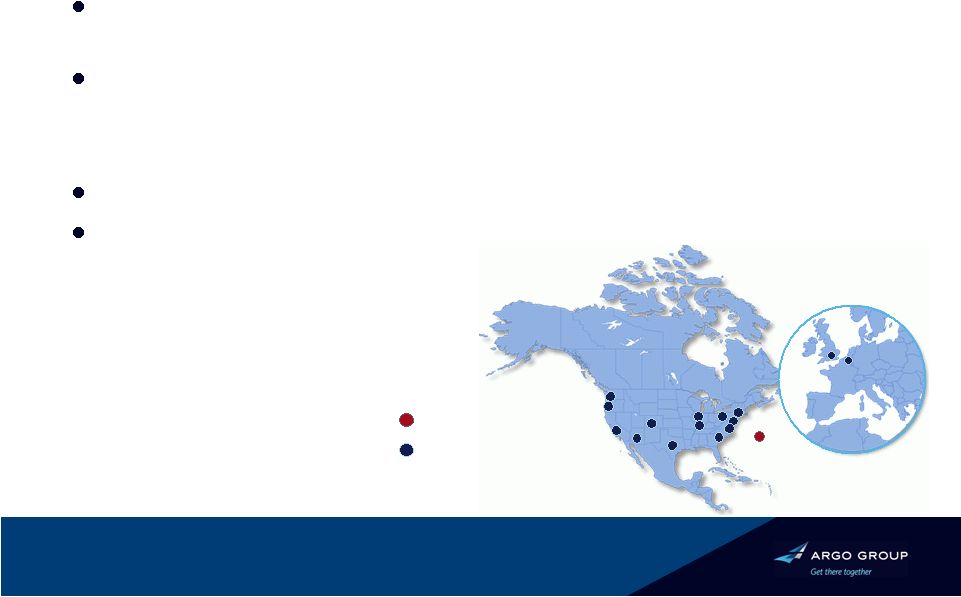 4. Argo Group Today Specialty underwriter in attractive niche areas of P&C insurance and reinsurance markets Headquarters: Bermuda – Operate in 50 states and internationally – View the specialty market as a single marketplace Total capitalization of $2.0 billion Four ongoing business segments – Excess and Surplus Lines (U.S.) – Commercial Specialty (U.S.) – Reinsurance – International Specialty Major business segment locations Headquarters Brussels London Bermuda |
 5. Strategic Business Plan Focus: Specialty underwriter in niche markets Growing an International Specialty Underwriter Growth and Profitability |
 6. A Recap of Our Successful Strategic Business Plan 1. Target attractive niche markets 2. Develop leading, differentiated positions 3. Expand position – organically – geographically – selective acquisitions 4. Results: growth in premiums, earnings and book value |
 7. 1. ATTRACTIVE NICHE MARKETS A Different Type of Approach Higher margin and return Market leadership in a reasonable time frame Disciplined underwriting Sustained, profitable organic growth Key Criteria In Selecting Niche Markets |
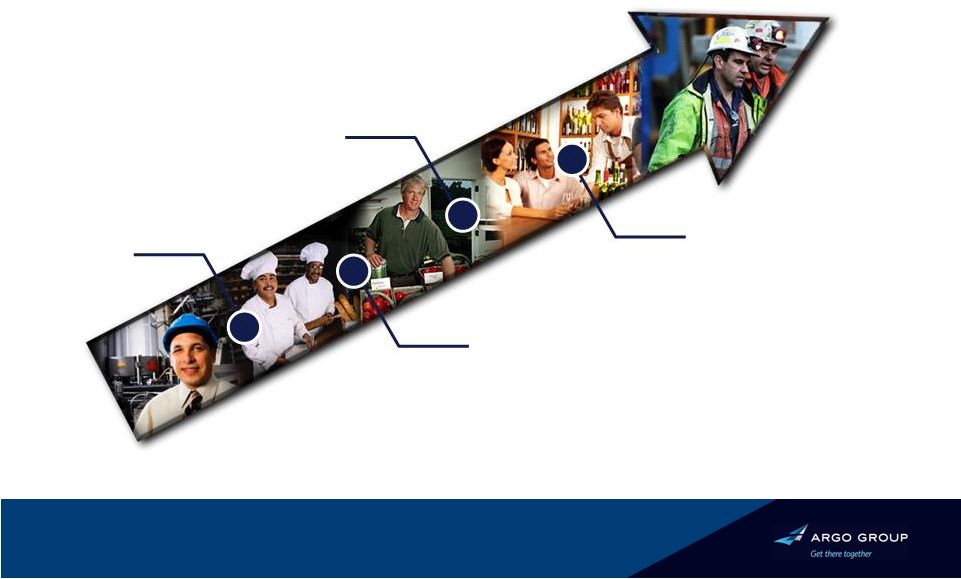
 8. Leader Lloyd’s direct and facultative market Leader E&S market top-tier Leader Commercial insurance for small / medium public entities Leader Insurance for the retail dry cleaning industry Leader Workers’ compensation for coal mines in Pennsylvania and Maryland Leader P/C insurance for independent grocery stores 2. DEVELOP LEADERSHIP POSITIONS Examples of Leadership Positions |
 9. 3. EXPAND POSITION Initiatives Supplementing Organic Growth Revenues Since 2000, accounts for over 90% of total growth Since 2000, accounts for over 90% of total growth Business Development Activity Since 2000 Synergies Gained Cross Selling Increased Product Offerings Interstate Coregis Assets acquired: Grocers Fulcrum Businesses acquired: Massamont Rockwood Heritage PXRE Colony Insight New businesses launched: Argonaut Financial Argo Surety Argo Pro Argo Re Excess Casualty Argo Specialty Trident |
 10. $125M $1.1B 2000 2008 Earned Premiums $1.6B $186M 2000 2008 Gross Written Premiums 31% CAGR 32% CAGR 4. RESULTS: GROWTH An Impressive Growth Record… |
 11. $62M $150M 2000 2008 12% CAGR $3M $63M 2001 2008 Net Income Net Investment Income 46% CAGR 4. RESULTS: GROWTH Improved Bottom Line Results… |
 12. $51.04 $44.18 $45.15 $23.40 $27.22 $30.36 $33.52 $39.08 2002 2003 2004 2005 2006 2007 2008 2009-Q3 4. RESULTS: GROWTH …and Consistent Growth of Book Value BVPS Growth Since 2002 12.2% CAGR * Book value per common share - outstanding, includes the impact of the Series A Mandatory Convertible
Preferred Stock on an as if converted basis. Preferred stock had fully converted into
common shares as of Dec. 31, 2007. |
 13. Growing an International Specialty Underwriter Growth and Profitability Focus: Specialty underwriter in niche markets Four Business Units |
 14. Excess & Surplus Lines International Specialty* • 2008 GWP $283M* • Lloyd’s platform • 2008 GWP $684M Excess & Surplus Lines Reinsurance • 2008 GWP $126M • Bermuda platform Commercial Specialty • 2008 GWP $511M Four Growth Platforms *June 1 – Dec 31 only |
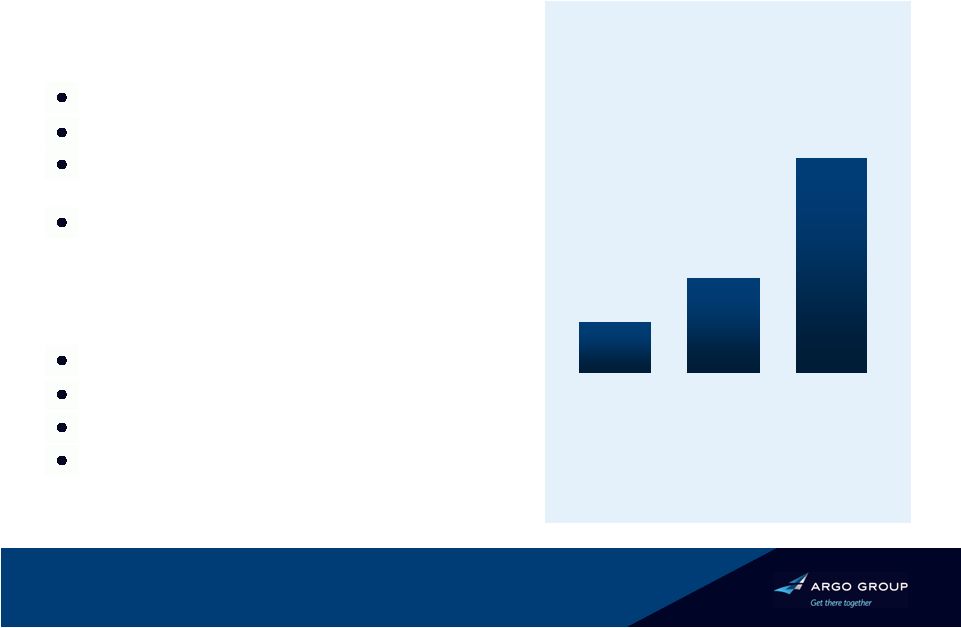
 15. EXCESS & SURPLUS LINES: Largest and Most Profitable Segment Status Combined ratio in low 90% range Colony, Argonaut Specialty & Argo Pro Competitive advantages Excellent infrastructure – broad geography Underwriting expertise Broad product portfolio for small acct U/Ws Controlled distribution – Wholesale agents Benefits from a category XII ‘A’ (Excellent) rating by A.M. Best Pre-Tax Operating Income ($M) 92.6% 88.9% 89.3% Combined ratio * Includes $12.7M of losses from 2008 hurricanes. $58 $102 $113 2005 2006 2007 $98 2008* 93.3% 2009 Nine Months: $63.6M 2008 Nine Months: $66.6M |
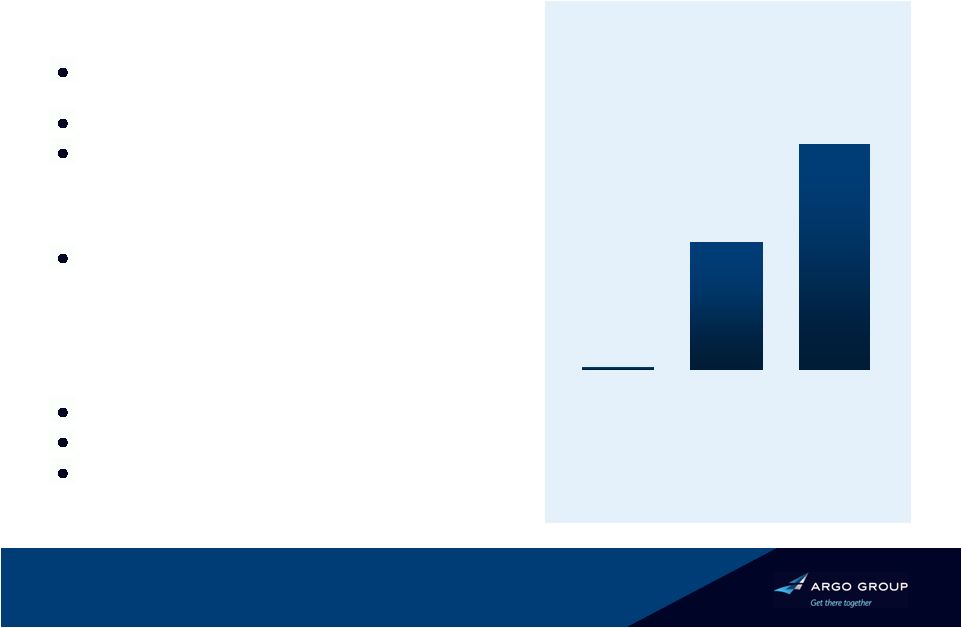
 16. COMMERCIAL SPECIALITY: Fastest Growing Segment Status 2008 GWP up 21% Primarily admitted, retail-driven Competitive advantages Expertise in niche markets – grocery stores – mining operations – laundry & dry cleaners – small/medium-size public entities – religious institutions Benefits from a category XII ‘A’ (Excellent) rating by A.M. Best Pre-Tax Operating Income ($M) Combined ratio * Includes $2.8M of losses from 2008 hurricanes. 92.6% 89.4% 88.7% $38 $50 $61 2005 2006 2007 $43 2008* 96.5% 2009 Nine Months: $34.5M 2008 Nine Months: $25.3M |
 17. Nine Months Ended Sept. 30, 2009 ($M) Combined ratio 55.5% $34 $63 $143 Operating Income Earned Premium Gross Written Premium Status Began 2008 with ~ $1.3B in capital Produced solid year one results Reported favorable development related to Hurricane Ike Added Casualty and Professional Risks; appointed Nigel Mortimer to lead Competitive advantages Utilized established infrastructure Built diversified book of business Proven record of leadership Benefits from a category XII ‘A’ (Excellent) rating by A.M. Best REINSURANCE: Argo Re – Performing Well |
 18. Status Acquired Heritage in 2008; rebranded to Argo International Enoizi to CEO; Carrier to U/W director Worldwide property – Direct and Facultative – North American and International Binding Authority Non-U.S. liability – Professional indemnity – General liability Competitive advantages Specialist knowledge Access to decision makers Carries the Lloyd’s market ratings of ‘A’ (Excellent) rating by A.M. Best, and ‘A+’ by S&P INTERNATIONAL SPECIALTY: Argo International (Lloyd’s) Nine Months Ended Sept. 30, 2009 ($M) Combined ratio 97.8% $8.1 $321 $563 Operating Income Earned Premium |
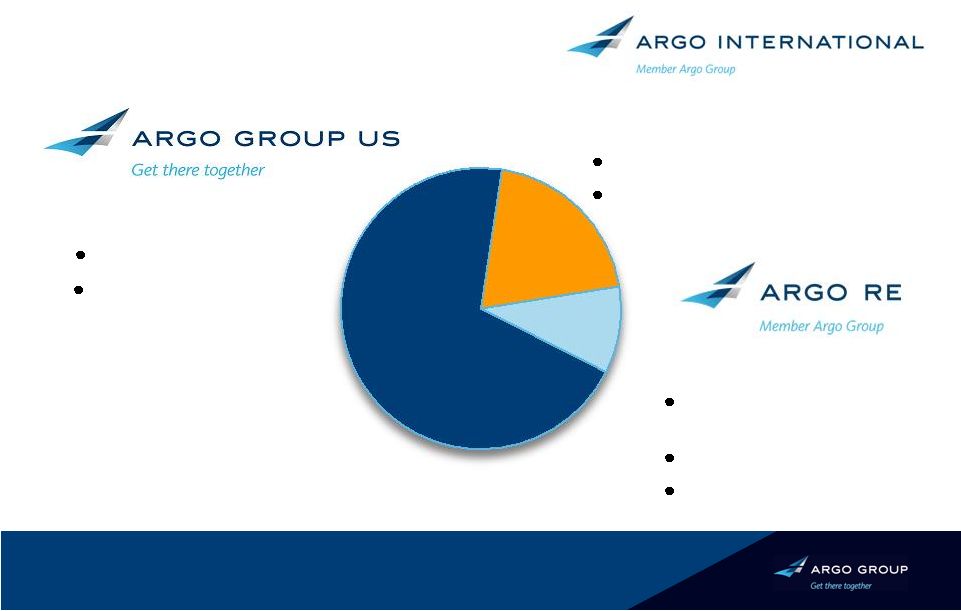 19. Combined Business Mix Unique platform to prudently write business worldwide and penetrate niche markets Specialty Insurance Excess & Surplus Lines Commercial Specialty Reinsurance Quota share reinsurance of business partners Property reinsurance Prospective insurance opportunities ~70% ~10% ~20% International Specialty (Lloyd’s) Worldwide property Non-U.S. liability 19. |
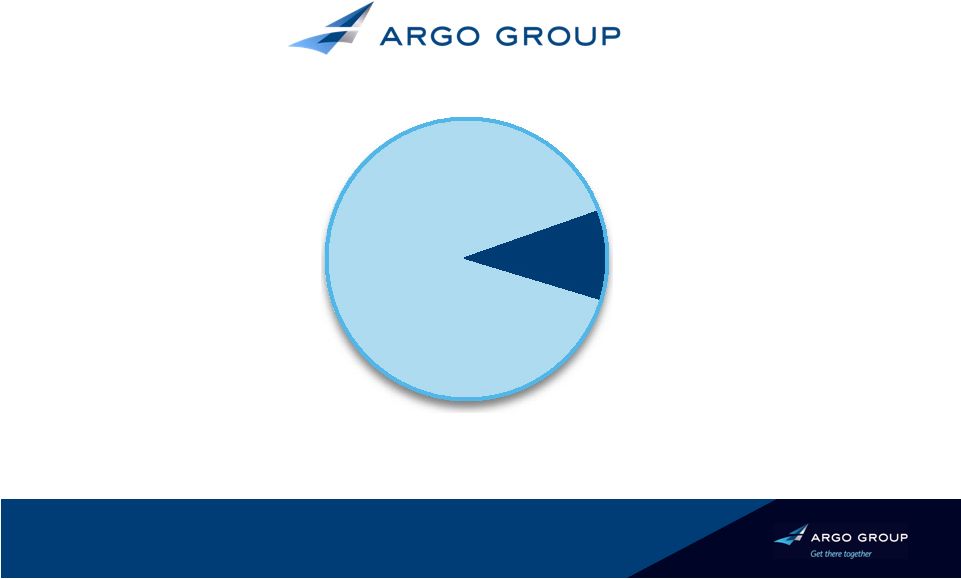 20. Insurance / Reinsurance Business Mix Reinsurance Insurance YTD as of Sept. 30, 2009 Note: Based on gross written premiums (GWP) 91% 9% |
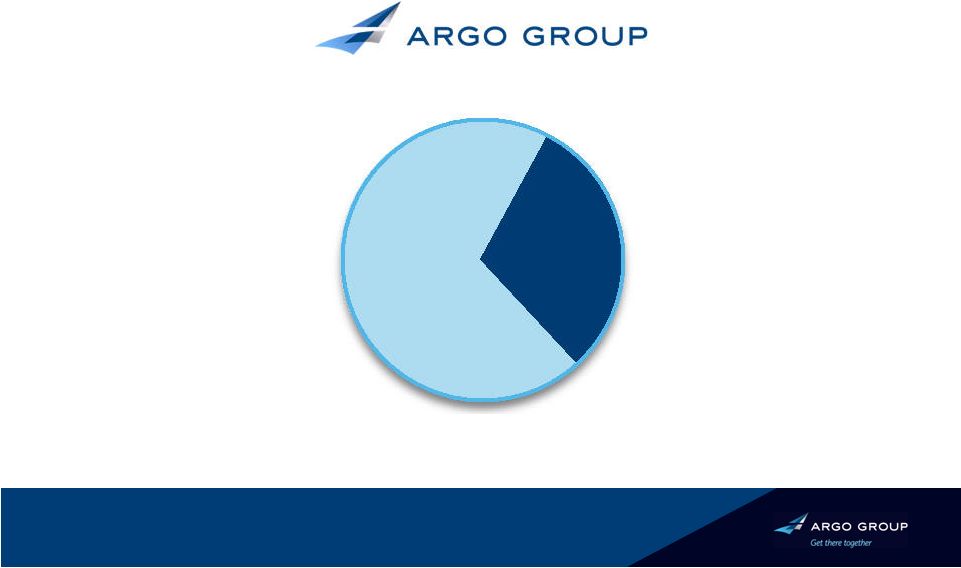 21. Property / Casualty Business Mix Property Casualty ~70% ~30% |
 22. Argo Group 2008 Financial Highlights 2007 2008 Change Gross Written Premium $ 1.18B $ 1.60B 36% Net Earned Premium $ 860M $ 1.13B 31% Total Revenue $ 1.0B $ 1.25B 25% Net Investment Income $ 134M $ 150M 12% Net Income Per Share $ 5.58 $ 2.05** 172%** ** Impacted by $17.4mm of pre-tax losses from U.S. storms in Q2 and $74.0mm from
hurricanes Gustav and Ike in Q3. |
 23. Argo Group 2009 Third Quarter Results 2008 Nine Months 2009 Nine Months Change Gross Written Premium $ 1.2B $ 1.6B 29% Net Earned Premium $ 803M $ 1.1B 32% Total Revenue $ 909M $ 1.2B 28% Net Investment Income $ 113M $ 113M 0% Net Income Per Share $ 1.66 $ 2.48 49% |
 24. Strong Balance Sheet and Capital Base In millions except for book value and leverage data Dec 31, 2008 2,997 24.1% 1,782 1,353 6,382 $4,001 429 $44.18 Dec 31, 2007 2,425 21.0% 1,754 1,385 5,124 $3,598 369 $45.15 Reserves Total Leverage Total Capital Shareholders’ Equity Total Assets Investment Portfolio Indebtedness Book Value Per Share Sep 30, 2009 3,187 19.5% 1,954 1,573 6,821 $4,317 381 $51.04 |
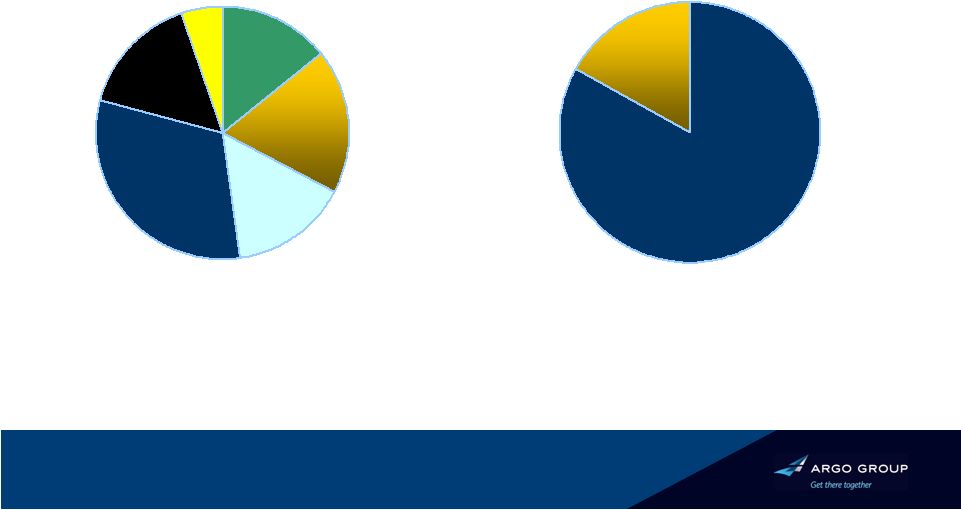 25. Conservative Investment Portfolio Fixed income (94%) Equities (6%) Total: $4.0bn Total: $0.3bn • Average Rating of AA+ • Duration of 3.0 years • Internally and externally managed • Conservative focus on large cap 32% 14% 19% 15% 15% U.S. Government State / Muni Corporate Structured Short Term Other 5% Financials Industrial & Other 17% 83% |
 26. Focus Areas for the Coming Year • Investments in people • Investment in IT • Expense savings • Controlled expansion in the US and London • Focus on clients • Focus on distribution partners • Focus on the competitive environment Internal External Premiums / Risk Selection Levers to Drive a Profitable Organization Investment Leverage / Yields Financial Leverage / Capital Structure Infrastructure Cost |
 27. Capital Deployment Strategy Support balance sheet, mainly loss reserves Growth of core business – Deploy capital opportunistically across all four segments – Reduce reliance on third-party reinsurance Pursue attractive market opportunities – Selective acquisitions that complement existing business lines – Books of business and companies Repatriate capital depending on capital position and stock price – $150M stock repurchase program authorized should above opportunities fail to appear – Dividend |
 28. I N S U M M A R Y A Strong and Well-Positioned Specialty Underwriter Proven and successful strategic business plan – Strong growth record – Improved profitability in continuing lines – Capital management – Expanded, proven leadership team Powerful competitive force in specialty lines market – Flexible international platform – U.S., Bermuda and London advantages – Diversified business mix – Growth though geographic and product diversification Focus on profitable growth – Effective capital deployment + high-margin focus = ROE improvement – Consistent increase in book value per share over time |
 Thank you! |