Attached files
| file | filename |
|---|---|
| 8-K - FORM 8-K - AMEDISYS INC | d8k.htm |
| EX-99.2 - RECONCILIATIONS OF NON-GAAP FINANCIAL MEASURES TO GAAP FINANCIAL MEASURES - AMEDISYS INC | dex992.htm |
 November
2009 www.amedisys.com NASDAQ: AMED Exhibit 99.1 |
 1 Forward-Looking Statements This presentation may include forward-looking statements as defined by the Private Securities Litigation Reform Act of 1995. These forward-looking statements are based upon current expectations and assumptions about our business that are subject to a variety of risks and uncertainties that could cause actual results to differ materially from those described in this presentation. You should not rely on forward-looking statements as a prediction of future events. Additional information regarding factors that could cause actual results to differ materially from those discussed in any forward-looking statements are described in reports and registration statements we file with the SEC, including our Annual Report on Form 10-K and subsequent Quarterly Reports on Form 10-Q and Current Reports on Form 8-K, copies of which are available on the Amedisys internet website http://www.amedisys.com or by contacting the Amedisys Investor Relations department at (800) 467-2662. We disclaim any obligation to update any forward-looking statements or any changes in events, conditions or circumstances upon which any forward-looking statement may be based except as required by law. |
 2 Important Website Information We encourage everyone to visit the Investors Section of our website at www.amedisys.com, where we have posted additional important information such as press releases, profiles concerning our business and clinical operations and control processes, and SEC filings. We intend to use our website to expedite public access to time-critical information regarding the Company in advance of or in lieu of distributing a press release or a filing with the SEC disclosing the same information. |
 3 Our Strategy Clinical Excellence Focus on outcomes Develop and deploy specialized programs for chronic diseases and conditions Expand care coordination platform Growth Focus on chronic co-morbid patients Large, growing and highly fragmented market Internal growth/start-ups Acquisitions Efficiency Proven operating model supported by sophisticated technology system Leverage cost-efficient platform Experienced management team |
 4 William F. Borne Chairman and Chief Executive Officer CEO since founding the Company in 1982 Dale E. Redman, CPA Chief Financial Officer Joined Amedisys in February 2007 Jeffrey Jeter Chief Compliance Officer Joined Amedisys in 2001 Michael O. Fleming, MD Chief Medical Officer Joined Amedisys in 2009 Management Team |
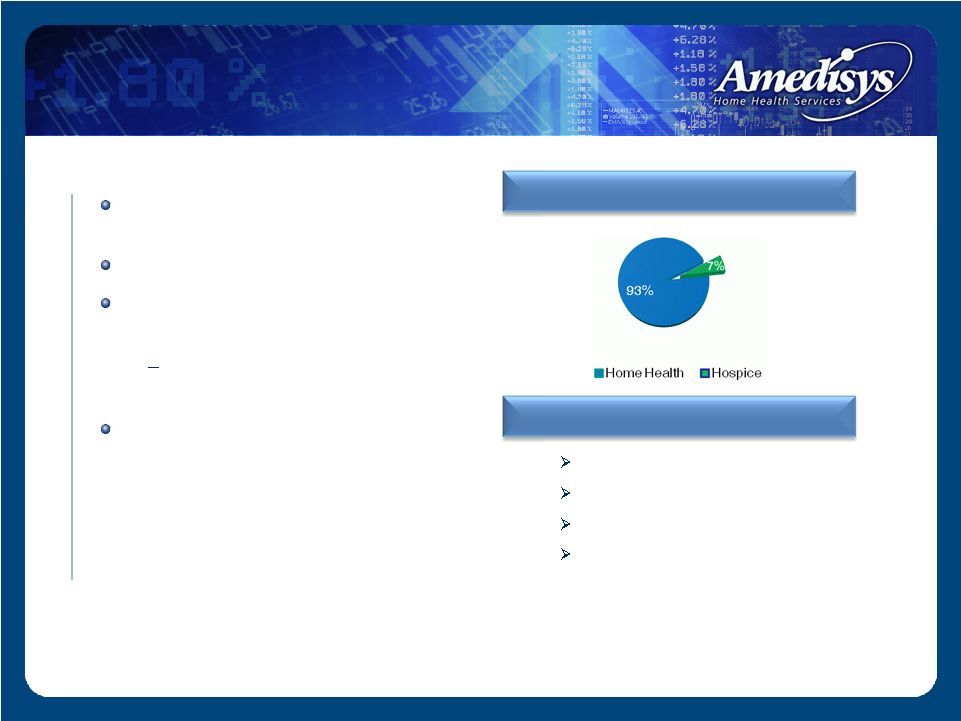 5 2 Corporate Overview Founded in 1982, publicly listed 1994 569 locations in 38 states Leading provider of home health services Services include skilled nursing and therapy services 95% of Home Health revenue is episodic based (both Medicare & non-Medicare) 1 For the quarter ended September 30, 2009 2 Provided as of the date of our Form 8-K filed with the Securities and Exchange Commission on
July 28, 2009, reaffirmed in 8-K dated October 27, 2009. . Stats 16,100 employees Daily visits = 23,500 8,600,000 visits projected in 2009 2009 revenue guidance = $1.5 billion Revenue Mix 1 |
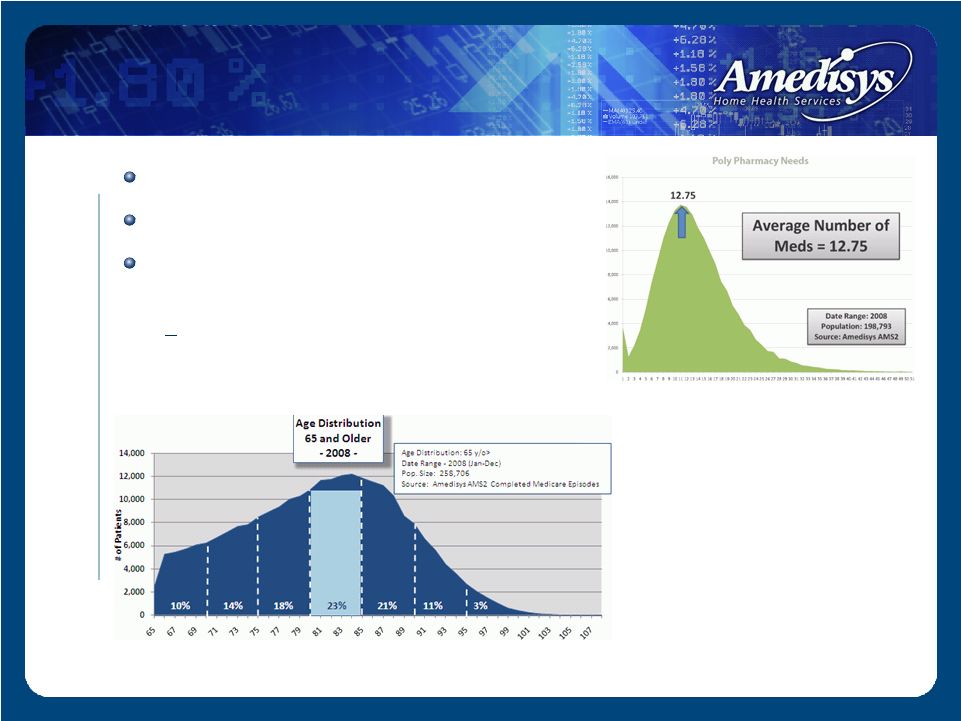 6 Patient Overview Average patient is 82 years old Higher acuity patient Patient is taking an average of 13 medications 15 medications for greater than two episodes |
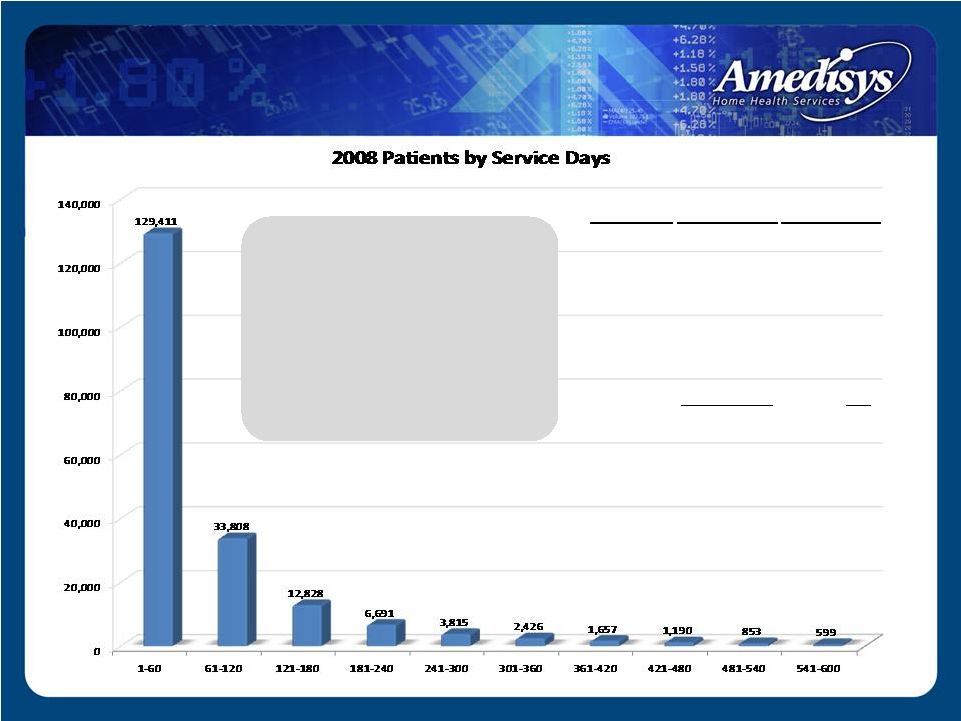 • 85% receive care/ discharged within 2 episodes • 10% received care within 4 episodes • 5% - Chronic Subset Days Patients Percentage 1-60 129,411 66.96% 61-120 33,808 17.49% 121-180 12,828 6.64% 181-240 6,691 3.46% 241-300 3,815 1.97% 301-360 2,426 1.25% 361-420 1,657 0.86% 421-480 1,190 0.62% 481-540 853 0.44% 541-600 599 0.31% Total 193,278 100.00% Patient Length of Stay 7 |
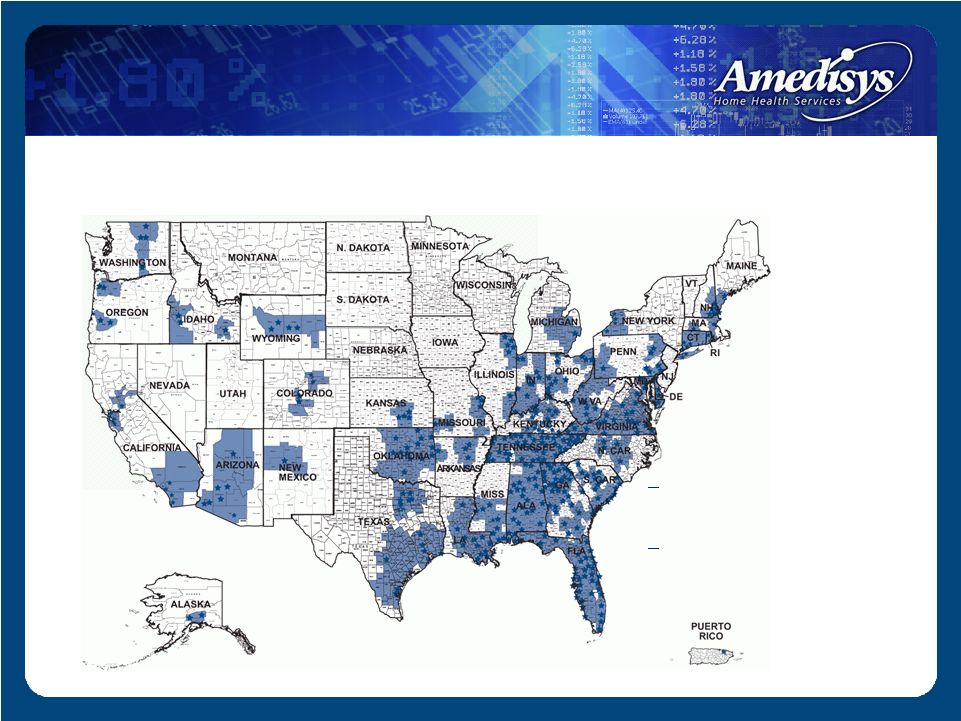 8 Our Locations National home nursing provider located in 38 states, the District of Columbia and Puerto Rico. Largest provider in the Southern and Southeastern United States. 508 home nursing locations* 61 hospice locations* *As of September 30, 2009 |
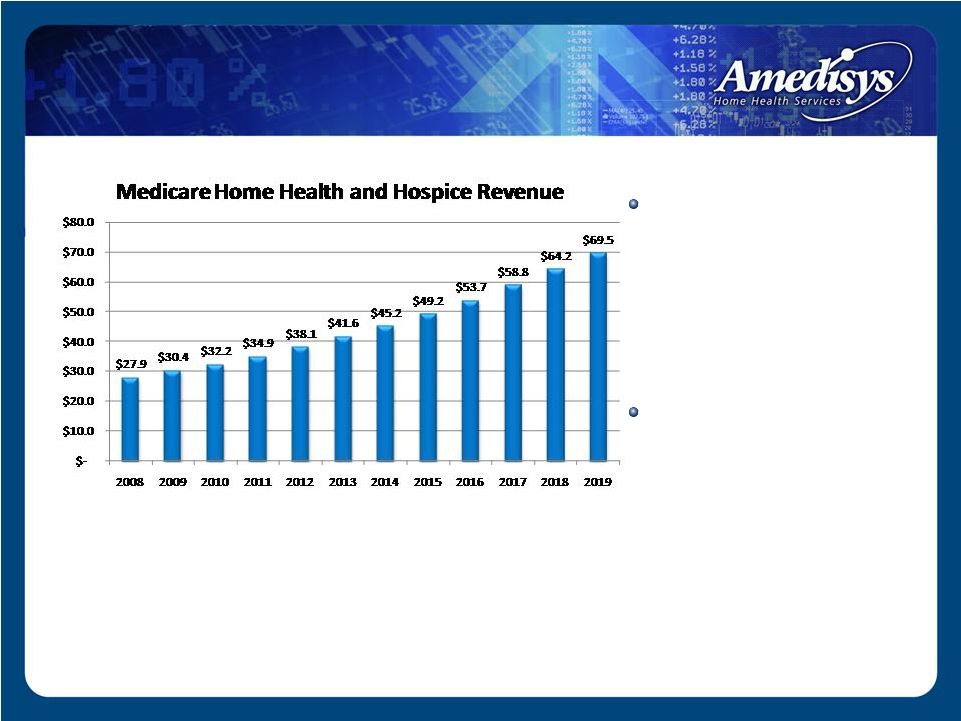 9 Source: CBO's March 2009 Baseline: MEDICARE Medicare Revenue Market Size 2008: Medicare spending for home health reached $16.5 billion and hospice was $11.4 billion, giving a combined total of $27.9 billion 2019: Home health will contribute $47.9 billion and hospice $21.6 billion of the projected $69.5 billion $ in billions |
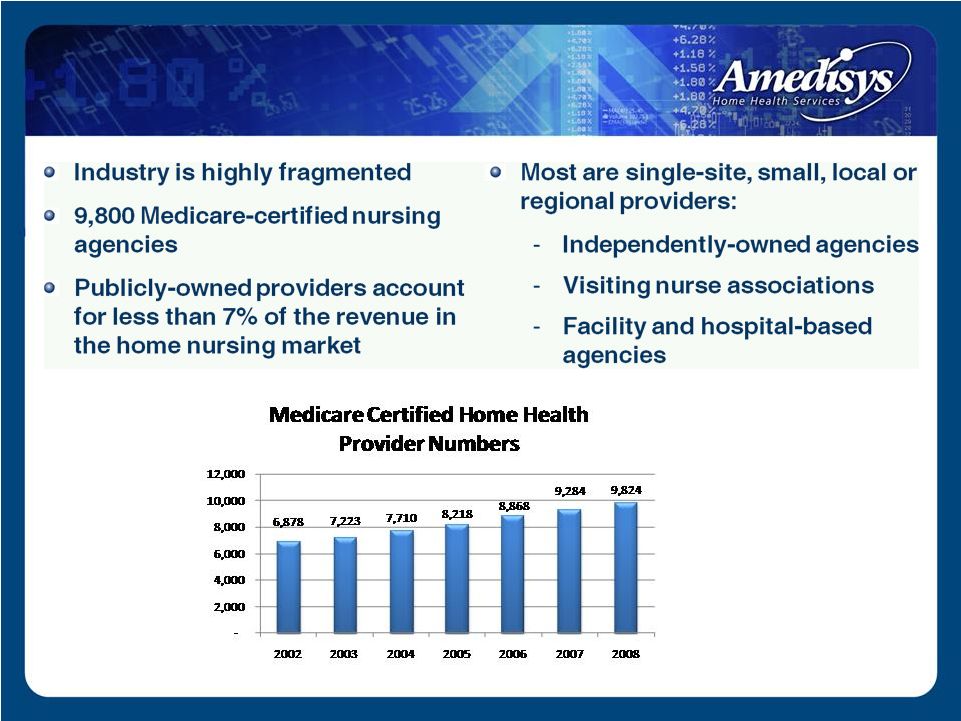 Home Nursing
Market Source: CMS Oscar data books and Medpac reports 10 |
 11
1 Industry Growth Drivers Trend from inpatient to home-based care: Patient preference Payor incentives Technology advancements Demographics – aging population 8,000 Americans will become Medicare eligible each day beginning in 2011 and by 2030, 57.8 million baby boomers will be eligible for Medicare benefits Increased prevalence of chronic and co-morbid conditions 1 Source: United States Census Bureau |
 12
Internal Growth Internal revenue growth of 18% for Q3 2009 Internal growth driven by: Overall industry growth Increase in episodic-based admissions • Focus on start-ups Increase in episodic-based recertifications • Higher acuity levels and co-morbidities, requiring more intensive services Increase in episodic-based revenue per episode • Continued deployment of therapy intensive specialty programs |
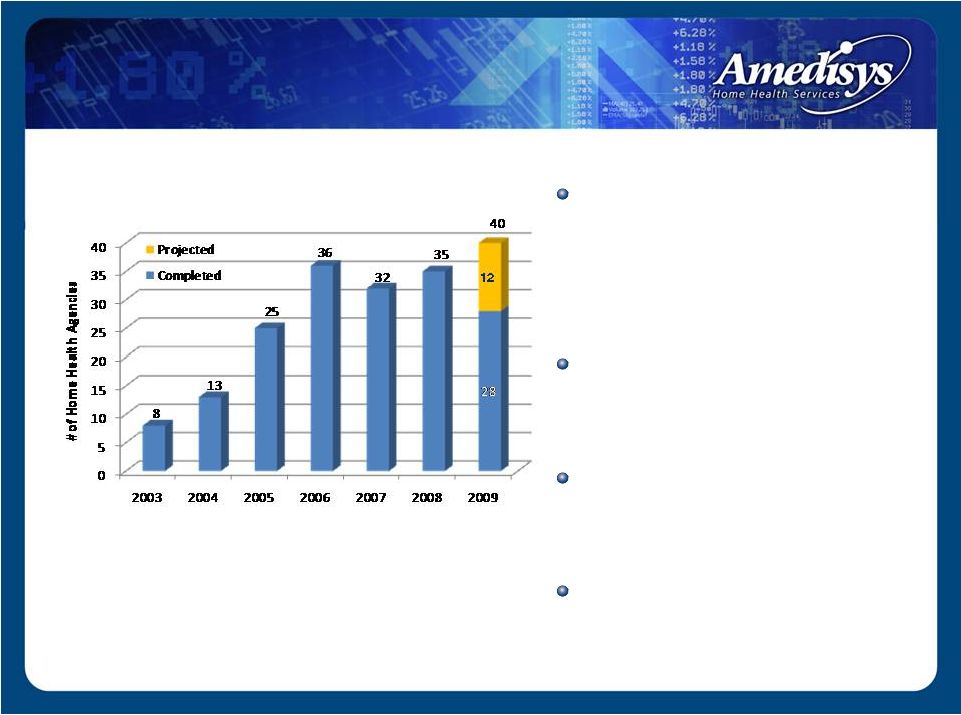 Start-Up
Strategy Home health start-ups typically generate $1.5 - $2.0 million in run-rate revenue by the end of their second year of operations ~ 18 months to recoup the $250,000 - $350,000 investment 40 home health and 5 hospice start-ups projected in 2009 170 start-ups in pipeline, 80 incurring expenses * Reported numbers are for home health start-ups Yearly Start-Ups* 13 |
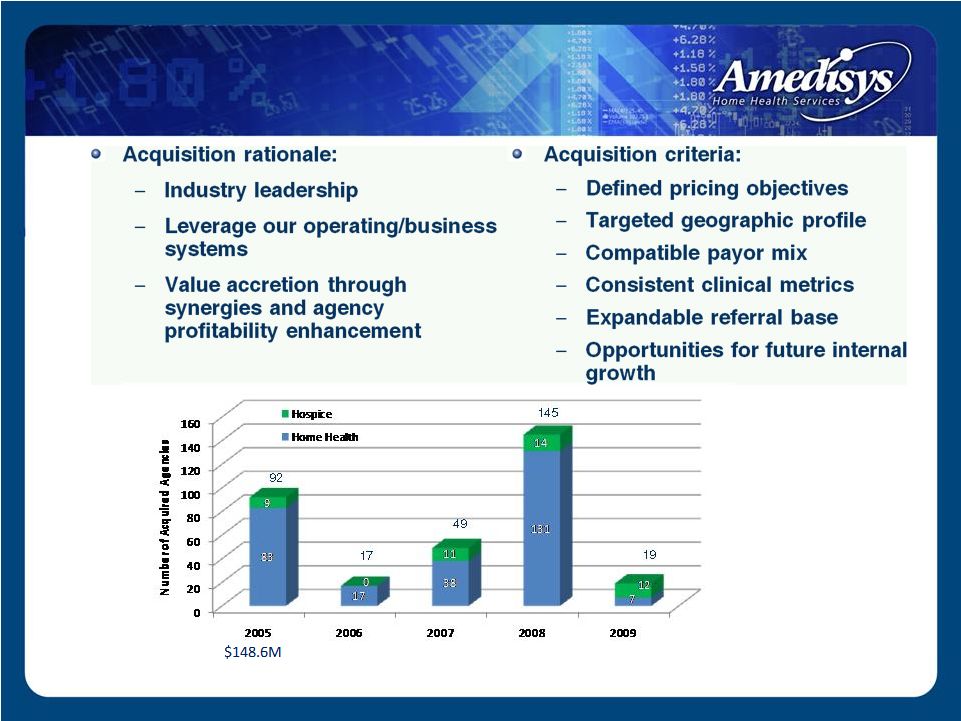 Acquisition
Strategy Reported Purchase Price $17.8M $120.5M $478.1M $39.9M Number of Deals 8 9 10 6 5 14 |
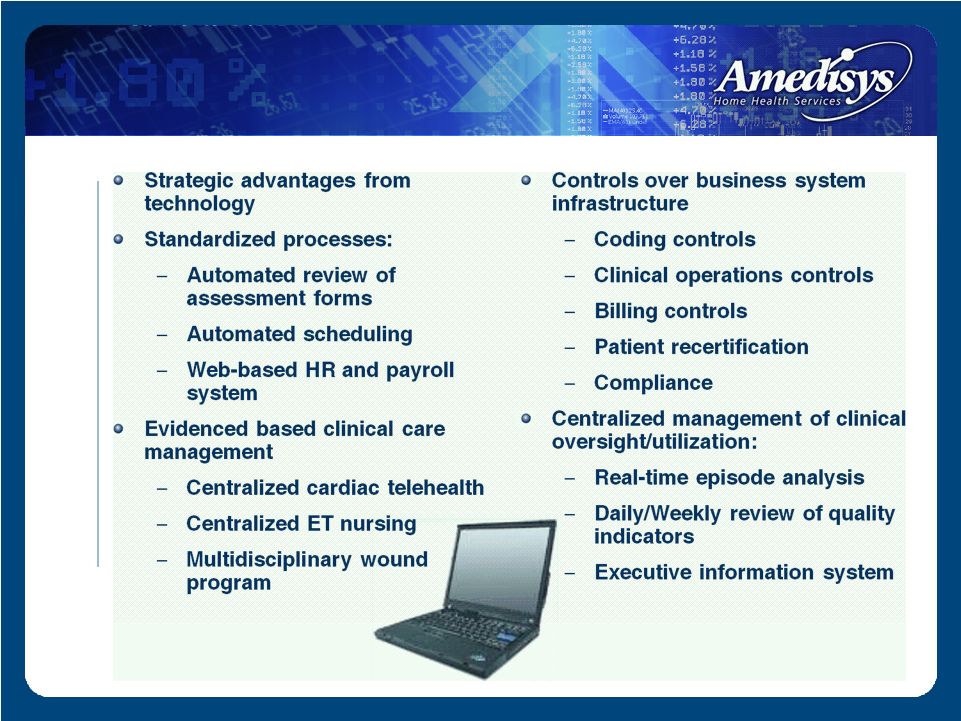 Investments in
Technology 15 |
 16
Comprehensive Compliance Program Local Level • Point of care system enhances clinical documentation accuracy with real-time assessment input • Clinical nurse review of assessments • Physician review/approval • Standardized care plans • Weekly case conferences • Monthly audits • End of episode case review Regional Level Corporate Level • Unannounced compliance & billing audits • Regional directors monitor compliance status and resolve errors • Real-time monitoring capability of local level activity via Point of Care system • Compliance training for all employees • Compliance concerns hotline • Compliance review of metric variances • Compliance manager site visits • Semi-annual clinical/compliance reviews • Annual Sarbanes-Oxley audit • Annual billing competency testing http://www.amedisys.com/pdf/Compliance3/Compliance_Controls.pdf |
 17
Medicare Reimbursement 2008 CMS issued reimbursement changes Expands HHRG’s from 80 to 153 More integrated reimbursement for therapy Allocation of more dollars to later episodes 2009 Changes Market basket increase of 2.9% Increase offset by 2.75% case mix creep adjustment No rural add-on payment 2010 CMS final ruling Market basket increase of 2.0% Negative 2.75% case mix creep adjustment 10% cap on outlier payments per agency, offset by
base payment increase of 2.5%
|
 18
Strong revenue growth EPS growth of greater than 20% for six consecutive years Stable margins Low leverage Strong cash flow from operations Financial Highlights |
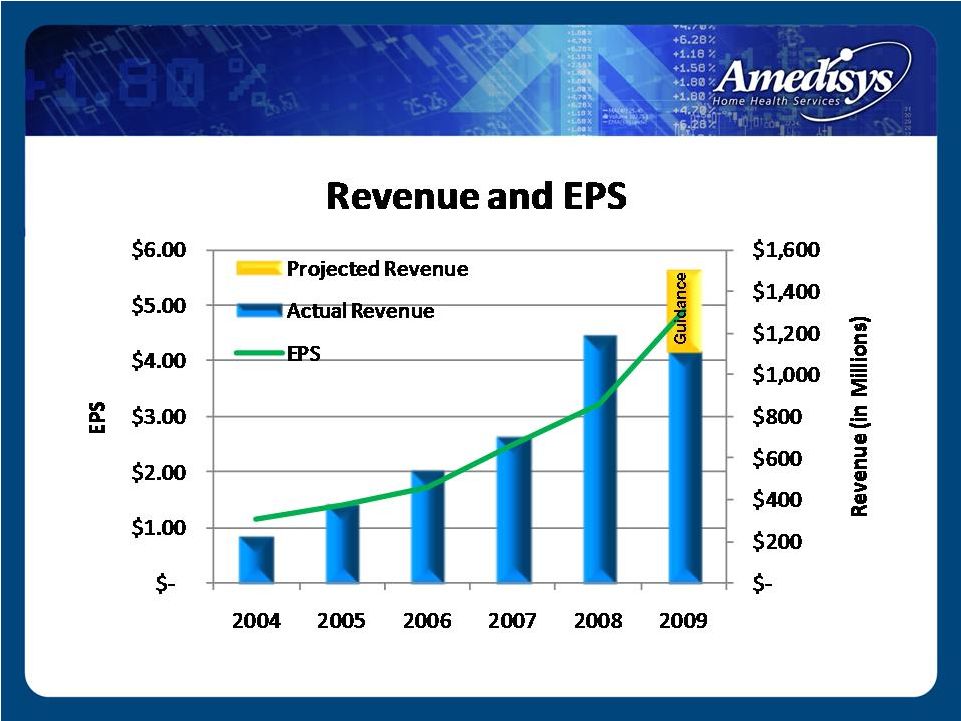 Financial
Highlights 19 |
 20
1 Summary Financial Results ($ in millions, except per share data) 2007 2008 Q308 Q309 Net revenue $697.9 $1,187.4 $321.6 $388.3 Period-over-period growth 29.0% 70.1% 77.8% 20.7% Gross margin 368.9 624.8 170.4 204.6 Percent of revenue 52.9% 52.6% 53.0% 52.7% CFFO 93.1 150.7 29.3 88.6 Adjusted EBITDA 109.8 181.4 50.4 69.1 Percent of revenue 15.7% 15.3% 15.7% 17.8% Adjusted Fully-diluted EPS $2.32 $3.31 $0.89 $1.29 2 1 Adjusted EBITDA is defined as net income attributable to Amedisys, Inc. before provision for income taxes,
net interest (income) expense, and depreciation and amortization plus certain TLC integration
costs and less the Alliance gain. Adjusted EBITDA should not be considered as an alternative to, or more meaningful than, income before income taxes, cash flow from operating activities, or other traditional indicators of operating performance. This calculation
of adjusted EBITDA may not be comparable to a similarly titled measure reported by other
companies, since not all companies calculate this non-GAAP financial measure in the same manner. 2 Adjusted diluted earnings per share is defined as diluted earnings per share plus the earnings per share
effect of certain TLC acquisition costs and less the earnings per share effect of the Alliance
gain. Adjusted diluted earnings per share should not be considered as an alternative to, or more meaningful than, income before income taxes, cash flow from operating activities, or other traditional indicators of operating performance. This calculation of adjusted diluted
earnings per share may not be comparable to a similarly titled measure reported by other
companies, since not all companies calculate this non-GAAP financial measure in the same manner. |
 21
2007 2008 3Q08 3Q09 Agencies at period end 354 528 505 569 Period-over-period growth 28.7% 49.2% 48.1% 12.7% Total visits 4,302,830 7,004,200 1,879,573 2,236,590 Period-over-period growth 25.2% 62.8% 70.4% 19.0% Episodic-based admissions 129,649 199,371 53,203 57,767 Period-over-period growth 19.9% 53.8% 62.8% 8.6% Episodic-based completed episodes 219,855 353,076 94,986 105,107 Period-over-period growth 27.1% 60.6% 69.7% 10.7% Episodic-based revenue per episode $2,660 $2,854 $2,868 $3,189 Period-over-period growth 1.0% 7.3% 7.3% 11.2% Summary Performance Results |
 22
Dec. 31, 2008 Sep. 30, 2009 Assets Cash $ 2.8 $ 45.2 Accounts Receivable, Net 175.7 141.0 Property and Equipment 79.3 87.0 Goodwill 733.9 765.1 Other 78.5 92.6 Total Assets $ 1,070.2 $ 1,130.9 Liabilities and Equity Debt $ 328.5 $ 223.2 All Other Liabilities 179.6 221.6 Equity 562.1 686.1 Total Liabilities and Equity $ 1,070.2 $ 1,130.9 Leverage Ratio 1.6x 0.9 x Summary Balance Sheet ($ in millions) |
 23
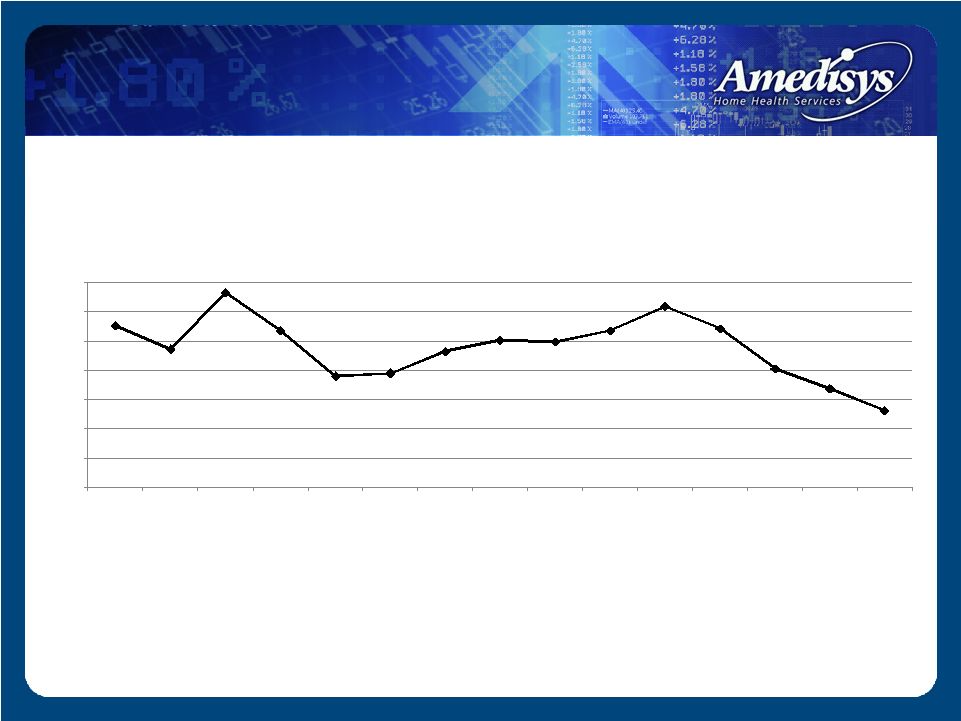
47.7 43.7 53.3 46.8 39.1 39.6 43.3 45.2 45.0 46.8 51.0 47.2 40.4 36.9 33.2 20.0 25.0 30.0 35.0 40.0 45.0 50.0 55.0 3/31/06 6/30/06 9/30/06 12/31/06 3/31/07 6/30/07 9/30/07 12/31/07 3/31/08 6/30/08 9/30/08 12/31/08 3/31/09 6/30/09 9/30/09 DSO - Net (2) Days Revenue Outstanding (DSO) (1) Our calculation of days revenue outstanding, net at March 31, 2008 is derived by dividing our
ending net patient accounts receivable (i.e. net of estimated revenue adjustments, allowance for doubtful accounts and excluding the patient accounts receivable assumed in the TLC Health Care Services,
Inc. (“TLC”) and Family Home Health Care, Inc. & Comprehensive Home Healthcare Services, Inc. (“HMA”) acquisitions) by our average daily net patient revenue, excluding the results of
TLC and HMA for the three-month period ended March 31, 2008. (2) Our calculation of days revenue outstanding, net is derived by dividing our ending net patient
accounts receivable (i.e. net of estimated revenue adjustments and allowance for doubtful accounts) by our average daily net patient revenue for the three-month period. (1) |
 24
Liquidity Available line of credit (LOC): 9/30/09 = $239m 2009 Estimated CFFO - Cap Ex - Required Debt Pay = $180m |
 25
Summary Strong revenue growth EPS growth of greater than 20% for six consecutive years Stable margins Low leverage Strong cash flow from operations |
 26
Guidance 1 Guidance excludes the effects of future acquisitions, if they are made. 2 Provided as of the date of our Form 8-K filed with the Securities and Exchange Commission on
July 28, 2009, reaffirmed in 8-K dated October 27, 2009. Calendar Year
2009 Net revenue: $1.475 - $1.500 billion EPS: $4.75 - $4.90 Diluted shares: 27.8 million 2 1 |
 High Quality
Health Care Source: OCS Corporate Comparative Report Period: 1/1/08 – 9/30/08 27 |
 28
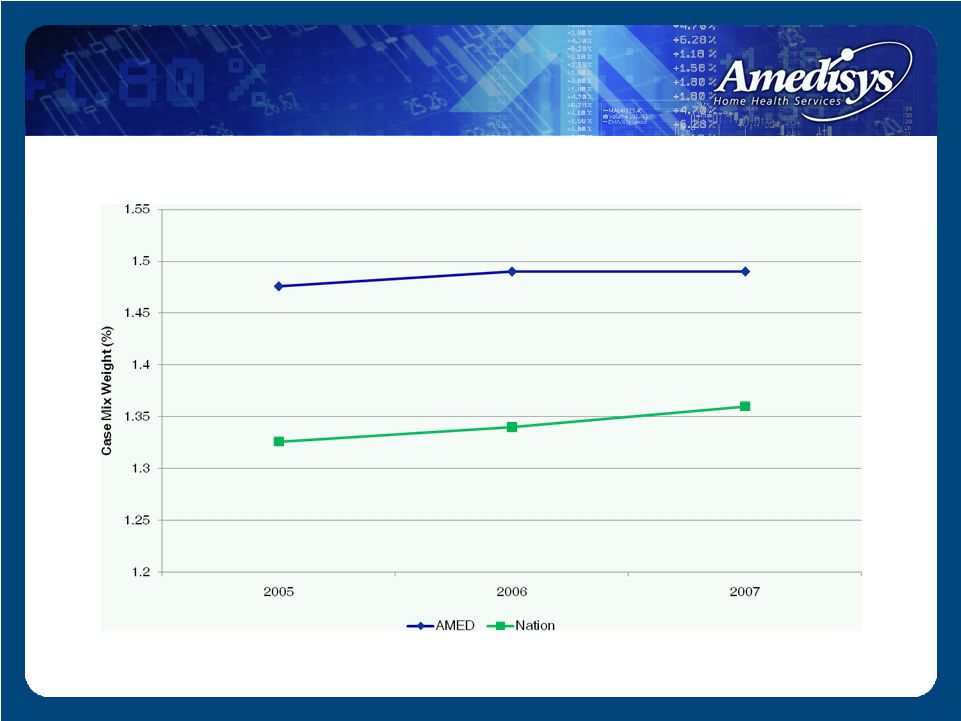
Higher Acuity Level Patients Source: OCS BBI Reporter Corporate Comparative
Report Date
Range: 2005-2007 Case Mix |
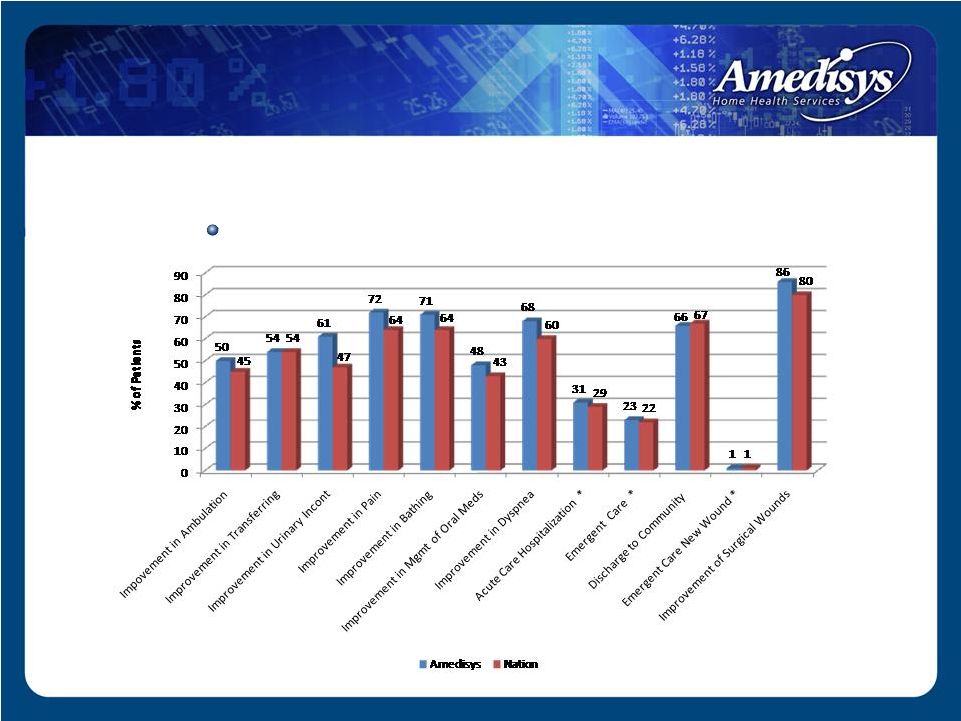 High Quality
Outcomes Outcomes – March 2009 Amedisys vs. Nation * Lower % is better Source: www.medicare.gov Exceeded or met 9 out of 12 outcomes vs. nation 29 |
 30
High Quality Health Care Care Management 13 disease management programs 70 clinical tracks Specialty Division Balanced For Life first program in division Serves higher acuity patients Rolled out to 308 locations through September 2009 |
 31
Marwood Group Report Reviewed Amedisys procedures, corporate compliance processes, controls, clinical infrastructure, technology offerings and future strategies. Compared against three other publicly traded home health companies and 14 large, private non-hospital home health companies. Amedisys ranked highest compared to publicly traded companies Overall score of 84.6% compared to average score of 76.9% |
 32
Contact Information Kevin B. LeBlanc Director of Investor Relations Amedisys, Inc. 5959 S. Sherwood Forest Boulevard Baton Rouge, LA 70816 Office – 225.292.2031 Fax – 225.295.9653 kleblanc@amedisys.com We encourage everyone to visit the Investors section on our website at www.amedisys.com, where we
have posted additional important information such as press releases, profiles concerning our business
and clinical operations and control processes, and SEC filings. We intend to use our website to
expedite public access to time-critical information regarding the Company in advance of or
in lieu of distributing a press release or a filing with the SEC disclosing the same
information. |