Attached files
| file | filename |
|---|---|
| EX-5.1 - OPINION OF HAYNES & BOONE, LLP - PLAINSCAPITAL CORP | dex51.htm |
| EX-23.1 - CONSENT OF ERNST & YOUNG LLP - PLAINSCAPITAL CORP | dex231.htm |
Table of Contents
Index to Financial Statements
As filed with the Securities and Exchange Commission on November 2, 2009
Registration No. 333-161548
UNITED STATES SECURITIES AND EXCHANGE COMMISSION
Washington, D.C. 20549
AMENDMENT NO. 3
TO
FORM S-1
REGISTRATION STATEMENT
UNDER
THE SECURITIES ACT OF 1933
PLAINSCAPITAL CORPORATION
(Exact Name of Registrant as Specified in its Charter)
| Texas | 6022 | 75-2182440 | ||
| (State or other jurisdiction of incorporation or organization) |
(Primary Standard Industrial Classification Code Number) |
(I.R.S. Employer Identification No.) |
2323 Victory Avenue, Suite 1400
Dallas, Texas 75219
(214) 252-4100
(Address, including zip code, and telephone number, including area code, of registrant’s principal executive offices)
PlainsCapital Corporation
Attention: Alan B. White, Chief Executive Officer
2323 Victory Avenue, Suite 1400
Dallas, Texas 75219
(214) 252-4100
(Name, address, including zip code, and telephone number, including area code, of agent for service)
Copies to:
| Greg R. Samuel, Esq. Haynes and Boone, LLP |
Richard D. Truesdell, Jr., Esq. Davis Polk & Wardwell LLP | |
| 2323 Victory Avenue, Suite 700 Dallas, TX 75219 (214) 651-5000 Fax: (214) 200-0577 |
450 Lexington Avenue New York, New York 10017 (212) 450-4000 Fax: (212) 450-3800 |
Approximate date of proposed sale to public: As soon as practicable on or after the effective date of this registration statement.
If any of the securities being registered on this Form are to be offered on a delayed or continuous basis pursuant to Rule 415 under the Securities Act of 1933 check the following box. ¨
If this Form is filed to register additional securities for an offering pursuant to Rule 462(b) under the Securities Act, please check the following box and list the Securities Act registration statement number of the earlier effective registration statement for the same offering. ¨
If this Form is a post-effective amendment filed pursuant to Rule 462(c) under the Securities Act, check the following box and list the Securities Act registration statement number of the earlier effective registration statement for the same offering. ¨
If this Form is a post-effective amendment filed pursuant to Rule 462(d) under the Securities Act, check the following box and list the Securities Act registration statement number of the earlier effective registration statement for the same offering. ¨
Indicate by check mark whether the registrant is a large accelerated filer, an accelerated filer, a non-accelerated filer, or a smaller reporting company. See definitions of “large accelerated filer,” “accelerated filer,” and “smaller reporting company” in Rule 12b-2 of the Exchange Act. (Check one):
| Large accelerated filer ¨ | Accelerated filer ¨ | |||
| Non-accelerated filer x | Smaller reporting company ¨ | |||
| (Do not check if a smaller reporting company) | ||||
The registrant hereby amends this registration statement on such date or dates as may be necessary to delay its effective date until the registrant shall file a further amendment which specifically states that this registration statement shall thereafter become effective in accordance with section 8(a) of the Securities Act of 1933 or until the registration statement shall become effective on such date as the Commission, acting pursuant to said section 8(a), may determine.
Table of Contents
Index to Financial Statements
The information in this preliminary prospectus is not complete and may be changed. We may not sell these securities until the registration statement filed with the Securities and Exchange Commission is effective. This preliminary prospectus is not an offer to sell these securities, and we are not soliciting an offer to buy these securities in any state where the offer or sale is not permitted.
Subject to completion, dated November 2, 2009
Preliminary Prospectus
15,000,000 shares

Common stock
This is an initial public offering of Common Stock by PlainsCapital Corporation. PlainsCapital Corporation is selling 10,287,899 shares of our Common Stock and the selling shareholders, including certain members of our senior management, are selling 4,712,101 shares of our Common Stock. The estimated initial public offering price is between $14.00 and $16.00 per share.
Our Common Stock has been authorized for listing on the New York Stock Exchange under the symbol “PCB,” subject to official notice of issuance.
| Per share | Total | |||||
| Initial public offering price |
$ | $ | ||||
| Underwriting discounts and commissions |
$ | $ | ||||
| Proceeds to PlainsCapital Corporation, before expenses |
$ | $ | ||||
| Proceeds to selling shareholders, before expenses |
$ | $ | ||||
We have granted the underwriters an option for a period of 30 days to purchase from us up to additional shares of Common Stock. We will not receive any proceeds from the sale of shares by the selling shareholders.
Following this offering, we will have two outstanding classes of common stock, Common Stock and Original Common Stock. The rights of the holders of the shares of Common Stock and Original Common Stock are identical, except with respect to conversion. Each share of Original Common Stock is convertible at any time at our election into one share of Common Stock. The Original Common Stock also will automatically convert into shares of Common Stock in certain circumstances. See “Description of capital stock” beginning on page 156.
Investing in our Common Stock involves a high degree of risk. See “Risk factors” beginning on page 10.
Neither the Securities and Exchange Commission nor any state securities commission has approved or disapproved of these securities or passed on the adequacy or accuracy of this prospectus. Any representation to the contrary is a criminal offense.
The Common Stock is not a deposit or savings account. The Common Stock is not insured by the Federal Deposit Insurance Corporation or any other governmental agency or instrumentality.
J.P. Morgan
Sole book-running manager
| Fox-Pitt Kelton Cochran Caronia Waller | ||||
| Keefe, Bruyette & Woods | ||||
| Stephens Inc. | ||||
, 2009
Table of Contents
Index to Financial Statements
Markets of Principal Subsidiaries
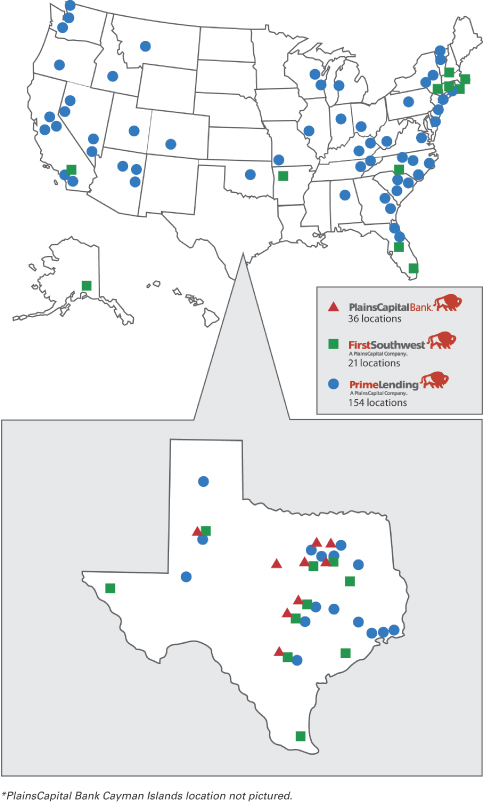
Table of Contents
Index to Financial Statements
| 1 | ||
| 10 | ||
| 27 | ||
| 29 | ||
| 30 | ||
| 31 | ||
| 33 | ||
| Management’s discussion and analysis of financial condition and results of operations |
36 | |
| 86 | ||
| 112 | ||
| 119 | ||
| 141 | ||
| 143 | ||
| 156 | ||
| 161 | ||
| Certain material U.S. federal income and estate tax considerations for non-U.S. shareholders |
163 | |
| 165 | ||
| 171 | ||
| 171 | ||
| 171 | ||
| 171 | ||
| F-1 | ||
You should rely only on the information contained in this prospectus. We have not authorized anyone to provide you with information different from that contained in this prospectus. If you receive any information not authorized by us, then you should not rely on it.
We are offering to sell, and seeking offers to buy, shares of our Common Stock only in jurisdictions where offers and sales are permitted. The information contained in this prospectus is accurate only as of the date of this prospectus, regardless of the time of delivery of this prospectus or of any sale of our Common Stock.
No action is being taken in any jurisdiction outside the United States to permit a public offering of the Common Stock or possession or distribution of this prospectus in that jurisdiction. Persons who come into possession of this prospectus in jurisdictions outside the United States are required to inform themselves about and to observe any restrictions as to this offering and the distribution of this prospectus applicable to that jurisdiction.
i
Table of Contents
Index to Financial Statements
This summary highlights certain information contained elsewhere in this prospectus. This summary is not complete and does not contain all of the information that you should consider before investing in our Common Stock. You should read this entire prospectus carefully, including the risks discussed under “Risk factors” and the financial statements and notes thereto included elsewhere in this prospectus. Some of the statements in this summary constitute forward-looking statements. See “Forward-looking statements”.
As used in this prospectus, unless the context otherwise indicates, the references to “we,” “us,” “our,” “our company,” or “PlainsCapital” refer to PlainsCapital Corporation, a Texas corporation, and its consolidated subsidiaries as a whole, references to the “Bank” refer to PlainsCapital Bank (a wholly-owned subsidiary of PlainsCapital Corporation), references to “First Southwest” refer to First Southwest Holdings, LLC (a wholly-owned subsidiary of the Bank) and its subsidiaries as a whole, and references to “PrimeLending” refer to PrimeLending, a PlainsCapital Company (a wholly-owned subsidiary of the Bank) and its subsidiaries as a whole. Statistical information concerning metropolitan markets are calculated based upon the applicable Metropolitan Statistical Area.
During the third quarter of 2009, we changed our segment reporting. We describe this change in Note 18 to our consolidated interim financial statements for the three and nine months ended September 30, 2009. We did not restate our annual financial information for the periods ended December 31, 2008, 2007 and 2006 because the information for these periods is presented on the basis that management used to manage our business during these periods.
Overview
We are a Texas corporation and a financial holding company registered under the Bank Holding Company Act of 1956 (as amended, the “Bank Holding Company Act”), as amended by the Gramm-Leach-Bliley Act of 1999 (the “Gramm-Leach-Bliley Act”). Five members of our senior executive team have worked together for the last 21 years. We have paid constant or increased dividends to our shareholders for each of the past 20 years and have been profitable for each of those years. For the years 1990 though 2008, our consolidated assets increased from $346.0 million to $4.0 billion and our consolidated net income increased from $2.0 million to $24.1 million, representing a compounded annual growth rate of 14% and 15%, respectively. As of September 30, 2009, we employed approximately 2,600 people in 211 locations in 36 states across our three business segments.
We provide the personalized client service and responsiveness most often associated with smaller financial institutions while offering the sophisticated products and services frequently associated with larger financial institutions. In addition to traditional banking services, we also provide wealth and investment management, treasury management, capital equipment leasing, residential mortgage lending, investment banking, public finance advisory services, fixed income sales and trading, asset management and correspondent clearing.
As of September 30, 2009, on a consolidated basis, we had total assets of approximately $4.7 billion, total deposits of approximately $3.2 billion, total loans, including loans held for sale, of approximately $3.5 billion and shareholders’ equity of approximately $431.1 million. We have
1
Table of Contents
Index to Financial Statements
experienced significant growth since our inception. Over the five-year period ending December 31, 2008, our net revenues, which we define as the sum of net interest income and noninterest income, increased 30.3% from $189.1 million to $246.4 million.
Business segments
We operate through three complementary business segments: banking, mortgage origination and financial advisory. We believe the diversification of income sources from each of our business segments mitigates business risk and provides opportunities for growth in varied economic conditions. During 2008 and the first nine months of 2009, approximately 59.9% and 35.0%, respectively, of our net revenue was derived from our banking segment. The operations of our mortgage origination segment have historically represented our second largest source of annual revenue, but have represented our largest net revenue segment in the first nine months of 2009, primarily as a result of a favorable interest rate environment for mortgage refinancing in the first half of 2009, as well as an increase in the volume of mortgage originations for home purchases that began in the third quarter of 2009. During 2008 and the first nine months of 2009, the mortgage origination segment generated approximately 37.7% and 44.3%, respectively, of our net revenue. The operations of First Southwest were acquired on December 31, 2008 and have been included in our financial advisory segment beginning as of January 1, 2009. The financial advisory segment contributed 20.7% to total net revenue for the first nine months of 2009.
Banking. The Bank was the ninth largest bank headquartered in Texas based upon deposits as of June 30, 2009 with 35 locations in the Austin, Dallas/Fort Worth, Lubbock and San Antonio markets. The Bank seeks to differentiate itself from its competitors by offering highly personalized service and tailoring its operating strategy to different markets. The Lubbock market serves as a strong source of core deposits for the Bank. In other markets, we operate a model focusing on middle-market companies and high net worth individuals. With $4.4 billion in assets as of September 30, 2009, and capital ratios that significantly exceed regulatory guidelines for “well capitalized” banks, we believe the Bank is well positioned for continued growth.
Mortgage origination. Our mortgage origination segment is operated through the Bank’s wholly-owned subsidiary, PrimeLending, and offers a variety of residential mortgage loan products from offices in 32 states. We sell substantially all mortgage loans we originate in the secondary market and do not service these loans. Last year we originated more than $2.3 billion in mortgage loans, and, in the first nine months of 2009, set a new company record for the highest aggregate dollar amount of loans originated in the first nine months of a year. By dollar volume, approximately half of our loans originated during the first nine months of 2009 were collateralized by residential real estate located in Texas. In 2008, according to Computer Business Methods, Inc., as a result of our substantial PrimeLending operations in Texas, we ranked sixth in Texas for total dollar amount of Texas mortgage loan originations and first in Texas for Federal Housing Administration (“FHA”) mortgage loan originations in Texas.
Financial advisory. Through our wholly-owned subsidiary, First Southwest, we offer public finance, advisory and related services, which, for the nine months ended September 30, 2009, represented a majority of the net revenues of First Southwest. Additionally, First Southwest offers corporate finance, investment banking, fixed income sales and trading services, asset management and correspondent clearing. Our financial advisory segment includes 23 offices nationwide, 13 of which are in Texas. We believe that the public finance industry is well
2
Table of Contents
Index to Financial Statements
positioned to capitalize on the federal government’s infrastructure stimulus legislation. Our public finance advisory business ranked first nationally, based upon number of issuances, and third nationally, based upon par volume of issuances, for the five-year period ending on September 30, 2009, according to information derived from MuniAnalytics. First Southwest currently has a financial advisory relationship with more than 1,300 public sector clients.
History and expansion
We were founded in Lubbock, Texas, in 1987 by current Chairman and Chief Executive Officer Alan B. White, other members of senior management and a group of investors. At the time we acquired the Bank in 1988, it had approximately $198.8 million in assets and was the fifth largest bank in the Lubbock market by deposits. Over the next 20 years, our market share and service offering grew, highlighted by the following events:
| • | In 1998, we expanded our product offerings beyond traditional banking services by entering the mortgage origination segment through the acquisition of a Lubbock-based mortgage company. |
| • | In 1999, we entered a new geographic market by expanding our mortgage origination operations through the acquisition of PrimeLending, a Dallas-based mortgage company with five locations in the Dallas-Fort Worth metroplex. The Bank also opened its first banking location outside of the West Texas region in the Turtle Creek neighborhood of Dallas. |
| • | In 2000, we moved our corporate headquarters to Dallas and opened our first banking location in Austin. |
| • | In 2004, the Bank entered the Fort Worth and San Antonio markets. |
| • | In 2008, we acquired First Southwest, a diversified private investment banking firm, in order to expand our financial advisory segment. |
Markets
We are based in Texas, a state with a population expected to grow 9.3% over the next five years compared to expected growth of 4.6% for the United States. If Texas were its own country, it would have the 11th largest economy in the world according to the Texas Comptroller of Public Accounts. Texas hosts the headquarters of more Fortune 500 companies than any other state according to the July 9, 2009 edition of The Economist and as of August 2009 had an unemployment rate that was 1.7 percentage points below the national average according to the U.S. Bureau of Labor Statistics.
We have an expanding footprint in the “Texaplex,” the geographic region encompassing Dallas-Fort Worth, Houston, San Antonio and Austin. Of the 24 million Texas residents, four out of five live inside this region according to GMAC Real Estate. The Texaplex is projected to grow by 14 million people by the year 2030 according to GMAC Real Estate and represents the primary focus of our geographic growth efforts.
We also benefit from having our headquarters and a strong presence in Dallas. The Dallas-Fort Worth region ranks second for revenue generated from Fortune 500 companies according to the
3
Table of Contents
Index to Financial Statements
April 2008 issue of Fortune, and Dallas-Fort Worth ranks fourth nationally in the number of corporate headquarters according to the North Texas Commission. To capture opportunities in this region, the Bank has 13 branches in the Dallas-Fort Worth market with $1,131 million in deposits as of September 30, 2009.
In addition, we are a leader in the Lubbock market, with approximately $1.0 billion in deposits and a 19.2% deposit market share as of June 30, 2009. In the Lubbock market, we employ a traditional community bank marketing strategy. Our Lubbock deposit base has provided dependable funding for our historical growth.
Although each of our segments generated most of its revenue from within Texas during 2008, our mortgage origination and financial advisory segments also operate in markets outside of Texas. We intend to expand our existing footprint into other markets.
Business and growth strategies
We intend to grow by employing the following business strategies:
Focus on medium-sized businesses owned and operated by high net worth individuals. Unlike many of our competitors, the Bank has, with the exception of the Lubbock market, foregone a branch intensive, mass marketing retail strategy. Rather, we have focused, and we will continue to focus, the Bank’s growth efforts on privately held businesses with $5 million—$250 million in annual revenue. Often through a banking relationship with these types of businesses, we also develop business relationships with associated high net worth individuals and affluent households.
Emphasize customer responsiveness and personalized service. We provide clients with prompt, local decision-making concerning their borrowing and other financial needs. We entrust our experienced leadership teams with the authority and flexibility to enable us to implement and maintain the most effective solutions personalized for our customers. As a result, we intend to continue to capitalize on attracting new customers from our competitors who have not adequately met the dynamic and fast-paced financial needs of entrepreneurs and middle market businesses. As an example of our personalized services, our staff of couriers bring branch banking services to our business customers and other select high net worth customers.
Cross-sell products and realize operational synergies among our three businesses. We intend to continue to identify products and services to cross-sell to customers among our business segments. In addition, we expect to increase revenues by continuing to realize synergies among our three business segments. For example, the Bank provides our mortgage origination segment with a consistent source of funding, and First Southwest’s correspondent clearing business represents a dependable and significant source of deposits for the Bank.
Target hiring of experienced professionals that fit with our culture. We intend to continue to hire and retain highly experienced and qualified banking and financial professionals with successful track records and, for account managers, established relationships within our target customer population. Our historical growth has primarily been the result of hiring experienced bankers rather than acquiring banks. Our success has resulted from our knowledge of, and relationships with, our clients that our bankers have developed over time. We believe this knowledge and these relationships have enabled us to mitigate many of the credit difficulties that our competitors have experienced.
4
Table of Contents
Index to Financial Statements
Acquire companies, branches and offices that fit with our unique culture and philosophy. Consistent with our strategy of hiring experienced bankers and financial professionals, we intend to pursue strategic acquisitions where we obtain a leadership team and
structure with significant banking or financial services experience in a market area that will smoothly integrate into and complement our present operational culture and/or supplement our geographic footprint. In light of recent unprecedented market conditions, we may also pursue other distressed sale opportunities to acquire assets that complement our existing operations on a cost-effective basis.
Corporate information
Our principal executive office is located at 2323 Victory Avenue, Suite 1400, Dallas, TX 75219. Our telephone number is (214) 252-4100 and our corporate website address is www.plainscapital.com. Information contained on our website is not incorporated by reference into this prospectus and you should not consider information contained on, or accessible through, our website as part of this prospectus.
5
Table of Contents
Index to Financial Statements
The offering
The following summary of the offering contains basic information about the offering and the Common Stock and is not intended to be complete. It does not contain all the information that is important to you. For a more complete understanding of the Common Stock, please refer to the section of this prospectus entitled “Description of capital stock”.
Common Stock offered:
| By PlainsCapital Corporation |
10,287,899 shares. |
| 12,537,899 shares if the underwriters exercise their over-allotment option in full. |
| By the selling shareholders |
4,712,101 shares. |
| Total Common Stock offered |
15,000,000 shares. |
Common Stock to be outstanding immediately after this offering:
| Common Stock |
15,000,000 shares. |
| 17,250,000 shares if the underwriters exercise their over-allotment option in full. |
| Original Common Stock |
29,101,712 shares.1 |
| Total shares |
44,101,712 shares. |
| Use of proceeds |
We estimate that our net proceeds from this offering, after deducting underwriting discounts, commissions and offering expenses, will be approximately $142.0 million, or approximately $173.4 million if the underwriters exercise their over-allotment option in full, based on an assumed initial offering price of $15.00 per share (the midpoint of the estimated public offering price set forth on the cover page of this prospectus). We intend to use the net proceeds: |
| • |
first, to redeem for approximately $92 million our Fixed Rate Cumulative Perpetual Preferred Stock, Series A and Fixed Rate Cumulative Perpetual Preferred Stock, Series B (the “Series A and Series B Preferred Stock”) that we issued to the U.S. Treasury pursuant to the U.S. Treasury’s Capital Purchase Program; |
| • |
second, to repay approximately $20 million of our existing debt under a revolving line of credit owed to an affiliate of J.P. Morgan Securities Inc.; and |
| • |
third, the remainder to support and enhance our operations. |
| 1 | No later than June 30, 2011, each share of Original Common Stock will convert into one share of Common Stock. See “Description of capital stock”. |
6
Table of Contents
Index to Financial Statements
The approval of the Board of Governors of the Federal Reserve System (the “Federal Reserve Board”) is required for the repurchase of these Series A and Series B Preferred Stock. We do not know when, or if, we will receive such approval. If we do not receive the necessary regulatory approval to repurchase the Series A and Series B Preferred Stock, or our board of directors subsequently determines not to repurchase the Series A and Series B Preferred Stock, then we intend to use approximately $20 million of the net proceeds of the offering to repay existing debt owed to an affiliate of J.P. Morgan Securities Inc. and to use the remaining net proceeds to support and enhance operations. We will not receive any proceeds from the sales of our Common Stock by the Selling Shareholders.
| Risk factors |
You should carefully read and consider the information set forth under “Risk factors,” together with all of the other information set forth in this prospectus, before deciding to invest in shares of our Common Stock. |
| Proposed New York Stock Exchange listing |
Our Common Stock has been authorized for listing on the New York Stock Exchange (the “NYSE”) under the symbol “PCB,” subject to official notice of issuance. Our Original Common Stock will not be listed. |
| Conflicts of Interest |
Our indirect wholly owned subsidiary, First Southwest Company, is participating as a broker-dealer in this offering, and an affiliate of J.P. Morgan Securities Inc., one of the underwriters, will receive a portion of the net proceeds from this offering and, therefore, each has a “conflict of interest”. For more information, see “Conflicts of interest”. |
The number of shares of our Common Stock and Original Common Stock to be outstanding after this offering based on 33,813,813 shares of our Original Common Stock outstanding as of September 30, 2009 will be 44,101,712 including 1,697,430 shares of Original Common Stock escrowed pursuant to the earnout provisions of the Merger Agreement (defined herein) but excluding 969,552 shares of common stock reserved for issuance upon the exercise of outstanding options at a weighted average exercise price of $8.43 per share.
Except as otherwise indicated, all information contained in this prospectus assumes:
| • | an initial offering price of $15.00 per share (which is the midpoint of the range on the cover page of this prospectus); and |
| • | the underwriters’ option to purchase up to 2,250,000 additional shares of Common Stock is not exercised. |
All share and per share information referenced through this prospectus has been retroactively adjusted to reflect the following actions effected on August 28, 2009:
| • | a redesignation of our then-outstanding shares of common stock as “Original Common Stock” (except for our audited consolidated financial statements for the years ended December 31, 2008, 2007 and 2006 and the notes thereto) and |
| • | a three-for-one stock split of our Original Common Stock and a change in the par value of our Original Common Stock from $10.00 per share to $0.001 per share. |
7
Table of Contents
Index to Financial Statements
Summary historical consolidated financial information
The following tables set forth our summary historical consolidated financial information for each of the periods indicated. The historical information as of and for the years ended December 31, 2004 through 2008 has been derived from our audited consolidated financial statements for the years ended December 31, 2004 through 2008, and our historical information for the nine months ended September 30, 2009 and 2008 has been derived from our unaudited financial statements for the nine months ended September 30, 2009 and 2008. The historical results set forth below and elsewhere in this prospectus are not necessarily indicative of our future performance.
The following selected historical financial information is only a summary and should be read in conjunction with “Use of proceeds,” “Capitalization,” “Management’s discussion and analysis of financial condition and results of operations,” “Certain relationships and related party transactions” and our audited and unaudited financial statements and related notes included elsewhere in this prospectus. The operating results and financial condition of First Southwest are included in the tables below as of January 1, 2009 and December 31, 2008, respectively.
| As of and for the Nine Months Ended September 30, |
As of and for the Years Ended December 31, | |||||||||||||
| 2009 | 2008 | 2008 | 2007 | 2006 | 2005 | 2004 | ||||||||
| Income Statement Data: |
||||||||||||||
| Total interest income |
$149,946 | $146,923 | $193,392 | $220,895 | $192,812 | $148,636 | $108,373 | |||||||
| Total interest expense |
31,992 | 52,167 | 66,069 | 104,805 | 86,973 | 58,307 | 27,513 | |||||||
| Net interest income |
117,954 | 94,756 | 127,323 | 116,090 | 105,839 | 90,329 | 80,860 | |||||||
| Provision for loan losses |
39,073 | 7,818 | 22,818 | 5,517 | 5,049 | 5,516 | 2,604 | |||||||
| Net interest income after provision for loan losses |
78,881 | 86,938 | 104,505 | 110,573 | 100,790 | 84,813 | 78,256 | |||||||
| Total noninterest income |
248,420 | 86,709 | 119,066 | 84,281 | 101,776 | 110,027 | 109,882 | |||||||
| Total noninterest expense |
271,435 | 135,702 | 186,722 | 151,358 | 163,203 | 163,708 | 157,161 | |||||||
| Income from continuing operations before income taxes |
55,866 | 37,945 | 36,849 | 43,496 | 39,363 | 31,132 | 30,977 | |||||||
| Federal income tax provision |
19,991 | 13,448 | 12,725 | 14,904 | 13,624 | 12,612 | 11,043 | |||||||
| Income from continuing operations |
35,875 | 24,497 | 24,124 | 28,592 | 25,739 | 18,520 | 19,934 | |||||||
| Income from discontinued Amarillo operations (net-of-tax) |
— | — | — | — | — | 11,536 | 1,161 | |||||||
| Net income |
35,875 | 24,497 | 24,124 | 28,592 | 25,739 | 30,056 | 21,095 | |||||||
| Less: Net income attributable to noncontrolling interest |
126 | 234 | — | — | — | — | — | |||||||
| Net income attributable to PlainsCapital Corporation |
35,749 | 24,263 | 24,124 | 28,592 | 25,739 | 30,056 | 21,095 | |||||||
| Dividends on preferred stock and other |
4,319 | — | — | — | — | — | — | |||||||
| Income applicable to PlainsCapital Corporation common shareholders |
$31,430 | $24,263 | $24,124 | $28,592 | $25,739 | $30,056 | $21,095 | |||||||
| Per Share Data: |
||||||||||||||
| Income from continuing operations—basic |
$1.01 | $0.93 | $0.92 | $1.10 | $1.00 | $0.73 | $0.94 | |||||||
| Discontinued operations—basic |
— | — | — | — | — | $0.45 | $0.06 | |||||||
| Net income—basic |
$1.01 | $0.93 | $0.92 | $1.10 | $1.00 | $1.18 | $1.00 | |||||||
| Weighted average shares outstanding—basic |
31,255,362 | 26,101,797 | 26,117,934 | 26,012,250 | 25,785,612 | 25,552,734 | 21,185,286 | |||||||
| Income from continuing operations—diluted |
$0.95 | $0.92 | $0.92 | $1.09 | $0.99 | $0.71 | $0.93 | |||||||
| Discontinued operations—diluted |
— | — | — | — | — | $0.45 | $0.05 | |||||||
| Net income—diluted |
$0.95 | $0.92 | $0.92 | $1.09 | $0.99 | $1.16 | $0.98 | |||||||
| Weighted average shares outstanding—diluted |
33,141,824 | 26,245,619 | 26,256,165 | 26,195,211 | 26,030,505 | 25,874,433 | 21,463,983 | |||||||
| Book value per common share |
$10.97 | $9.71 | $9.99 | $8.97 | $8.06 | $7.26 | $7.52 | |||||||
| Tangible book value per common share |
$9.30 | $8.31 | $8.82 | $7.54 | $6.63 | $5.81 | $5.68 | |||||||
8
Table of Contents
Index to Financial Statements
| As of and for the Nine Months Ended September 30, |
As of and for the Years Ended December 31, |
||||||||||||||||||||
| 2009 | 2008 | 2008 | 2007 | 2006 | 2005 | 2004 | |||||||||||||||
| Balance Sheet Data(1): |
|||||||||||||||||||||
| Total assets |
$4,676,303 | $3,367,099 | $3,951,996 | $3,182,863 | $2,880,697 | $2,690,305 | $2,426,040 | ||||||||||||||
| Loans held for sale |
428,341 | 145,681 | 198,866 | 100,015 | 126,839 | 194,712 | 181,134 | ||||||||||||||
| Investment securities |
479,615 | 208,859 | 385,327 | 191,175 | 187,225 | 177,379 | 196,617 | ||||||||||||||
| Loans, net of unearned income |
3,052,348 | 2,696,345 | 2,965,619 | 2,597,362 | 2,203,019 | 1,956,066 | 1,648,243 | ||||||||||||||
| Allowance for loan losses |
(39,799 | ) | (26,404 | ) | (40,672 | ) | (26,517 | ) | (24,722 | ) | (22,666 | ) | (22,086 | ) | |||||||
| Goodwill and intangible assets, net |
52,101 | 36,586 | 36,568 | 37,307 | 37,136 | 37,362 | 38,977 | ||||||||||||||
| Total deposits |
3,249,772 | 2,328,789 | 2,926,099 | 2,393,354 | 2,496,050 | 2,321,109 | 1,929,898 | ||||||||||||||
| Capital lease obligations |
8,441 | 8,719 | 8,651 | 3,994 | 4,148 | 72 | 143 | ||||||||||||||
| Notes payable |
70,691 | 52,425 | 151,014 | 40,256 | 35,860 | 46,460 | 55,500 | ||||||||||||||
| Junior subordinated debentures |
67,012 | 67,012 | 67,012 | 51,548 | 51,548 | 51,548 | 50,000 | ||||||||||||||
| PlainsCapital Corporation shareholders’ equity |
431,068 | 253,407 | 399,815 | 233,890 | 209,332 | 186,431 | 159,178 | ||||||||||||||
| Performance Ratios*: |
|||||||||||||||||||||
| Return on average equity |
11.56% | 13.31% | 7.61% | 12.98% | 13.20% | 17.42% | 14.13% | ||||||||||||||
| Return on average assets |
1.11% | 0.99% | 0.68% | 0.95% | 0.95% | 1.19% | 0.95% | ||||||||||||||
| Net interest margin (taxable equivalent)(2) |
4.02% | 4.20% | 4.17% | 4.27% | 4.36% | 3.96% | 4.22% | ||||||||||||||
| Efficiency ratio(3) |
74.09% | 74.78% | 75.93% | 75.40% | 78.20% | 81.19% | 81.64% | ||||||||||||||
| Asset Quality Ratios: |
|||||||||||||||||||||
| Total nonperforming assets to total loans and other real estate |
2.49% | 2.32% | 2.03% | 0.96% | 0.75% | 1.09% | 0.80% | ||||||||||||||
| Allowance for loan losses to nonperforming loans |
63.63% | 60.21% | 86.87% | 153.81% | 226.79% | 119.43% | 636.67% | ||||||||||||||
| Allowance for loan losses to total loans |
1.30% | 0.98% | 1.37% | 1.02% | 1.12% | 1.16% | 1.34% | ||||||||||||||
| Net charge-offs to average loans* |
1.19% | 0.28% | 0.37% | 0.15% | 0.14% | 0.24% | 0.12% | ||||||||||||||
| Capital Ratios: |
|||||||||||||||||||||
| Leverage ratio |
9.98% | 8.81% | 12.70% | 8.06% | 8.22% | 7.92% | 7.12% | ||||||||||||||
| Tier 1 risk-based capital ratio |
11.95% | 9.73% | 12.83% | 8.99% | 9.27% | 9.24% | 8.22% | ||||||||||||||
| Total risk-based capital ratio |
13.57% | 11.32% | 14.53% | 10.67% | 10.91% | 10.97% | 10.01% | ||||||||||||||
| Equity to assets ratio |
9.22% | 7.53% | 10.12% | 7.35% | 7.27% | 6.93% | 6.56% | ||||||||||||||
| Dividend payout ratio(4) |
14.19% | 16.37% | 22.02% | 17.26% | 19.06% | 15.33% | 16.82% | ||||||||||||||
| Tangible common equity to tangible assets(5) |
6.29% | 6.51% | 7.04% | 6.25% | 6.06% | 5.62% | 5.04% | ||||||||||||||
| * | Annualized for interim periods. |
| (1) | Balance sheet includes First Southwest as of December 31, 2008. |
| (2) | Net interest income (taxable equivalent) divided by average interest-earning assets. |
| (3) | Noninterest expense divided by the sum of total noninterest income and net interest income for the period. |
| (4) | Total dividends paid divided by net income attributable to PlainsCapital Corporation for the period. |
| (5) | See “Selected historical financial Information—GAAP reconciliation and management explanation of non-GAAP financial measure.” |
We adopted SFAS 160, Noncontrolling Interest in Consolidated Financial Statements, an Amendment of ARB Statement No. 5, on January 1, 2009. Noncontrolling interests reported in the table above for periods prior to the adoption of SFAS 160 have not been retrospectively adjusted to conform to the provisions of SFAS 160 due to the immateriality of those adjustments.
9
Table of Contents
Index to Financial Statements
Investing in our Common Stock involves a high degree of risk. You should consider carefully the following risk factors and the other information in this prospectus (including our consolidated financial statements and related notes appearing at the end of this prospectus) before you decide to purchase our Common Stock. The risks described below are those that we believe are the material risks we face currently, but are not the only risks facing us and our business prospects. If any of the events contemplated by the following discussion should occur, our business, financial condition and operating results could be adversely affected. As a result, the trading price of our Common Stock could decline and you could lose part or all of your investment.
Risks related to our business
Recent negative developments in the financial industry and the domestic and international credit markets may adversely affect our operations and results.
The U.S. and global economies have suffered a dramatic downturn during the past few years, which has negatively impacted many industries, including the financial industry. As a result, commercial as well as consumer loan portfolio performances have deteriorated at many financial institutions, and the competition for deposits and quality loans has increased significantly. In addition, the values of real estate collateral supporting many commercial loans and home mortgages have declined and may continue to decline, which has contributed to a greater degree of loan defaults. Financial institutions have also been particularly impacted by the lack of liquidity and loss of confidence in the financial sector. These factors collectively have negatively impacted our business, financial condition and results of operations, including decreased net income due to increased provisions for loan losses, and there is no guarantee when market conditions will improve.
In response to some of these concerns, the federal government has adopted significant new laws and regulations relating to financial institutions, including, without limitation, the Emergency Economic Stabilization Act of 2008 (the “EESA”) and the American Recovery and Reinvestment Act of 2009 (the “ARRA”). Numerous other actions have been taken by the Federal Reserve Board, the U.S. Congress, the U.S. Treasury, the Federal Deposit Insurance Corporation (the “FDIC”), the Securities and Exchange Commission (the “SEC”) and others to address the current liquidity and credit crisis, and we cannot predict the full effect of these actions or any future regulatory reforms. Negative developments in the financial industry and the domestic and international credit markets, and the impact of new or future legislation in response to those developments, may negatively impact our operations by restricting our business operations, including our ability to originate or sell loans and attract and retain experienced personnel, and adversely impact our financial performance.
A further adverse change in real estate market values may result in losses and otherwise adversely affect our profitability.
As of September 30, 2009, approximately 51% of our loan portfolio was comprised of loans with real estate as a primary or secondary component of collateral. The real estate collateral in each case provides an alternate source of repayment in the event of default by the borrower and may deteriorate in value during the time the credit is extended. The recent negative developments in the financial industry and economy as a whole have adversely affected real estate market values generally and in our market areas in Texas specifically and may continue to decline. A further
10
Table of Contents
Index to Financial Statements
decline in real estate values could further impair the value of our collateral and our ability to sell the collateral upon any foreclosure. In the event of a default with respect to any of these loans, the amounts we receive upon sale of the collateral may be insufficient to recover the outstanding principal and interest on the loan. As a result, our profitability and financial condition may be adversely affected by a further decrease in real estate market values.
If our allowance for loan losses is insufficient to cover actual loan losses, our earnings will be adversely affected.
As a lender, we are exposed to the risk that our loan customers may not repay their loans according to the terms of these loans and the collateral securing the payment of these loans may be insufficient to fully compensate us for the outstanding balance of the loan plus the costs to dispose of the collateral. We may experience significant loan losses that may have a material adverse effect on our operating results and financial condition.
We maintain an allowance for loan losses intended to cover loan losses inherent in our loan portfolio. In determining the size of the allowance, we rely on an analysis of our loan portfolio, our experience and our evaluation of general economic conditions. We also make various assumptions and judgments about the collectibility of our loan portfolio, including the diversification by industry of our commercial loan portfolio, the effect of changes in the economy on real estate and other collateral values, the results of recent regulatory examinations, the effects on the loan portfolio of current economic indicators and their probable impact on borrowers, the amount of charge-offs for the period and the amount of non-performing loans and related collateral security. If our assumptions prove to be incorrect, our current allowance may not be sufficient and adjustments may be necessary to allow for different economic conditions or adverse developments in our loan portfolio. Material additions to the allowance for loan losses would materially decrease our net income and adversely affect our financial condition generally.
In addition, federal and state regulators periodically review our allowance for loan losses and may require us to increase our provision for loan losses or recognize further loan charge-offs, based on judgments different than our own. Any increase in our allowance for loan losses or loan charge-offs required by these regulatory agencies could have a material adverse effect on our operating results and financial condition.
Our geographic concentration may magnify the adverse effects and consequences of any regional or local economic downturn.
We conduct our operations primarily in Texas. Substantially all of the real estate loans in our loan portfolio are secured by properties located in Texas, with more than 70% secured by properties located in the Dallas/Fort Worth and Austin/San Antonio markets. Likewise, substantially all of the real estate loans in our loan portfolio are made to borrowers who live and conduct business in Texas. In addition, mortgage origination fee income is heavily dependent on economic conditions in Texas. During the first nine months of 2009, approximately half by dollar volume of our mortgage loans originated were collateralized by properties located in Texas. Our businesses are affected by general economic conditions such as inflation, recession, unemployment and many other factors beyond our control. Adverse economic conditions in Texas may result in a reduction in the value of the collateral securing our loans. Any regional or local economic downturn that affects Texas or existing or prospective property or borrowers in Texas may affect us and our profitability more significantly and more adversely than our competitors that are less geographically concentrated.
11
Table of Contents
Index to Financial Statements
Our business is subject to interest rate risk and fluctuations in interest rates may adversely affect our earnings and capital levels and overall results.
The majority of our assets are monetary in nature and, as a result, we are subject to significant risk from changes in interest rates. Changes in interest rates may impact our net interest income as well as the valuation of our assets and liabilities. Our earnings are significantly dependent on our net interest income, which is the difference between interest income on interest-earning assets, such as loans and securities, and interest expense on interest-bearing liabilities, such as deposits and borrowings. We expect to periodically experience “gaps” in the interest rate sensitivities of our assets and liabilities, meaning that either our interest-bearing liabilities will be more sensitive to changes in market interest rates than our interest-earning assets, or vice versa. In either event, if market interest rates should move contrary to our position, this “gap” may work against us, and our earnings may be adversely affected.
An increase in the general level of interest rates may also, among other things, adversely affect the demand for loans and our ability to originate loans. In particular, if mortgage interest rates increase, the demand for residential mortgage loans and the refinancing of residential mortgage loans will likely decrease, which will have an adverse effect on our income generated from mortgage origination activities. Conversely, a decrease in the general level of interest rates, among other things, may lead to prepayments on our loan and mortgage-backed securities portfolios and increased competition for deposits. Accordingly, changes in the general level of market interest rates may adversely affect our net yield on interest-earning assets, loan origination volume and our overall results.
Although our asset-liability management strategy is designed to control and mitigate exposure to the risks related to changes in the general level of market interest rates, market interest rates are affected by many factors outside of our control, including inflation, recession, unemployment, money supply, and international disorder and instability in domestic and foreign financial markets. We may not be able to accurately predict the likelihood, nature and magnitude of such changes or how and to what extent such changes may affect our business. We also may not be able to adequately prepare for or compensate for the consequences of such changes. Any failure to predict and prepare for changes in interest rates or adjust for the consequences of these changes may adversely affect our earnings and capital levels and overall results.
We are heavily dependent on dividends from our subsidiaries.
We are a bank holding company and a financial holding company engaged in the business of managing, controlling and operating our subsidiaries, including the Bank and the Bank’s subsidiaries, PrimeLending and First Southwest. We conduct no material business or other activity other than activities incidental to holding stock in the Bank. As a result, we rely substantially on the profitability of the Bank and dividends from the Bank to pay our operating expenses, to satisfy our obligations and the expenses and obligations of all of our subsidiaries and to pay dividends on our common stock and preferred stock. As with most financial institutions, the profitability of the Bank is subject to the fluctuating cost and availability of money, changes in interest rates and in economic conditions in general. The Bank has several subsidiaries, including PrimeLending and First Southwest, that may also contribute to its profitability and ability to pay dividends to us. However, if the Bank is unable to make cash distributions to us, then we may also be unable to obtain funds from PrimeLending and First Southwest, and we may be unable to satisfy our obligations or make distributions on our common stock and preferred stock.
12
Table of Contents
Index to Financial Statements
Our banking segment is subject to funding risks associated with its high deposit concentration and reliance on brokered deposits.
At September 30, 2009, our fifteen largest depositors, excluding First Southwest, our indirect wholly-owned subsidiary, accounted for approximately 27% of our total deposits, and our five largest depositors, excluding First Southwest, accounted for approximately 15% of our total deposits. Brokered deposits at September 30, 2009 accounted for 5.6% of our total deposits. Loss of one or more of our largest Bank customers, a significant decline in our deposit balances due to ordinary course fluctuations related to these customers’ businesses, or a loss of a significant amount of our brokered deposits could adversely affect our liquidity. Additionally, such circumstances could require us to raise deposit rates in an attempt to attract new deposits, or purchase federal funds or borrow funds on a short-term basis at higher rates, which would adversely affect our results of operations. Under applicable regulations, if the Bank were no longer “well-capitalized,” the Bank would not be able to accept broker deposits without the approval of the FDIC. See “Business—Government supervision and regulation—PlainsCapital Corporation”.
We are subject to losses due to fraudulent and negligent acts.
Our business is subject to potential losses resulting from fraudulent activities. Our banking segment is subject to the risk that our customers may engage in fraudulent activities, including fraudulent access to legitimate customer accounts or the use of a false identity to open an account, or the use of forged or counterfeit checks for payment. The banking segment is subject to the risk of higher than expected charge offs for loans it holds to maturity on its balance sheet if its borrowers supply fraudulent information. Such types of fraud may be difficult to prevent or detect, and we may not be able to recover the losses caused by such activities. Any such losses could have a material adverse effect on our business, financial condition and operating results.
In our mortgage origination segment, we rely heavily upon information supplied by third parties including the information contained in the loan application, property appraisal, title information and employment and income documentation. If any of this information is intentionally or negligently misrepresented and such misrepresentation is not detected prior to loan funding, the investment value of the loan may be significantly lower than expected. Whether a misrepresentation is made by the loan applicant, another third party or one of our own employees, we generally bear the risk of loss associated with the misrepresentation. A mortgage loan subject to a material misrepresentation is typically unsaleable to investors in the secondary market. If we have already sold the loan when the material misrepresentation is discovered, then the loan is subject to repurchase, but we will often instead agree to indemnify the purchaser for any losses arising from such loan because in the general course of business we do not seek to hold mortgage loans we originate for investment. Even though we may have rights against persons and entities who made or knew about the misrepresentation, such persons and entities are often difficult to locate, and it is often difficult to collect any monetary losses that we have suffered from them. We cannot assure you that we have detected or will detect all misrepresented information in our loan originations. If we experience a significant number of such fraudulent or negligent acts, our business, financial condition, liquidity and results of operations could be significantly harmed.
On August 14, 2009, one of our employees was indicted, along with eleven other individuals and three business entities, in Cuyahoga County, Ohio. The indictment alleges that our employee was part of a loan application fraud scheme, and specifically identifies loans on three properties in the aggregate amount of approximately $3.3 million that we originated and sold to investors. If
13
Table of Contents
Index to Financial Statements
those loans were in fact obtained through fraud, we could be forced to repurchase such loans at the purchase price, or would be required to indemnify such investors for any losses they suffer from such loans pursuant to our agreements with such investors. We cannot assure you that we have detected or will detect all misrepresented information in our loan originations, including with respect to such employee.
First Southwest engages in the underwriting of municipal and other tax-exempt debt securities. As an underwriter, First Southwest may be liable jointly and severally under federal, state and foreign securities laws for false and misleading statements concerning the securities, or the issuer of the securities, that it underwrites. In addition, First Southwest may act as a fiduciary in other capacities. Liability under such laws or under common law fiduciary principles could have a material adverse effect on our business, financial condition, liquidity, and results of operations.
Our mortgage origination segment is subject to investment risk on loans that it originates.
We intend to sell, and not hold for investment, all residential mortgage loans that we originate through PrimeLending. At times, however, we may originate a loan or execute an interest rate lock commitment (“IRLC”) with a customer pursuant to which we agree to originate a mortgage loan on a future date at an agreed-upon interest rate without having identified a purchaser for such loan or the loan underlying such IRLC. An identified purchaser may also decline to purchase a loan for a variety of reasons. In these instances, we will bear interest rate risk on an IRLC until, and unless, we are able to find a buyer for the loan underlying such IRLC and the risk of investment on a loan until, and unless, we are able to find a buyer for such loan. In addition, if a customer defaults on a mortgage payment shortly after the loan is originated, the purchaser of the loan may have a put right, whereby they can require us to repurchase the loan at the full amount paid by the purchaser. During periods of market downturn, we have at times chosen to hold mortgage loans when the identified purchasers have declined to purchase such loans because we could not obtain an acceptable substitute bid price for such loan. The failure of mortgage loans that we hold on our books to perform adequately will have a material adverse effect our financial condition, liquidity and results of operations.
First Southwest is subject to various risks associated with the securities industry, particular those impacting the public finance industry.
Our financial advisory business, conducted primarily through First Southwest, is subject to uncertainties that are common in the securities industry. These uncertainties include:
| • | intense competition in the public finance and other sectors of the securities industry; |
| • | the volatility of domestic and international financial, bond and stock markets; |
| • | extensive governmental regulation; |
| • | litigation; and |
| • | substantial fluctuations in the volume and price level of securities. |
As a result, the revenues and earnings of our financial advisory segment may vary significantly from quarter to quarter and from year to year. In periods of low transaction volume such as in the current economic downturn, profitability is impaired because certain expenses remain relatively fixed. First Southwest is much smaller and has much less capital than many competitors in the securities industry. During the current market downturn, First Southwest’s business has been, and could continue to be, adversely affected in many ways. In addition, First Southwest is an operating subsidiary of the Bank, which means that its activities are limited to those that are permissible for the Bank.
14
Table of Contents
Index to Financial Statements
We are dependent on our management team, and the loss of our senior executive officers or other key employees could impair our relationship with customers and adversely affect our business and financial results.
Our success is dependent, to a large degree, upon the continued service and skills of our existing management team, including Messrs. Alan White, Allen Custard, Jerry Schaffner, Hill Feinberg and Ms. Roseanna McGill and other key employees with long-term customer relationships. Our business and growth strategies are built primarily upon our ability to retain employees with experience and business relationships within their respective segments. The loss of one or more of these key personnel could have an adverse impact on our business because of their skills, knowledge of the market, years of industry experience and the difficulty of finding qualified replacement personnel. In addition, we currently do not have non-competition agreements with certain members of management and other key employees. If any of these personnel were to leave and compete with us, our business, financial condition, results of operations and growth could suffer.
If we are not able to manage our growth effectively, our results of operations may be adversely affected.
Although our historical performance may not be indicative of our future performance, during the last five years, we have experienced significant and rapid growth and may continue to grow. Companies like us that experience rapid growth face various risks and difficulties, including:
| • | opening new branch offices of the Bank, First Southwest or PrimeLending or acquiring existing branches of other financial institutions; |
| • | attracting clients, borrowers and depositors to those locations; |
| • | attracting and retaining qualified management, bankers and other personnel to each of our three primary businesses; |
| • | maintaining adequate information and reporting systems within our organization; |
| • | maintaining asset quality and credit risk controls; |
| • | maintaining our cost controls; |
| • | maintaining adequate regulatory capital and obtaining regulatory approvals necessary for entry into new markets or establishing new branches, applications for which have recently been subject to increased regulatory scrutiny; |
| • | finding suitable acquisition candidates; and |
| • | identifying suitable geographic markets for expansion outside the Texaplex. |
As we continue to open new branches and offices or if management determines to acquire branches, offices or other banks, we expect to incur increased personnel, occupancy and other operating expenses. In the case of new Bank branches, we must absorb those higher expenses while we begin to generate new deposits and then redeploy those new deposits into attractively priced loans and other interest-earning assets. Based on our experience, it generally takes at least a year for new branches to achieve operational profitability, if ever. Similarly, in the case of new offices for PrimeLending or First Southwest, we may face periods of losses before these offices achieve operational profitability, if ever. Thus, our plans to establish additional branches and
15
Table of Contents
Index to Financial Statements
offices could depress our earnings in the short run, even if we efficiently execute our expansion strategy. Further, if we are not able to manage our growth effectively, our business, financial condition, results of operations and future prospects could be adversely affected and we may not be able to continue to implement our business strategy and successfully conduct our operations.
We only recently became a public reporting company, and the obligations associated with being a public reporting company will require significant resources and management attention, which may divert from our business operations.
We have only recently become a public reporting company, and the expenses of being a public reporting company, including compliance with periodic disclosure requirements and the Sarbanes-Oxley Act of 2002, as amended (the “Sarbanes-Oxley Act”), are not reflected in our audited financial statements, and are not fully reflected in our unaudited interim financial statements. The Sarbanes-Oxley Act requires, among other things, our management to assess annually the effectiveness of our internal control over financial reporting and our independent registered public accounting firm to issue a report on our internal control over financial reporting beginning with our Annual Report on Form 10-K for the year ending December 31, 2010. As a result, we will incur significant legal, accounting and other expenses that we did not previously incur.
Furthermore, the need to establish and maintain the corporate infrastructure demanded of a public company may divert management’s attention from implementing our business and growth strategies, which could prevent us from improving our business, results of operations and financial condition. We have made, and will continue to make, changes to our internal controls and procedures for financial reporting and accounting systems to meet our reporting obligations as a public company. However, the measures we take may not be sufficient to satisfy our obligations as a public company. In addition, we cannot predict or estimate the amount of additional costs that we may incur in order to comply with these requirements. We anticipate that these costs will materially increase our noninterest expenses.
We may not be able to remediate any future deficiencies in time to meet the deadline imposed by the Sarbanes-Oxley Act for compliance with the requirements of Section 404. In addition, failure to achieve and maintain an effective internal control environment could have a material adverse effect on our business and stock price.
We may decide to make future acquisitions, which could dilute current shareholders’ ownership and expose us to additional risks.
We periodically evaluate opportunities to acquire financial services businesses, including other banks and/or branch or office locations. As a result, we may engage in negotiations or discussions that, if they were to result in a transaction, could have a material effect on our operating results and financial condition, including short and long-term liquidity. For example, we could issue additional shares of common stock in a purchase transaction, which could dilute current shareholders’ ownership interests. Acquisition activities could require us to use a substantial amount of cash, other liquid assets, and/or incur debt. In addition, if goodwill recorded in connection with our prior or potential future acquisitions were determined to be impaired, then we would be required to recognize a charge against our earnings, which could materially and adversely affect our results of operations during the period in which the impairment was recognized.
16
Table of Contents
Index to Financial Statements
These acquisition activities could involve a number of additional risks, including the risks of: (i) incurring time and expense associated with identifying and evaluating potential acquisitions and merger partners and negotiating potential transactions, resulting in management’s attention being diverted from the operation of our existing business; (ii) using inaccurate estimates and judgments to evaluate credit, operations, management and market risks with respect to the target institution or assets; (iii) failing to discover material factors when examining a potential acquisition during the due diligence period; (iv) incurring time and expense required to integrate the operations and personnel of the combined businesses, creating an adverse short-term effect on results of operations; and (v) losing key employees and customers as a result of an acquisition that is poorly received.
Financial markets are susceptible to disruptive events that may lead to little or no liquidity for auction rate bonds.
As of December 31, 2008, we held approximately $168.4 million face value of auction rate bonds backed by pools of student loans under the Federal Family Education Loan Program. These auction rate bonds were acquired in conjunction with our acquisition of First Southwest. Since December 31, 2008 and in conjunction with a settlement with the Financial Industry Regulatory Authority (“FINRA”) pursuant to a Letter of Acceptance, Waiver and Consent accepted on December 16, 2008 by FINRA (the “FINRA Settlement”), as of September 30, 2009, we had repurchased approximately $41.6 million in face value of certain auction rate bonds from current and former clients. The auction rate bonds are currently held in the Bank’s securities portfolio. In late 2007, the market for auction rate securities began experiencing disruptions through the failure of auctions for auction rate securities issued by leveraged closed-end funds, municipal governments, state instrumentalities and student loan companies backed by pools of student loans guaranteed by the U.S. Department of Education. Certain clients of First Southwest were adversely affected by the failures in this market, which resulted in limited options to liquidate holdings in these positions or to post these securities as collateral for loans. These conditions will likely continue until either these securities are restructured or refunded or a liquid secondary market re-emerges for these securities. The estimated fair value of our auction rate bonds as of September 30, 2009 was $174.0 million. To address a change in an interpretation of the regulatory requirements regarding the maximum allowed level of investments in certain securities, in June 2009 the Bank transferred auction rate bonds with a net carrying amount of $22.6 million from held to maturity to available for sale. The net carrying amount of the transferred securities included an unrealized loss of $0.2 million. If the Bank were forced to sell these securities, our results of operations could be adversely affected. The estimated fair value of these auction rate bonds may further decline and require write-downs and losses as additional market information is obtained or in the event the current market conditions continue or worsen, in which case, our results of operations would be adversely affected.
The accuracy of our financial statements and related disclosures could be affected if we are exposed to actual conditions different from the judgments, assumptions or estimates used in our critical accounting policies.
The preparation of financial statements and related disclosure in conformity with accounting principles generally accepted in the United States of America (“GAAP”) requires us to make judgments, assumptions and estimates that affect the amounts reported in our consolidated financial statements and accompanying notes. Our critical accounting policies, which are included in this prospectus, describe those significant accounting policies and methods used in the
17
Table of Contents
Index to Financial Statements
preparation of our consolidated financial statements that are considered “critical” by us because they require judgments, assumptions and estimates that materially impact our consolidated financial statements and related disclosures. As a result, if future events differ significantly from the judgments, assumptions and estimates in our critical accounting policies, such events or assumptions could have a material impact on our audited consolidated financial statements and related disclosures.
The FDIC and SIPC deposit insurance assessments that we are required to pay have recently increased and may materially increase in the future, which would have an adverse effect on our earnings.
As a member institution of the FDIC, we are required to pay semi-annual deposit insurance premium assessments to the FDIC. During the year ended December 31, 2008, we paid approximately $1.6 million in deposit insurance assessments. On September 29, 2009, the Board of Directors of the FDIC adopted a Notice of Proposed Rulemaking that would require FDIC-insured institutions, such as the Bank, to prepay on December 30, 2009 their estimated quarterly risk-based assessments for the fourth quarter of 2009 and for all of 2010, 2011 and 2012. In addition, the FDIC voted to adopt a uniform three-basis point increase in assessment rates effective on January 1, 2011, which increase would be reflected in our prepaid assessments. We expect that we may be required to prepay an estimated $14 million on December 30, 2009 for our fourth quarter of 2009 and all of 2010, 2011 and 2012 FDIC assessments. Our prepaid assessments would be subject to adjustment based upon our assessment base during the prepaid period.
In addition, First Southwest is a registered broker-dealer and a member of the Securities Investor Protection Corporation (“SIPC”) and is required to pay assessments. On March 2, 2009, the SIPC informed its members of an increase in assessments. The increase became effective on April 1, 2009. As a result of the increase, First Southwest expects to pay approximately $200,000 in SIPC assessments annually. The deposit insurance premium assessment and the SIPC assessment rates applicable to us will adversely impact our future earnings.
Economic stimulus legislation imposes certain executive compensation and corporate governance requirements that may adversely affect us and our business, including our ability to recruit and retain qualified employees, and by requiring reimbursement of disapproved executive compensation.
The EESA, as amended by the ARRA, includes extensive restrictions on our ability to pay retention awards, bonuses and other incentive compensation during the period in which we have any outstanding obligation arising under the Troubled Asset Relief Program (“TARP”) Capital Purchase Program. Many of the restrictions are not limited to our senior executives and cover other employees whose contributions to revenue and performance can be significant.
In addition, on June 15, 2009, the U.S. Treasury adopted and made effective an interim final rule (the “Interim Rule”), which implemented and further expanded the limitations and restrictions imposed on executive compensation and corporate governance by the TARP Capital Purchase Program and the EESA, as amended by the ARRA. Pursuant to the Interim Rule, the U.S. Treasury established the Office of the Special Master for TARP Executive Compensation (the “Special Master”). The Interim Rule authorizes the Special Master to review the compensation structures and payments of, and to independently issue advisory opinions to, those financial institutions that have participated in the TARP Capital Purchase Program with respect to compensation
18
Table of Contents
Index to Financial Statements
structures and payments made by those financial institutions during the period that the financial institution received financial assistance under TARP. If the Special Master finds that a TARP recipient’s compensation structure or the payments that it has made to its employees are inconsistent with the purposes of the EESA or TARP, or otherwise contrary to the public interest, the Special Master may negotiate with the TARP recipient and the subject employee for appropriate reimbursements to the TARP recipient or the federal government. Because we are participating in the TARP Capital Purchase Program, the Special Master may review our compensation structure and payments that we have made to our employees.
These provisions and any future rules issued by the U.S. Treasury could adversely affect our ability to attract and retain management capable and motivated sufficiently to manage and operate our business through difficult economic and market conditions, especially if we are competing for management talent against institutions that are not subject to the same restrictions. If we are unable to attract and retain qualified employees to manage and operate our business, we may not be able to successfully execute our business and growth strategies. These provisions could also adversely affect our business by requiring us or our employees to reimburse the federal government for any executive compensation that the Special Master finds inconsistent with the purposes of EESA or TARP, or otherwise contrary to the public interest. For more information, see the section entitled “Executive compensation—Compensation discussion and analysis—TARP Capital Purchase Program”.
A decline in the market for advisory services could adversely affect our business and results of operations.
First Southwest has historically earned a significant portion of its revenues from advisory fees paid to it by its clients, in large part upon the successful completion of the client’s transaction. Financial advisory revenues represented a majority of First Southwest’s net revenues for the nine months ended September 30, 2009. Unlike other investment banks, First Southwest earns most of its revenues from its advisory fees and, to a lesser extent, from other business activities such as underwriting. We expect that First Southwest’s reliance on advisory fees will continue for the foreseeable future, and a decline in advisory engagements or the market for advisory services generally would have an adverse effect on our business and results of operations.
An interruption in, or breach in security of, our information systems may result in a loss of customer business.
We rely heavily on communications and information systems to conduct our business. Any failure or interruption or breach in security of these systems could result in failures or disruptions in our customer relationship management, securities trading, general ledger, deposits, servicing or loan origination systems. If such failures or interruptions occur, we may not be able to adequately address them at all or in a timely fashion. The occurrence of any failures or interruptions could result in a loss of customer business, expose us to civil litigation and possible financial liability and could have a material adverse effect on our public relations, reputation, results of operations and financial condition.
We are subject to extensive regulation that could restrict our activities and impose financial requirements or limitations on the conduct of our business and limit our ability to receive dividends from our bank subsidiary.
We are subject to extensive federal and state regulation and supervision, including that of the Federal Reserve Board, the Texas Department of Banking, the FDIC, the SEC and FINRA. Banking
19
Table of Contents
Index to Financial Statements
regulations are primarily intended to protect depositors’ funds, federal deposit insurance funds and the banking system as a whole, not security holders. Likewise, regulations promulgated by FINRA are primarily intended to protect customers of broker-dealer businesses rather than security holders. These regulations affect our lending practices, capital structure, investment practices, dividend policy and growth, among other things. The U.S. Congress and federal regulatory agencies continually review banking and securities laws, regulations and policies for possible changes. It is likely that there will be significant changes to the banking and financial institutions regulatory regimes in the near future in light of the recent performance of, and government intervention in, the financial services sector. Changes to statutes, regulations or regulatory policies, including changes in interpretation or implementation of statutes, regulations or policies, could affect us in substantial and unpredictable ways. For instance, on June 17, 2009, President Barack Obama laid out a comprehensive regulatory reform plan aiming to modernize and protect the integrity of the U.S. financial system. Among other things, President Obama’s plan contemplates increased supervision and higher capital requirements for financial institutions. We cannot predict whether or in what form any proposed regulation or statute will be adopted or the extent to which our business may be affected by any new regulation or statute. Such changes could subject our business to additional costs, limit the types of financial services and products we may offer and increase the ability of non-banks to offer competing financial services and products, among other things. Failure to comply with laws, regulations or policies could result in sanctions by regulatory agencies, civil money penalties or reputational damage, which could have a material adverse effect on our business, financial condition and results of operations. While we have policies and procedures designed to prevent any such violations, there can be no assurance that such violations will not occur. See the section entitled “Government supervision and regulation”.
The Bank’s 2008 compliance exam initiated by the Federal Reserve is not yet completed. An adverse finding by the Federal Reserve Board regarding compliance with consumer protection laws and regulations, including but not limited to, fair lending laws, flood insurance laws or any other matters associated with a compliance exam of the Bank, could result in a referral of the matter to the U.S. Department of Justice (the “DOJ”) for further investigation, the imposition of civil money penalties, restitution, punitive damages, a reduced CRA rating for the Bank and/or damage to our reputation. A CRA rating of less than “satisfactory” could adversely affect the Bank’s ability to establish new branches or acquire other financial institutions and could adversely affect our ability as a financial holding company to commence new activities, or acquire companies engaged in certain activities, otherwise permitted by financial holding companies having a “satisfactory” or better CRA rating.
Changes in government monetary policies may have an adverse effect on our earnings.
Our earnings are affected by domestic economic conditions and the monetary and fiscal policies of the U.S. government and its agencies. The monetary policies of the Federal Reserve Board have had, and are likely to continue to have, an important impact on the operating results of financial institutions through its power to implement national monetary policy in order to, among other things, curb inflation or combat a recession. The monetary policies of the Federal Reserve Board affect the levels of bank loans, investments and deposits through its control over the issuance of U.S. government securities, its regulation of the discount rate applicable to member banks and its influence over reserve requirements to which member banks are subject. We cannot predict the nature or impact of future changes in monetary and fiscal policies, and any such changes may
20
Table of Contents
Index to Financial Statements
have an adverse effect upon our liquidity, capital resources and results of operations. See the section entitled “Government supervision and regulation”.
Changes in accounting standards could impact our reported earnings and financial condition.
The accounting standards setters, including the Financial Accounting Standards Board (the “FASB”), the SEC and other regulatory bodies, periodically change the financial accounting and reporting standards that govern the preparation of our consolidated financial statements. These changes can be hard to predict and can materially impact how we record and report our financial condition and results of operations. In some cases, we could be required to apply a new or revised standard retroactively, which would result in the restatement of our prior period financial statements.
We face strong competition from other financial institutions and financial service companies, which may adversely affect our operations and financial condition.
Our banking and mortgage origination businesses face vigorous competition from banks and other financial institutions, including savings and loan associations, savings banks, finance companies and credit unions. A number of these banks and other financial institutions have substantially greater resources and lending limits, larger branch systems and a wider array of banking services than we do. We also compete with other providers of financial services, such as money market mutual funds, brokerage firms, consumer finance companies, insurance companies and governmental organizations, each of which may offer more favorable financing than we are able to provide. In addition, some of our non-bank competitors are not subject to the same extensive regulations that govern us. The banking business in Texas, particularly in the Austin, Dallas/Fort Worth, Lubbock and San Antonio metropolitan and surrounding areas, has become increasingly competitive over the past several years, and we expect the level of competition we face to further increase. Our profitability depends on our ability to compete effectively in these markets. This competition may reduce or limit our margins on banking services, reduce our market share and adversely affect our results of operations and financial condition.
Additionally, the financial advisory and investment banking industries are intensely competitive industries and will likely remain competitive. Our financial advisory business competes directly with numerous other financial advisory and investment banking firms, broker-dealers and banks, including large national and major regional firms and smaller niche companies, some of whom are not broker-dealers and, therefore, not subject to the broker dealer regulatory framework. In addition to competition from firms currently in the industry, there has been increasing competition from others offering financial services, including automated trading and other services based on technological innovations. First Southwest competes on the basis of a number of factors, including the quality of advice and service, innovation, reputation and price. Many of First Southwest’s competitors in the investment banking industry have a greater range of products and services, greater financial and marketing resources, larger customer bases, greater name recognition, more managing directors to serve their clients’ needs, greater global reach and more established relationships with their customers than First Southwest. Additionally, some of First Southwest’s competitors have reorganized or plan to reorganize from investment banks into bank holding companies which may provide them with a competitive advantage. These larger and better capitalized competitors may be more capable of responding to changes in the investment banking market, to compete for skilled professionals, to finance acquisitions, to fund internal growth and to compete for market share generally. Increased pressure created by any
21
Table of Contents
Index to Financial Statements
current or future competitors, or by First Southwest’s competitors collectively, could materially and adversely affect our business and results of operations. Increased competition may result in reduced revenue and loss of market share. Further, as a strategic response to changes in the competitive environment, First Southwest may from time to time make certain pricing, service or marketing decisions that also could materially and adversely affect our business and results of operations.
Our financial advisory and mortgage origination businesses are subject to seasonal fluctuations, and, as a result, our results of operations for any given quarter may not be indicative of the results that may be achieved for the full fiscal year.
Our financial advisory and mortgage origination businesses are subject to seasonal fluctuations. Historically, our financial advisory segment earnings have been highest during our third fiscal quarter due to increased issuances related to the commencement of the school year and because the third calendar quarter is often the first quarter of the fiscal year for municipalities. Our mortgage origination segment has historically experienced its highest revenues during the second quarter of the calendar year through the origination of a greater number of purchase mortgage loans as more families tend to move, buy or sell homes during the spring and summer. As a result, our results of operations for any single quarter are not necessarily indicative of the results that may be achieved for a full fiscal year.
We are subject to claims and litigation that could have a material adverse effect on our business.
We face significant legal risks in the business segments in which we operate, and the volume of claims and amount of damages and penalties claimed in litigation and regulatory proceedings against financial institutions remains high. These risks often are difficult to assess or quantify, and their existence and magnitude often remain unknown for substantial periods of time. Substantial legal liability or significant regulatory action against us or any of our subsidiaries could have a material adverse effect on our results of operations or cause significant reputational harm to us, which could seriously harm our business and prospects. Further, regulatory inquiries and subpoenas, other requests for information, or testimony in connection with litigation may require incurrence of significant expenses, including fees for legal representation and fees associated with document production. These costs may be incurred even if we are not a target of the inquiry or a party to the litigation. Any financial liability or reputational damage could have a material adverse effect on our business, which, in turn, could have a material adverse effect on our financial condition and results of operations. Specifically, we are involved in legal proceedings related to the sale of municipal derivatives. See “Business—Legal proceedings”.
We may be subject to environmental liabilities in connection with the foreclosure on real estate assets securing our loan portfolio.
Hazardous or toxic substances or other environmental hazards may be located on the properties that secure our loans. If we acquire such properties as a result of foreclosure or otherwise, we could become subject to various environmental liabilities. For example, we could be held liable for the cost of cleaning up or otherwise addressing contamination at or from these properties. We could also be held liable to a governmental entity or third party for property damage, personal injury or other claims relating to any environmental contamination at or from these properties. Although we have policies and procedures that are designed to mitigate against certain environmental risks, we may not detect all environmental hazards associated with these properties. If we ever became subject to significant environmental liabilities, our business,
22
Table of Contents
Index to Financial Statements
financial condition, liquidity and results of operations could be harmed. See “Business—Legal proceedings” for more information.
Our medium-sized business target market may have fewer financial resources to weather the current downturn in the economy.
We target our business development and marketing strategy primarily to serve the banking and financial services needs of businesses with $5 million—$250 million in annual revenue. These medium-sized businesses generally have fewer financial resources in terms of capital or borrowing capacity than larger entities. If general economic conditions adversely impact these businesses within Texas, our results of operations and financial condition may be adversely affected.
We may not be able to address and adapt to technological change.
The banking industry is undergoing rapid technological changes with frequent introductions of new technology-driven products and services. In addition to better serving customers, the effective use of technology increases efficiency and enables financial institutions to reduce costs. Our future success will depend in part upon our ability to address the needs of our customers by using technology to provide products and services that will satisfy customer demands for convenience as well as create additional operating efficiencies. Many of our competitors have substantially greater resources to invest in technological improvements. If we are not able to effectively implement new technology-driven products and services or be successful in marketing such products and services to our customers and otherwise address and adapt to technological change, our business, financial condition and results of operations could be materially adversely affected.
Risks related to this offering
Shares of certain shareholders may be sold into the market in the near future. This could cause the market price of our Common Stock to drop significantly.
In connection with this offering, we, our directors who have beneficial ownership over our shares or contemplate participating in our directed share program, our executive officers, and certain of our shareholders have each agreed to enter into lock-up agreements that restrict the sale of our Original Common Stock and Common Stock, for a period of 180 days from the date of this prospectus, subject to an extension in certain circumstances. J.P. Morgan Securities Inc., in its sole discretion, may release any of the shares of our Original Common Stock or Common Stock subject to these lock-up agreements at any time without notice. See “Underwriting”. Shares of our Original Common Stock beneficially owned by two of our named executive officers, Messrs. White and Feinberg, in the aggregate amount of 877,977 shares of Original Common Stock, were already pledged to other financial institutions to secure outstanding indebtedness at the time that lock-up agreements with the underwriters were entered into with respect to these shares. As Representative of the Underwriters, J.P. Morgan Securities Inc. has agreed that the lock-ups will not prevent the transfer of such shares of Original Common Stock pursuant to the terms of such pledges in the event of a default on such indebtedness. If Messrs. White or Feinberg default on any of the loans securing such indebtedness, the lender may foreclose on and sell the shares securing such indebtedness.
In addition, after this offering, approximately 7.5 million shares of our Original Common Stock will not be subject to lock-up and upon consummation of the offering may be sold pursuant to
23
Table of Contents
Index to Financial Statements
Rule 144, and all shares of our Original Common Stock will convert to Common Stock no later than the expiration of the 180-day lock-up period. 87,631 shares of our Series A Preferred Stock and 4,382 shares of our Series B Preferred Stock are subject to certain demand registration rights that we granted to the U.S. Treasury in connection with our participation in the TARP Capital Purchase Program. Pursuant to these registration rights and subject to certain exceptions, we have agreed to register our Series A and Series B Preferred Stock on a shelf registration statement on Form S-3 upon demand by U.S. Treasury or its successor in interest. See “Shares eligible for future sale—Registration rights.”
The resale of such shares could cause the market price of our stock to drop significantly, and concerns that those sales may occur could cause the trading price of our Common Stock to decrease or to be lower than it might otherwise be.
No market currently exists for our Common Stock. We cannot assure you that an active trading market will develop for our Common Stock.
Prior to this offering, there has been no public market for shares of our Common Stock. We cannot predict the extent to which investor interest in us will lead to the development of a trading market on the NYSE or otherwise, or how liquid that market might become. If an active market does not develop, you may have difficulty selling any shares of our Common Stock that you purchase in this initial public offering. The initial public offering price for the shares of our Common Stock will be determined by negotiations between us and the representatives of the underwriters, and may not be indicative of prices that will prevail in the open market following this offering.
Shares of our Common Stock are subject to dilution through the earnout provisions that we agreed to in connection with our acquisition of First Southwest.
As of September 30, 2009, we had 33,813,813 shares of Original Common Stock issued and outstanding and outstanding options to purchase 969,552 shares of our Original Common Stock. 1,697,430 shares of our Original Common Stock are currently held in escrow, and 71,322 shares underlying outstanding and unexercised stock options could be held in escrow, if exercised prior to the applicable release date, by an escrow agent on behalf of the former stockholders of First Southwest and may be released to such former stockholders upon the satisfaction of the earnout provisions contained in the merger agreement between us and First Southwest Holdings, Inc., dated as of November 7, 2008, as amended, pursuant to which we acquired First Southwest Holdings, Inc. on December 31, 2008 (the “Merger Agreement”). If we issue additional shares of Common Stock in the future and such issuance is not made to all then-existing common shareholders proportionate to their interests (as in a stock dividend or stock split), then the issuance will result in dilution to each shareholder by reducing his, her or its percentage ownership of the total outstanding shares of our Common Stock.
The U.S. Treasury’s investment in us imposes restrictions and obligations upon us that could adversely affect the rights of our common shareholders.
On December 19, 2008, we sold 87,631 shares of our Series A Preferred Stock, liquidation preference $1,000 per share, for approximately $87.6 million and 4,382 shares of our Series B Preferred Stock, liquidation preference $1,000 per share, to the U.S. Treasury pursuant to the TARP Capital Purchase Program. The shares of Series B Preferred Stock were issued to the U.S. Treasury for nominal consideration upon the exercise of a warrant issued in conjunction with the sale of the Series A Preferred Stock. The shares of Series A and Series B Preferred Stock issued to
24
Table of Contents
Index to Financial Statements
the U.S. Treasury are senior to shares of our Common Stock with respect to dividends and liquidation preference. Under the terms of the Series A Preferred Stock, we are obligated to pay a 5% per annum cumulative dividend on the stated value of the preferred stock until February 15, 2014 and thereafter at a rate of 9% per annum. As long as shares of the Series A and Series B Preferred Stock remain outstanding, we may not pay dividends to our common shareholders (nor may we repurchase or redeem any shares of our Common Stock or Original Common Stock) unless all accrued and unpaid dividends on the Series A and Series B Preferred Stock have been paid in full. Furthermore, prior to December 19, 2011, unless we have redeemed all of the Series A and Series B Preferred Stock, the consent of the U.S. Treasury will be required to, among other things, increase the amount of dividends paid on our Common Stock. After December 19, 2011 and thereafter until December 19, 2018, the consent of the U.S. Treasury (if it then holds any of our Series A and Series B Preferred Stock) will be required for any increase in the aggregate Common Stock dividends per share greater than 3% per annum. After December 19, 2018, we will be prohibited from paying dividends on or repurchasing any Common Stock until the preferred stock issued to the U.S. Treasury is redeemed in whole or the U.S. Treasury has transferred all of its Series A and Series B Preferred Stock to third parties. If dividends on the Series A and Series B Preferred Stock are not paid in full for six dividend periods, whether or not consecutive, the U.S. Treasury will then have the right to elect two directors to our board of directors until all unpaid cumulative dividends are paid in full. The terms of the Series B Preferred Stock are identical to those described above for the Series A Preferred Stock except that (i) the dividend rate is 9% per annum and (ii) the Series B Preferred Stock may not be redeemed unless all of the Series A Preferred Stock is redeemed.
We may invest or spend the proceeds in this offering in ways with which you may not agree and in ways that may not earn a profit.
We intend to use the net proceeds of this offering to redeem our Series A and Series B Preferred Stock issued to the U.S. Treasury under the TARP Capital Purchase Program and any remaining proceeds to repay a portion of our existing debt and to support and enhance our operations. However, we will retain broad discretion over the use of the proceeds from this offering and may use them for purposes other than those contemplated at the time of this offering. You may not agree with the ways we decide to use these proceeds, and our use of the proceeds may not yield any profits.
There can be no assurance when the Series A and Series B Preferred Stock may be redeemed.
While we intend to use a portion of the net proceeds of this offering to redeem the Series A and Series B Preferred Stock, as described in “Use of proceeds,” there can be no assurance when the Series A and Series B Preferred Stock can be redeemed because regulatory approval is required. Until the Series A and Series B Preferred Stock is redeemed, we will remain subject to the terms and conditions set forth in the Certificates of Designations of Series A and Series B Preferred Stock and the rules and regulations of the EESA, as amended by the ARRA, and the Interim Rule. See “Executive compensation—Compensation discussion and analysis—TARP Capital Purchase Program”.
Our organizational documents, the provisions of Texas law to which we are subject and the U.S. Treasury’s TARP Capital Purchase Program may delay or prevent a change in control that you may favor.
Our certificate of formation and bylaws contain various provisions that may delay, discourage or prevent an attempted acquisition or change in control. These provisions include a classification of
25
Table of Contents
Index to Financial Statements
our board of directors, which prevents our directors from being removed during their terms other than for cause. Our certificate of formation also provides for noncumulative voting for directors. In addition, we have additional authorized Common Stock, Original Common Stock and preferred stock, and our board of directors may issue additional shares of our Common Stock, Original Common Stock and preferred stock without shareholder approval and upon such terms as our board of directors may determine. The issuance of additional shares of Common Stock, Original Common Stock and preferred stock, while providing desirable flexibility in connection with possible acquisitions, financings and other corporate purposes, could have the effect of making it more difficult for a third party to acquire, or of discouraging a third party from acquiring, a controlling interest in us. In addition, certain provisions of Texas and federal law, including a provision that restricts certain business combinations between a Texas corporation and certain affiliated shareholders, and certain provisions of our certificate of formation, including a provision prohibiting our shareholders from taking action by written consent without unanimous consent and a provision prohibiting the holders of less than 35% of the voting power represented by all of our shares issued, outstanding and entitled to be voted at a proposed meeting from calling a special meeting of shareholders, may delay, discourage or prevent an attempted acquisition or change in control of us. Furthermore, any change in control of our company is subject to prior regulatory approval under the Bank Holding Company Act or the Change in Bank Control Act. Finally, the preferred stock that we issued to the U.S. Treasury pursuant to the TARP Capital Purchase Program is generally non-voting. Therefore, any potential acquirer may not be able to accomplish a tax free reorganization if the U.S. Treasury insists on securing non-voting preferred stock in any such reorganization.
Our board of directors may issue shares of preferred stock that would adversely affect the rights of our shareholders.
Our authorized capital stock includes 50 million shares of preferred stock, and we have 87,631 shares of Series A Preferred Stock and 4,382 shares of Series B Preferred Stock issued and outstanding. Our board of directors, in its sole discretion, may designate and issue one or more additional series of preferred stock from the authorized and unissued shares of preferred stock. Subject to limitations imposed by law or our certificate of formation, our board of directors is empowered to determine: (i) the designation of, and the number of, shares constituting each series of preferred stock; (ii) the dividend rate for each series; (iii) the terms and conditions of any voting, conversion and exchange rights for each series; (iv) the amounts payable on each series upon redemption or our liquidation, dissolution or winding-up; (v) the provisions of any sinking fund for the redemption or purchase of shares of any series; and (vi) the preferences and the relative rights among the series of preferred stock. Preferred stock could be issued with voting and conversion rights that could adversely affect the voting power of the shares of our Common Stock. The issuance of preferred stock could also result in a series of securities outstanding that would have preferences over the Common Stock with respect to dividends and in liquidation.
An investment in our Common Stock is not an insured deposit.
An investment in our Common Stock is not a bank deposit and is not insured or guaranteed by the FDIC, SIPC or any other government agency. Accordingly, you should be capable of affording the loss of any investment in our Common Stock.
26
Table of Contents
Index to Financial Statements
Certain statements contained in this prospectus that are not statements of historical fact such as “expect,” “estimate,” “project,” “budget,” “forecast,” “anticipate,” “intend,” “plan,” “may,” “will,” “could,” “should,” “believes,” “predicts,” “potential,” “continue,” and similar expressions are intended to identify forward-looking statements but are not the exclusive means of identifying such statements. We make forward-looking statements regarding topics including, without limitation, our projected sources of funds, anticipated changes in our revenues or earnings, expected effects of accounting pronouncements, our use of proceeds, expectations regarding financial or other market conditions, government regulation applicable to our operations, litigation, the availability of acquisition and growth opportunities, our ability to repurchase preferred shares from the U.S. Treasury issued in connection with the TARP Capital Purchase Program, the adequacy of our allowance for loan losses and provision for loan losses and our ability to capitalize on synergistic opportunities as a result of our acquisition of First Southwest.
Forward-looking statements involve significant risks and uncertainties that could cause the actual results to differ materially from those anticipated in such statements. Most of these factors are outside our control and difficult to predict. Factors that may cause such differences include, but are not limited to:
(1) changes in general economic, market and business conditions in areas or markets where we compete;
(2) changes in state and federal laws, regulations or policies affecting one or more of our business segments, including changes in regulatory fees, deposit insurance premiums and capital requirements;
(3) changes in the interest rate environment;
(4) changes in the default rate of our loans and risks associated with concentration in real estate related loans;
(5) changes in the auction rate securities markets, including ongoing liquidity problems related thereto;
(6) cost and availability of capital;
(7) competition for our banking, mortgage origination and financial advisory segments from other banks and financial institutions as well as insurance companies, mortgage originators, investment banking and financial advisory firms, asset-based non-bank lenders and government agencies;
(8) approval of new, or changes in, accounting policies and practices;
(9) our participation in governmental programs implemented under the EESA and the ARRA, including, without limitation, the TARP, the Capital Purchase Program, the Temporary Liquidity Guarantee Program (“ TLGP”), including the Transaction Account Guarantee Program (the “TAGP”) and the impact of such programs and related regulations on us and on international, national, and local economic and financial markets and conditions; and
(10) future legislative or administrative changes to the TARP Capital Purchase Program enacted under EESA.
27
Table of Contents
Index to Financial Statements
For a more detailed discussion of these and other factors that may affect our business, see “Risk factors” and “Management’s discussion and analysis of financial condition and results of operations”. We caution that the foregoing list of factors is not exclusive, and new factors may emerge or changes to the foregoing factors may occur that could impact our business. All subsequent written and oral forward-looking statements concerning our business attributable to us or any person acting on our behalf are expressly qualified in their entirety by the cautionary statements above. We do not undertake any obligation to update any forward-looking statement, whether written or oral, relating to the matters discussed in this prospectus except to the extent required by federal securities laws.
28
Table of Contents
Index to Financial Statements
We estimate that our net proceeds from this offering, after deducting underwriting discounts, commissions and estimated offering expenses, will be approximately $142.0 million, or approximately $173.4 million if the underwriters exercise their over-allotment option in full, based on an assumed initial offering price of $15.00 per share (the midpoint of the estimated public offering price set forth on the cover page of this prospectus). A $1.00 increase (decrease) in the assumed initial public offering price of $15.00 per share (the midpoint of the estimated public offering price set forth on the cover page of this prospectus) would increase (decrease) the net proceeds to us from this offering by approximately $9.6 million, assuming the number of shares offered by us, as set forth on the cover page of this prospectus, remains the same, or approximately $11.7 million if the underwriters’ overallotment option is exercised in full, and after deducting underwriting discounts and commissions and estimated offering expenses payable by us. We intend to use the net proceeds from this offering:
| • | first, to redeem, for approximately $92 million, our Series A and Series B Preferred Stock that we issued to the U.S. Treasury pursuant to the U.S. Treasury’s Capital Purchase Program, at their $1,000 per share liquidation preference, plus accrued and unpaid dividends; |
| • | second, to repay approximately $20 million of our existing debt under a revolving line of credit owed to an affiliate of J.P. Morgan Securities Inc. (the “JPMorgan Debt”), which bears interest at the LIBOR rate plus 2.5% payable quarterly and matures in July, 2010, and a portion of which was drawn during 2008 and was used for general corporate purposes; and |
| • | third, the remaining net proceeds to support and enhance our operations. |
We will not receive any proceeds from the sales of our Common Stock in the offering by the selling shareholders. As a result of the intended repayment of the JPMorgan Debt and the fact that our wholly-owned subsidiary, First Southwest Company, is participating as a broker-dealer in this offering, the offering is being conducted in accordance with certain conflict of interest rules, as described in “Conflicts of interest”.
The approval of the Federal Reserve Board is required for the repurchase of the Series A and Series B Preferred Stock. We do not know when, or if, we will receive such approval. If we do not receive the necessary regulatory approval to repurchase the Series A and Series B Preferred Stock, or our board of directors subsequently determines not to repurchase the Series A and Series B Preferred Stock, then we intend to use approximately $20 million of the net proceeds of the offering to repay the JPMorgan Debt and to use the remaining net proceeds to support and enhance operations.
29
Table of Contents
Index to Financial Statements
Subject to the restrictions discussed below, our shareholders are entitled to receive dividends when, as, and if declared by our board of directors out of funds legally available for that purpose. For each quarter in 2007, we paid a cash dividend of $0.047 per share. For each of the last seven completed quarters, we have paid a cash dividend of $0.05 per share. Our board of directors exercises discretion with respect to whether we will pay dividends and the amount of such dividend, if any. Factors that affect our ability to pay dividends on our Common Stock in the future include, without limitation, our earnings and financial condition, liquidity and capital resources, the general economic and regulatory climate, our ability to service any equity or debt obligations senior to our Common Stock and other factors deemed relevant by our board of directors.
Under the terms of the Series A and Series B Preferred Stock issued to the U.S. Treasury pursuant to the TARP Capital Purchase Program, we are obligated to pay a 5% per annum cumulative dividend on the stated value of the Series A Preferred Stock until February 15, 2014 and thereafter at a rate of 9% per annum. We are obligated to pay a 9% per annum cumulative dividend on the stated value of the Series B Preferred Stock. As long as shares of the Series A and Series B Preferred Stock remain outstanding, we may not pay dividends to our common shareholders unless all accrued and unpaid dividends on the preferred stock have been paid in full. Furthermore, prior to December 19, 2011, unless we have redeemed all of the Series A and Series B Preferred Stock, the consent of the U.S. Treasury will be required to, among other things, increase the amount of our regular quarterly dividends paid on our Common Stock. After December 19, 2011 and until December 19, 2018, the consent of the U.S. Treasury (if it still holds our preferred stock) will be required for any increase in the aggregate Common Stock dividends per share greater than 3% per annum. After December 19, 2018, we will be prohibited from paying dividends on our Common Stock until the preferred stock issued to the U.S. Treasury is redeemed in whole or the U.S. Treasury has transferred all of its preferred stock to third parties.
As a holding company, we are ultimately dependent upon our subsidiaries to provide funding for our operating expenses, debt service and dividends. Various banking laws limit the payment of dividends and other distributions by the Bank to us, and may therefore limit our ability to pay dividends on our Common Stock. If required payments on our outstanding junior subordinated debentures held by our unconsolidated subsidiary trusts are not made or suspended, we may be prohibited from paying dividends on our Common Stock. Regulatory authorities could impose administratively stricter limitations on the ability of the Bank to pay dividends to us if such limits were deemed appropriate to preserve certain capital adequacy requirements.
30
Table of Contents
Index to Financial Statements
The following table sets forth our unaudited consolidated capitalization as of September 30, 2009:
| • | on an actual basis; and |
| • | on an adjusted basis to give effect to the issuance and sale by us of 10,287,899 shares of Common Stock in this offering at an assumed offering price of $15.00 per share (the midpoint of the estimated public offering price set forth on the cover of this prospectus), less underwriting discounts and commissions and offering expenses, and the application of the net proceeds therefrom as if it had occurred as of September 30, 2009. |
You should read the following table in conjunction with “Use of proceeds,” “Selected historical financial data,” “Management’s discussion and analysis of financial condition and results of operations” and our audited and unaudited consolidated financial statements and related notes included elsewhere in this prospectus.
| As of September 30, 2009 | ||||||
| (dollars in thousands) | Actual | As Adjusted for the Offering |
||||
| Long-term Indebtedness:(1) |
||||||
| Subordinated note with JP Morgan Chase due October 27, 2015 |
$ 20,000 | $ 20,000 | ||||
| Junior subordinated debentures due July 31, 2031 |
18,042 | 18,042 | ||||
| Junior subordinated debentures due March 26, 2033 |
18,042 | 18,042 | ||||
| Junior subordinated debentures due September 17, 2033 |
15,464 | 15,464 | ||||
| Junior subordinated debentures due February 22, 2038 |
15,464 | 15,464 | ||||
| Other long-term debt |
4,000 | 4,000 | ||||
| Total long-term indebtedness(2) |
91,012 | 91,012 | ||||
| PlainsCapital Corporation shareholders' equity |
||||||
| Preferred stock, $1 par value per share, authorized 50,000,000 shares;(3) |
||||||
| Series A, 87,631 shares issued, actual and as adjusted |
83,382 | 83,382 | ||||
| Series B, 4,382 shares issued, actual and as adjusted |
4,827 | 4,827 | ||||
| Original Common Stock, $0.001 value per share, authorized 50,000,000 shares, 31,588,383 shares issued, actual, 27,404,282 shares issued, as adjusted(4) |
32 | 27 | ||||
| Common stock, $0.001 par value per share, authorized 150,000,000 shares, 0 shares issued, actual, 15,000,000 shares issued, as adjusted |
— | 15 | ||||
| Surplus |
150,213 | 292,164 | ||||
| Retained earnings(5) |
194,255 | 188,955 | ||||
| Accumulated other comprehensive income |
1,848 | 1,848 | ||||
| 434,557 | 571,218 | |||||
| Unearned ESOP shares (320,712 shares) |
(3,489 | ) | (3,489 | ) | ||
| Total PlainsCapital Corporation shareholders' equity |
431,068 | 567,729 | ||||
| Total capitalization |
$ 522,080 | $ 658,741 | ||||
| Capital amounts: |
||||||
| Tier 1 capital |
$ 443,030 | $ 579,691 | ||||
| Total capital |
502,829 | 639,490 | ||||
| Average assets |
4,437,159 | 4,437,159 | ||||
| Risk-weighted assets(6) |
3,705,864 | 3,705,864 | ||||
| Capital ratios: |
||||||
| Leverage ratio |
10.0% | 13.1% | ||||
| Tier 1 capital (to risk-weighted assets)(7) |
12.0% | 15.6% | ||||
| Total capital (to risk-weighted assets)(7) |
13.6% | 17.3% | ||||
| Tangible common equity to tangible assets(8) |
6.3% | 9.0% | ||||
| (1) | Excludes FHLB advances and other borrowings that are considered short-term debt including a revolving line of credit of approximately $20 million with JPM that is expected to be repaid from the proceeds from the offering. |
| (2) | Total long-term indebtedness includes the aggregate outstanding balance owed to the capital trusts before subtracting the related common stock amount of $2.012 million. |
| (3) | Does not give effect to the contemplated redemption of our Series A and Series B Preferred Stock from the proceeds of this offering, which requires the approval of the Federal Reserve Board. |
31
Table of Contents
Index to Financial Statements
| (4) | The number of shares issued of Original Common Stock excludes 1,697,430 shares reserved pursuant to the earnout provisions of the Merger Agreement. |
| (5) | Retained earnings has been adjusted for additional expense of $5.3 million related to the accelerated vesting of the restricted stock units. |
| (6) | Net proceeds are assumed to be held in cash and cash equivalents. |
| (7) | These ratios are described in “Business—Government supervision and regulation—PlainsCapital Corporation—Capital adequacy requirements”. |
| (8) | See “Selected historical financial information—GAAP reconciliation and management explanation of non-GAAP financial measure.” |
32
Table of Contents
Index to Financial Statements
Selected historical financial data
The following table sets forth our selected historical consolidated financial information for each of the periods indicated (in thousands, except share and per share data). The historical information as of and for the years ended December 31, 2004 through 2008 has been derived from our audited consolidated financial statements for the years ended December 31, 2004 through 2008, and our historical information for the nine months ended September 30, 2009 and 2008 has been derived from our unaudited financial statements for the nine months ended September 30, 2009 and 2008. The historical results set forth below and elsewhere in this prospectus are not necessarily indicative of our future performance.
The following selected historical financial is only a summary and should be read in conjunction with “Use of proceeds,” “Capitalization,” “Management’s discussion and analysis of financial condition and results of operations,” “Certain relationships and related party transactions” and our audited and unaudited financial statements and related notes included elsewhere in this prospectus. The operating results and financial condition of First Southwest are included in the tables below as of January 1, 2009 and December 31, 2008, respectively.
| As of and for the Nine Months Ended September 30, |
As of and for the Years Ended December 31, | |||||||||||||
| 2009 | 2008 | 2008 | 2007 | 2006 | 2005 | 2004 | ||||||||
| Income Statement Data: |
||||||||||||||
| Total interest income |
$149,946 | $146,923 | $193,392 | $220,895 | $192,812 | $148,636 | $108,373 | |||||||
| Total interest expense |
31,992 | 52,167 | 66,069 | 104,805 | 86,973 | 58,307 | 27,513 | |||||||
| Net interest income |
117,954 | 94,756 | 127,323 | 116,090 | 105,839 | 90,329 | 80,860 | |||||||
| Provision for loan losses |
39,073 | 7,818 | 22,818 | 5,517 | 5,049 | 5,516 | 2,604 | |||||||
| Net interest income after provision for loan losses |
78,881 | 86,938 | 104,505 | 110,573 | 100,790 | 84,813 | 78,256 | |||||||
| Total noninterest income |
248,420 | 86,709 | 119,066 | 84,281 | 101,776 | 110,027 | 109,882 | |||||||
| Total noninterest expense |
271,435 | 135,702 | 186,722 | 151,358 | 163,203 | 163,708 | 157,161 | |||||||
| Income from continuing operations before income taxes |
55,866 | 37,945 | 36,849 | 43,496 | 39,363 | 31,132 | 30,977 | |||||||
| Federal income tax provision |
19,991 | 13,448 | 12,725 | 14,904 | 13,624 | 12,612 | 11,043 | |||||||
| Income from continuing operations |
35,875 | 24,497 | 24,124 | 28,592 | 25,739 | 18,520 | 19,934 | |||||||
| Income from discontinued Amarillo operations (net-of-tax) |
— | — | — | — | — | 11,536 | 1,161 | |||||||
| Net income |
35,875 | 24,497 | 24,124 | 28,592 | 25,739 | 30,056 | 21,095 | |||||||
| Less: Net income attributable to noncontrolling interest |
126 | 234 | — | — | — | — | — | |||||||
| Net income attributable to PlainsCapital Corporation |
35,749 | 24,263 | 24,124 | 28,592 | 25,739 | 30,056 | 21,095 | |||||||
| Dividends on preferred stock and other |
4,319 | — | — | — | — | — | — | |||||||
| Income applicable to PlainsCapital Corporation common shareholders |
$31,430 | $24,263 | $24,124 | $28,592 | $25,739 | $30,056 | $21,095 | |||||||
| Per Share Data: |
||||||||||||||
| Income from continuing operations—basic |
$1.01 | $0.93 | $0.92 | $1.10 | $1.00 | $0.73 | $0.94 | |||||||
| Discontinued operations—basic |
— | — | — | — | — | $0.45 | $0.06 | |||||||
| Net income—basic |
$1.01 | $0.93 | $0.92 | $1.10 | $1.00 | $1.18 | $1.00 | |||||||
| Weighted average shares outstanding—basic |
31,255,362 | 26,101,797 | 26,117,934 | 26,012,250 | 25,785,612 | 25,552,734 | 21,185,286 | |||||||
| Income from continuing operations—diluted |
$0.95 | $0.92 | $0.92 | $1.09 | $0.99 | $0.71 | $0.93 | |||||||
| Discontinued operations—diluted |
— | — | — | — | — | $0.45 | $0.05 | |||||||
| Net income—diluted |
$0.95 | $0.92 | $0.92 | $1.09 | $0.99 | $1.16 | $0.98 | |||||||
| Weighted average shares outstanding—diluted |
33,141,824 | 26,245,619 | 26,256,165 | 26,195,211 | 26,030,505 | 25,874,433 | 21,463,983 | |||||||
| Book value per common share |
$10.97 | $9.71 | $9.99 | $8.97 | $8.06 | $7.26 | $7.52 | |||||||
| Tangible book value per common share |
$9.30 | $8.31 | $8.82 | $7.54 | $6.63 | $5.81 | $5.68 | |||||||
33
Table of Contents
Index to Financial Statements
Summary consolidated financial data
PlainsCapital Corporation
| As of and for the Nine Months Ended September 30, |
As of and for the Years Ended December 31, |
||||||||||||||||||||
| 2009 | 2008 | 2008 | 2007 | 2006 | 2005 | 2004 | |||||||||||||||
| Balance Sheet Data(1): |
|||||||||||||||||||||
| Total assets |
$4,676,303 | $3,367,099 | $3,951,996 | $3,182,863 | $2,880,697 | $2,690,305 | $2,426,040 | ||||||||||||||
| Loans held for sale |
428,341 | 145,681 | 198,866 | 100,015 | 126,839 | 194,712 | 181,134 | ||||||||||||||
| Investment securities |
479,615 | 208,859 | 385,327 | 191,175 | 187,225 | 177,379 | 196,617 | ||||||||||||||
| Loans, net of unearned income |
3,052,348 | 2,696,345 | 2,965,619 | 2,597,362 | 2,203,019 | 1,956,066 | 1,648,243 | ||||||||||||||
| Allowance for loan losses |
(39,799 | ) | (26,404 | ) | (40,672 | ) | (26,517 | ) | (24,722 | ) | (22,666 | ) | (22,086 | ) | |||||||
| Goodwill and intangible assets, net |
52,101 | 36,586 | 36,568 | 37,307 | 37,136 | 37,362 | 38,977 | ||||||||||||||
| Total deposits |
3,249,772 | 2,328,789 | 2,926,099 | 2,393,354 | 2,496,050 | 2,321,109 | 1,929,898 | ||||||||||||||
| Capital lease obligations |
8,441 | 8,719 | 8,651 | 3,994 | 4,148 | 72 | 143 | ||||||||||||||
| Notes payable |
70,691 | 52,425 | 151,014 | 40,256 | 35,860 | 46,460 | 55,500 | ||||||||||||||
| Junior subordinated debentures |
67,012 | 67,012 | 67,012 | 51,548 | 51,548 | 51,548 | 50,000 | ||||||||||||||
| PlainsCapital Corporation shareholders’ equity |
431,068 | 253,407 | 399,815 | 233,890 | 209,332 | 186,431 | 159,178 | ||||||||||||||
| Performance Ratios*: |
|||||||||||||||||||||
| Return on average equity |
11.56% | 13.31% | 7.61% | 12.98% | 13.20% | 17.42% | 14.13% | ||||||||||||||
| Return on average assets |
1.11% | 0.99% | 0.68% | 0.95% | 0.95% | 1.19% | 0.95% | ||||||||||||||
| Net interest margin (taxable equivalent)(2) |
4.02% | 4.20% | 4.17% | 4.27% | 4.36% | 3.96% | 4.22% | ||||||||||||||
| Efficiency ratio(3) |
74.09% | 74.78% | 75.93% | 75.40% | 78.20% | 81.19% | 81.64% | ||||||||||||||
| Asset Quality Ratios: |
|||||||||||||||||||||
| Total nonperforming assets to total loans and other real estate |
2.49% | 2.32% | 2.03% | 0.96% | 0.75% | 1.09% | 0.80% | ||||||||||||||
| Allowance for loan losses to nonperforming loans |
63.63% | 60.21% | 86.87% | 153.81% | 226.79% | 119.43% | 636.67% | ||||||||||||||
| Allowance for loan losses to total loans |
1.30% | 0.98% | 1.37% | 1.02% | 1.12% | 1.16% | 1.34% | ||||||||||||||
| Net charge-offs to average loans* |
1.19% | 0.28% | 0.37% | 0.15% | 0.14% | 0.24% | 0.12% | ||||||||||||||
| Capital Ratios: |
|||||||||||||||||||||
| Leverage ratio |
9.98% | 8.81% | 12.70% | 8.06% | 8.22% | 7.92% | 7.12% | ||||||||||||||
| Tier 1 risk-based capital ratio |
11.95% | 9.73% | 12.83% | 8.99% | 9.27% | 9.24% | 8.22% | ||||||||||||||
| Total risk-based capital ratio |
13.57% | 11.32% | 14.53% | 10.67% | 10.91% | 10.97% | 10.01% | ||||||||||||||
| Equity to assets ratio |
9.22% | 7.53% | 10.12% | 7.35% | 7.27% | 6.93% | 6.56% | ||||||||||||||
| Dividend payout ratio(4) |
14.19% | 16.37% | 22.02% | 17.26% | 19.06% | 15.33% | 16.82% | ||||||||||||||
| Tangible common equity to tangible assets |
6.29% | 6.51% | 7.04% | 6.25% | 6.06% | 5.62% | 5.04% | ||||||||||||||
| * | Annualized for interim periods. |
| (1) | Balance sheet includes First Southwest as of December 31, 2008. |
| (2) | Net interest income (taxable equivalent) divided by average interest-earning assets. |
| (3) | Noninterest expense divided by the sum of total noninterest income and net interest income for the period. |
| (4) | Total dividends paid divided by net income attributable to PlainsCapital Corporation for the period. |
We adopted SFAS 160, Noncontrolling Interest in Consolidated Financial Statements, an Amendment of ARB Statement No. 5, on January 1, 2009. Noncontrolling interests reported in the table above for periods prior to the adoption of SFAS 160 have not been retrospectively adjusted to conform to the provisions of SFAS 160 due to the immateriality of those adjustments.
GAAP reconciliation and management explanation of non-GAAP financial measure
One of the measures in our summary historical consolidated financial information, “tangible book value per common share,” is not a measure of financial performance recognized by GAAP.
“Tangible book value per common share” is defined as our total shareholders’ equity, excluding preferred stock, reduced by goodwill and other intangible assets, divided by total common shares outstanding. “Tangible common shareholders’ equity to tangible assets” is defined as our total
34
Table of Contents
Index to Financial Statements
shareholders’ equity, excluding preferred stock, reduced by goodwill and other intangible assets divided by total assets reduced by goodwill and other intangible assets. These measures are important to investors interested in changes from period to period in tangible equity per share exclusive of changes in intangible assets. For companies such as ours that have engaged in business combinations, purchase accounting can result in the recording of significant amounts of goodwill and other intangible assets related to those transactions.
You should not view this disclosure as a substitute for results determined in accordance with GAAP, and it is not necessarily comparable to non-GAAP measures used by other companies. The following table reconciles these non-GAAP financial measures to the most comparable GAAP financial measures, “book value per common share”, total common shareholders’ equity and total assets.
| As of September 30, | As of December 31, | |||||||||||||||||||||||||||
| 2009 | 2008 | 2008 | 2007 | 2006 | 2005 | 2004 | ||||||||||||||||||||||
| Book value per common share |
$ | 10.97 | $ | 9.71 | $ | 9.99 | $ | 8.97 | $ | 8.06 | $ | 7.26 | $ | 7.52 | ||||||||||||||
| Effect of goodwill and intangible assets per share |
$ | (1.67 | ) | $ | (1.40 | ) | $ | (1.17 | ) | $ | (1.43 | ) | $ | (1.43 | ) | $ | (1.45 | ) | $ | (1.84 | ) | |||||||
| Tangible book value per common share |
$ | 9.30 | $ | 8.31 | $ | 8.82 | $ | 7.54 | $ | 6.63 | $ | 5.81 | $ | 5.68 | ||||||||||||||
| PlainsCapital Corporation common shareholders’ equity |
$ | 431,068 | $ | 253,407 | $ | 399,815 | $ | 233,890 | $ | 209,332 | $ | 186,431 | $ | 159,178 | ||||||||||||||
| Less: Preferred Stock |
88,209 | — | 87,631 | — | — | — | — | |||||||||||||||||||||
| Less: goodwill and intangible assets, net |
52,101 | 36,586 | 36,568 | 37,307 | 37,136 | 37,362 | 38,977 | |||||||||||||||||||||
| Tangible common equity |
290,758 | 216,821 | 275,616 | 196,583 | 172,196 | 149,069 | 120,201 | |||||||||||||||||||||
| Total assets |
4,676,303 | 3,367,099 | 3,951,996 | 3,182,863 | 2,880,697 | 2,690,305 | 2,426,040 | |||||||||||||||||||||
| Less: goodwill and intangible assets, net |
52,101 | 36,586 | 36,568 | 37,307 | 37,136 | 37,362 | 38,977 | |||||||||||||||||||||
| Tangible assets |
4,624,202 | 3,330,513 | 3,915,428 | 3,145,556 | 2,843,561 | 2,652,943 | 2,387,063 | |||||||||||||||||||||
| Tangible common equity to tangible assets |
6.29% | 6.51% | 7.04% | 6.25% | 6.06% | 5.62% | 5.04% | |||||||||||||||||||||
35
Table of Contents
Index to Financial Statements
Management’s discussion and analysis of financial condition and results of operations
The following discussion and analysis of our financial condition and results of operations should be read in conjunction with our consolidated financial statements and the notes to those statements included elsewhere in this prospectus. The following discussion and analysis contains forward-looking statements that are based on our current expectations and involve risks and uncertainties. Generally, verbs in the future tense and the words “believe,” “expect,” “anticipate,” “intends,” “opinion,” “potential” and similar terms and expressions identify forward-looking statements. We make forward-looking statements regarding topics including, without limitation, our projected sources of funds, anticipated changes in our revenues or earnings, expected effects of accounting pronouncements, our use of proceeds, expectations regarding financial or other market conditions, government regulation applicable to our operations, litigation, the availability of acquisition and growth opportunities, our ability to repurchase preferred shares from the U.S. Treasury issued in connection with the TARP Capital Purchase Program, the adequacy of our allowance for loan losses and provision for loan losses and our ability to capitalize on synergistic opportunities as a result of our acquisition of First Southwest. Actual results and the timing of events may differ materially from those described in these forward-looking statements due to a number of factors, including those discussed in the section entitled “Risk factors” and elsewhere in this prospectus. See also the section entitled “Forward-looking statements”. These risks and uncertainties should be considered in evaluating these forward-looking statements and undue reliance should not be placed on these statements. The forward-looking statements contained herein speak only as of the date of this prospectus, and, except as may be required by applicable law and regulation, we do not undertake, and specifically disclaim any obligation, to publicly update or revise such statements to reflect events or circumstances after the date of such statements or to reflect the occurrence of anticipated or unanticipated events.
Overview
We are a Texas corporation and a financial holding company registered under the Bank Holding Company Act, as amended by the Gramm-Leach-Bliley Act. As of September 30, 2009, on a consolidated basis, we had total assets of approximately $4.7 billion, total deposits of $3.2 billion, total loans, including loans held for sale, of approximately $3.5 billion and shareholders’ equity of approximately $431.1 million. The Bank, one of our wholly-owned subsidiaries, provides a broad array of products and services, including commercial banking, personal banking, wealth and investment management, and treasury management, from offices located throughout central, north and west Texas. In addition to the Bank, we have various subsidiaries with specialized areas of expertise that also offer an array of products and services such as mortgage origination and financial advisory services. On December 31, 2008, we expanded our financial advisory segment when we acquired First Southwest. This acquisition was accounted for as a purchase transaction, and as such, First Southwest’s results of operations are not included in our consolidated financial statements for the year ended December 31, 2008 but are included in our consolidated financial statements for the nine months ended September 30, 2009. See Note 2 in the accompanying notes to our consolidated financial statements for the nine months ended September 30, 2009 and for the years ended December 31, 2008, 2007 and 2006 included elsewhere in this prospectus.
36
Table of Contents
Index to Financial Statements
We have experienced significant balance sheet growth since our inception. During the nine-month period ending September 30, 2009, our assets increased by 18.3%, driven by growth in loans of 10.0%. The growth in assets, particularly loans held for sale, during the first nine months of 2009 was primarily driven by a sharp increase in originations from our mortgage origination business. We temporarily hold these mortgage loans for sale on our balance sheet. During the nine-month period ended September 30, 2009, our deposits increased by 11.1%.
We generate revenue from net interest income and from noninterest income. Net interest income is the difference between interest income we earn on loans and securities and interest expense we incur on deposits and borrowings. Net interest income is a significant contributor to revenues and net income. Fluctuations in interest rates, as well as the amounts and types of interest earning assets and interest bearing liabilities we hold, affect net interest income. During the first nine months of 2009, we generated $118.0 million in net interest income, a 24.5% increase over the nine-month period ending September 30, 2008. The increase in net interest income was primarily due to the growth in the principal amount of securities and loans that we own. Net interest margin is a measure of annualized net interest income as a percentage of interest earning assets, which is comprised primarily of loans and securities we own. Our taxable equivalent net interest margin was 4.02% for the nine months ended September 30, 2009 versus 4.20% for the nine months ended September 30, 2008. The decrease in net interest margin was primarily due to decreases in interest rates and changes in the composition of, and yield on, our investment portfolio due to the purchase of the auction rate bonds we acquired in connection with the acquisition of First Southwest.
The contribution of noninterest income to revenue has increased significantly since we expanded our product and service offerings starting with our 1998 acquisition of a Lubbock-based mortgage company. Our noninterest income is primarily comprised of three components:
| (i) | Income from mortgage loan origination and net gains from sale of loans. Through our wholly-owned subsidiary, PrimeLending, we generate noninterest income by originating and selling mortgage loans. During the first nine months of 2009, we generated $164.1 million in income from loan origination and net gains from sale of loans, a 142.3% increase over the nine-month period ending September 30, 2008. This significant increase in income was primarily due to a favorable interest rate environment for mortgage refinancing in the first half of 2009, as well as an increase in the volume of mortgage originations for home purchases that began in the third quarter of 2009. |
| (ii) | Investment advisory fees and commissions and securities brokerage fees and commissions. Through our wholly owned subsidiary First Southwest, we provide public finance advisory and various investment banking and brokerage services. We earned $68.5 million and $4.8 million in investment advisory fees and commissions and securities brokerage fees and commissions during the nine months ended September 30, 2009 and September 30, 2008, respectively. This significant increase in income was due to our acquisition of First Southwest on December 31, 2008. |
| (iii) | Service charges on depositor accounts. We generate fees associated with offering depository services to our banking customers. We earned $6.7 million and $7.1 million in service charges on depositor accounts during the nine months ended September 30, 2009 and September 30, 2008, respectively. |
In the aggregate, we generated $248.4 million and $86.7 million in noninterest income during the nine months ended September 30, 2009 and September 30, 2008, respectively. The
37
Table of Contents
Index to Financial Statements
contribution of noninterest income to net revenues was approximately 67.8% during the first nine months of 2009 versus 47.8% during the first nine months of 2008. The increase in noninterest income was primarily due to the favorable interest rate environment for mortgage refinancing during 2009 and the addition of the operations from First Southwest in 2009.
Offsetting our revenues are noninterest expenses we incur through the operations of our businesses. Our businesses engage in labor intensive activities and, consequently, employees’ compensation and benefits represent the majority of our noninterest expenses. Provision for loan losses and income taxes also decrease our net income.
Acquisitions
Acquisitions of financial services companies have historically been a significant part of our historical growth strategy and may potentially be a source of future growth of our company. The acquisitions we have completed have enabled us to diversify our revenue streams and achieve significant growth.
On December 31, 2008, we acquired First Southwest, a diversified private investment banking corporation. We believe the acquisition of First Southwest provides us with increased ability to generate noninterest income, diversify our revenue stream, and provide synergetic opportunities with our other businesses.
Stock-based compensation expense in connection with this offering
In connection with this offering, the vesting of restricted stock awards of an aggregate of 528,000 shares of our Original Common Stock granted to certain of our employees, including Messrs. Custard, Feinberg, Isom, Schaffner and White, will be accelerated upon the listing of our Common Stock on the NYSE. As a result of this acceleration, we expect to recognize additional compensation expense of approximately $5.3 million at the date on which the Common Stock sold as a part of this offering is listed on the NYSE.
Recent government actions
In response to the challenges facing the financial services sector, several regulatory and governmental actions have recently been announced including:
| • | The EESA, approved by Congress and signed by President Bush on October 3, 2008, which, among other provisions, allowed the U.S. Treasury to purchase troubled assets from banks, authorized the SEC to suspend the application of mark-to-market accounting, and temporarily raised the basic limit of FDIC deposit insurance from $100,000 to $250,000; subsequent legislation extends the temporary $250,000 limit through December 31, 2013 and mandates a return to the $100,000 limit on January 1, 2014. |
| • | On October 7, 2008, the FDIC approved a plan to increase the rates banks pay for deposit insurance. |
| • | On October 14, 2008, the U.S. Treasury announced the creation of a new program, the TARP Capital Purchase Program, which allows financial institutions to build capital through the sale of senior preferred shares and warrants to the U.S. Treasury on terms that are non-negotiable. |
38
Table of Contents
Index to Financial Statements
| • | On October 14, 2008, the FDIC announced the creation of the TLGP, which seeks to strengthen confidence and encourage liquidity in the banking system. The TLGP has two primary components that are available on a voluntary basis to financial institutions: |
| • | Guarantee of newly-issued senior unsecured debt; the guarantee applies to new debt issued on or before June 30, 2009 and provides protection until June 30, 2012; issuers electing to participate pay a 75 basis point fee for the guarantee; and |
| • | Unlimited deposit insurance for non-interest bearing deposit transaction accounts; financial institutions electing to participate will pay a 10 basis point premium in addition to the insurance premiums paid for standard deposit insurance. |
| • | On February 17, 2009, the ARRA was enacted as a sweeping economic recovery package intended to stimulate the U.S. economy and provide for extensive infrastructure, energy, health and education needs. The ARRA also imposes certain new executive compensation and corporate governance obligations on all current and future TARP Capital Purchase Program participants until the institution has redeemed the preferred stock, which participants are now permitted to do under the ARRA without regard to the three year holding period and without the need to raise new capital, subject to approval of its primary federal regulator. |
| • | On June 15, 2009, the U.S. Treasury adopted and made effective an Interim Rule, which implemented and further expanded the limitations and restrictions imposed on executive compensation and corporate governance by the TARP Capital Purchase Program and EESA, as amended by the ARRA. Pursuant to the Interim Rule, the U.S. Treasury established the Office of the Special Master for TARP Executive Compensation with the broad power to review the compensation structures and payments of, and to independently issue advisory opinions to, those banks that have participated in the TARP Capital Purchase Program with respect to compensation structures and payments made by those banks during the period that the bank received financial assistance under TARP. If the Special Master finds that a TARP recipient’s compensation structure or payments that it has made to its employees are inconsistent with the purposes of the EESA or TARP, or otherwise contrary to the public interest, the Special Master may negotiate with the TARP recipient and the subject employee for appropriate reimbursements to the TARP recipient or the federal government. |
| • | On June 17, 2009, President Barack Obama laid out a comprehensive regulatory reform plan aiming to modernize and protect the integrity of the U.S. financial system. Among other things, President Obama’s plan contemplates increased supervision and higher capital requirements for financial institutions. We cannot predict whether or in what form any proposed regulation or statute will be adopted or the extent to which our business may be affected by any new regulation or statute. |
| • | On August 26, 2009, the Board of Directors of the FDIC extended the TAGP through June 30, 2010. As a part of this increase, the FDIC increased the assessment rate for the period from January 1, 2010 through June 30, 2010 to either 15 basis points, 20 basis points or 25 basis points, depending upon the risk category assigned to the institution under the FDIC’s risk-based premium system. Any institution currently participating in the original TAGP that wishes to opt-out of the TAGP extension through June 30, 2010 must submit its opt-out election to the FDIC on or before November 2, 2009. |
| • | On September 29, 2009, the Board of Directors of the FDIC adopted a Notice of Proposed Rulemaking that would require FDIC-insured institutions, such as the Bank, to prepay on |
39
Table of Contents
Index to Financial Statements
| December 30, 2009 their estimated quarterly risk-based assessments for the fourth quarter of 2009 and for all of 2010, 2011 and 2012. In addition, the FDIC voted to adopt a uniform three-basis point increase in assessment rates effective on January 1, 2011, which increase would be reflected in our prepaid assessments. |
On December 19, 2008, we sold shares of our Series A and Series B Preferred Stock to the U.S. Treasury for approximately $87.6 million pursuant to the TARP Capital Purchase Program. As a participant in the TARP Capital Purchase Program, we will be subject to executive compensation limits and other restrictions until the redemption of our Series A and Series B Preferred Stock, which, subject to regulatory approval, we intend to redeem with the proceeds of this offering.
We elected to participate in the TLGP’s enhanced deposit insurance program and paid an additional premium related to our participation in the TLGP of $66,000 on September 30, 2009. As a result of the enhancements to deposit insurance protection and demands on the FDIC’s deposit insurance fund, we expect our deposit insurance costs to increase significantly during 2009 to approximately $6.3 million, including a special assessment, from approximately $1.6 million during the year ended December 31, 2008.
The Bank participates in the original TAGP and does not intend to opt out of the extension through June 30, 2010. The FDIC will notify the Bank concerning an assessment rate that we will be charged for the extension period.
We expect that we may be required to prepay an estimated $14 million on December 30, 2009 for our 2009 fourth quarter and all of our 2010, 2011 and 2012 FDIC assessments. Our prepaid assessments would be subject to adjustment based upon our assessment base during the prepaid period.
Although it is possible that further regulatory actions will arise as the federal government attempts to address the economic situation, we are not aware of any further recommendations by regulatory authorities that, if implemented, would have or would be reasonably likely to have a material effect on our liquidity, capital ratios or results of operations.
Segment and related information
We have three reportable segments that are organized primarily by the core products offered to the segments’ respective customers. The banking segment includes the operations of the Bank and PlainsCapital Leasing, LLC, a wholly owned subsidiary of the Bank that provides equipment lease financing services. The operations of PrimeLending comprise the mortgage origination segment. The financial advisory segment is comprised of Hester Capital Management, L.L.C. (“Hester Capital”) and, as of the December 31, 2008 acquisition date, First Southwest. The principal subsidiaries of First Southwest are First Southwest Company, a broker-dealer registered with the SEC and FINRA, First Southwest Asset Management, Inc., a registered investment advisor under the Investment Advisors Act of 1940, and First Southwest Leasing Company.
During the third quarter of 2009, we changed our segment reporting. We describe this change in Note 18 to our consolidated interim financial statements for the three and nine months ended September 30, 2009. We did not restate our annual financial information for the periods ended December 31, 2008, 2007 and 2006 because the information for these periods is presented on the basis that management used to manage our business during these periods.
40
Table of Contents
Index to Financial Statements
How we generate revenue and net income
We are substantially dependent on our banking segment for revenue, which provides primarily business banking and personal banking products and services. During 2008 and the first nine months of 2009, approximately 59.9% and 35.0%, respectively, of our net revenue was derived from the banking segment. The banking segment generates revenue from earning assets, and its results of operations are primarily dependent on, net interest income. Net interest income represents the difference between the income earned on the banking segment’s assets, including its loans and investment securities, and the banking segment’s cost of funds, including the interest paid by the banking segment on its deposits and borrowings that are used to support the banking segment’s assets. The banking segment also derives revenue from other sources, primarily service charges on customer deposit accounts and trust fees.
Our mortgage origination segment’s operations have historically represented our second largest source of net revenue. During 2008 and the first nine months of 2009, the mortgage origination segment generated approximately 37.7% and 44.3%, respectively, of our net revenue. The mortgage origination segment offers a variety of loan products from offices in 32 states, and generates revenue primarily from fees charged on the origination of loans and from selling these loans in the secondary market. We generate the remainder of our revenue primarily from our financial advisory services. While the financial advisory segment contributed only 2.4% to net revenue for the year ended 2008, it did not include First Southwest, whose operations have been included in the financial advisory segment beginning as of January 1, 2009. The financial advisory segment contributed 20.7% to total net revenue for the first nine months of 2009.
The fluctuations in the share of total net revenue provided by our various segments for the nine months ended September 30, 2009 compared with the year ended December 31, 2008 generally reflect substantial revenue growth in the mortgage origination segment primarily as a result of the favorable interest rate environment for mortgage refinancings in the first half of 2009, as well as an increase in the volume of mortgage originations for home purchases that began in the third quarter of 2009, and in the financial advisory segment as a result of the acquisition of First Southwest, the operations of which were reflected in our operating results beginning January 1, 2009. We describe the operating results of each of our segments more fully in the sections that follow.
Our noninterest expense includes salary and employee benefits, occupancy, professional services, and other expense. Our results of operations are also affected by the provisions for loan losses and income taxes.
Three and nine months ended September 30, 2009 and 2008
Operating results
Consolidated net income for the third quarter in 2009 was $9.7 million, or $0.25 per diluted share, compared with $8.1 million, or $0.31 per diluted share, for the third quarter in 2008. We had net income of $35.7 million, or $0.95 per diluted share, for the nine months ended September 30, 2009, compared with $24.3 million, or $0.92 per diluted share, for the nine months ended September 30, 2008.
41
Table of Contents
Index to Financial Statements
We consider the ratios shown in the table below to be key indicators of our performance.
| Nine months ended September 30, 2009 |
Year ended December 31, 2008 |
Nine months ended 2008 |
|||||
| Return on average shareholders’ equity |
11.56% | 7.61% | 13.31% | ||||
| Return on average assets |
1.11% | 0.68% | 0.99% | ||||
| Net interest margin (taxable equivalent) |
4.02% | 4.17% | 4.20% | ||||
| Leverage ratio |
9.98% | 12.70% | 8.81% | ||||
| Efficiency ratio |
74.09% | 75.93% | 74.78% | ||||
The return on average shareholders’ equity ratio is calculated by dividing net income by average shareholders’ equity for the period. The return on average assets ratio is calculated by dividing net income by average total assets for the period. Net interest margin is calculated by dividing net interest income (taxable equivalent) by average interest-earning assets. The calculations for these ratios in interim periods are annualized. The leverage ratio is discussed in “—Liquidity and capital resources” section below. The efficiency ratio is calculated by dividing noninterest expenses by the sum of total noninterest income and net interest income for the period. The efficiency ratio is generally considered a measure of how well we utilize our resources and manage our expenses.
The changes in our earnings during the periods described above are primarily attributable to the factors listed below (in millions).
| Earnings increase (decrease) | Earnings increase (decrease) | |||||||
| Three months ended 2009 v. 2008 |
Nine months ended 2009 v. 2008 |
|||||||
| Net interest income |
$ | 9.1 | $ | 23.2 | ||||
| Provision for loan loss |
(11.7 | ) | (31.3 | ) | ||||
| Income from loan origination and net gains from sale of loans |
27.3 | 96.4 | ||||||
| Investment advisory and brokerage fees and commissions |
24.4 | 63.7 | ||||||
| Noninterest expense |
(49.8 | ) | (135.7 | ) | ||||
| All other (including tax effects) |
2.3 | (4.8 | ) | |||||
| $ | 1.6 | $ | 11.4 | |||||
42
Table of Contents
Index to Financial Statements
Net interest income
The following table summarizes the components of net interest income (in thousands):
| Three months ended September 30, |
Nine months ended September 30, |
|||||||||||||||||||
| Variance | Variance | |||||||||||||||||||
| 2009 | 2008 | 2009 v. 2008 | 2009 | 2008 | 2009 v. 2008 | |||||||||||||||
| Interest income |
||||||||||||||||||||
| Loans, including fees |
$ | 46,235 | $ | 44,057 | $ | 2,178 | $ | 133,698 | $ | 139,051 | $ | (5,353 | ) | |||||||
| Securities |
3,679 | 2,281 | 1,398 | 11,881 | 6,869 | 5,012 | ||||||||||||||
| Federal funds sold |
42 | 160 | (118 | ) | 75 | 421 | (346 | ) | ||||||||||||
| Interest-bearing deposits with banks |
40 | 11 | 29 | 65 | 58 | 7 | ||||||||||||||
| Other securities |
1,444 | 154 | 1,290 | 4,227 | 524 | 3,703 | ||||||||||||||
| Total interest income |
51,440 | 46,663 | 4,777 | 149,946 | 146,923 | 3,023 | ||||||||||||||
| Interest expense |
||||||||||||||||||||
| Deposits |
8,218 | 10,940 | (2,722 | ) | 24,221 | 37,230 | (13,009 | ) | ||||||||||||
| Notes payable and other borrowings |
2,612 | 4,184 | (1,572 | ) | 7,771 | 14,937 | (7,166 | ) | ||||||||||||
| Total interest expense |
10,830 | 15,124 | (4,294 | ) | 31,992 | 52,167 | (20,175 | ) | ||||||||||||
| Net interest income |
$ | 40,610 | $ | 31,539 | $ | 9,071 | $ | 117,954 | $ | 94,756 | $ | 23,198 | ||||||||
Net interest income increased $9.1 million for the third quarter of 2009 and $23.2 million for the nine months ended September 30, 2009 compared with the corresponding periods in 2008. The increase in net interest income for both periods was primarily due mostly to fluctuations within the banking segment and is discussed further in “—Lines of business” section below.
Noninterest income
Noninterest income was $86.4 million for the third quarter of 2009 compared with $31.4 million in the third quarter of 2008, an increase of $55.0 million. Noninterest income was $248.4 million for the nine months ended September 30, 2009 compared with $86.7 million in the corresponding period in 2008, an increase of $161.7 million. The increase was primarily due to increased income from loan originations and net gains on the sale of loans in the mortgage origination segment. Higher mortgage loan origination volume resulted from increased mortgage refinancing activity and a shift in the composition of mortgage loan originations toward government guaranteed mortgages, which government guaranteed mortgages have a higher value and greater marketability in the secondary market, as a result of changing market conditions.
Also contributing to the increase in noninterest income were increases in income derived from the financial advisory segment. The increase for both periods was due primarily to First Southwest, whose operations were included in the financial advisory segment beginning January 1, 2009.
43
Table of Contents
Index to Financial Statements
Noninterest expense
The following table summarizes noninterest expense for the periods indicated below (in thousands).
| Three months ended September 30, |
Nine months ended September 30, | |||||||||||||||||
| 2009 | 2008 | Variance | 2009 | 2008 | Variance | |||||||||||||
| 2009 v. 2008 | 2009 v. 2008 | |||||||||||||||||
| Noninterest expense |
||||||||||||||||||
| Employees’ compensation and benefits |
$ | 61,379 | $ | 28,572 | $ | 32,807 | $ | 171,658 | $ | 81,786 | $ | 89,872 | ||||||
| Occupancy and equipment, net |
12,923 | 6,961 | 5,962 | 36,166 | 20,007 | 16,159 | ||||||||||||
| Professional services |
4,209 | 3,356 | 853 | 13,128 | 8,620 | 4,508 | ||||||||||||
| Deposit insurance premium |
1,120 | 388 | 732 | 5,168 | 1,176 | 3,992 | ||||||||||||
| Repossession and foreclosure |
1,871 | 926 | 945 | 3,984 | 2,777 | 1,207 | ||||||||||||
| Other |
15,912 | 7,385 | 8,527 | 41,331 | 21,336 | 19,995 | ||||||||||||
| Total noninterest expense |
$ | 97,414 | $ | 47,588 | $ | 49,826 | $ | 271,435 | $ | 135,702 | $ | 135,733 | ||||||
Noninterest expense increased $49.8 million for the third quarter of 2009 and $135.7 million for the nine months ended September 30, 2009 compared with the corresponding periods in 2008. The largest components of these increases were employees’ compensation and benefits, occupancy and equipment expenses, net of rental income and other expenses.
Employees’ compensation and benefits increased $32.8 million for the third quarter of 2009 and $89.9 million for the nine months ended September 30, 2009 compared with the corresponding periods in 2008. The increase was primarily attributable by the mortgage origination segment to increased staffing levels for the additional mortgage banking offices opened during 2008 and 2009, as well as higher commission-related costs due to the increase in mortgage loan originations. Also contributing to the increase in employees’ compensation and benefits was the acquisition of First Southwest as its operations were included in the financial advisory segment beginning January 1, 2009.
Occupancy and equipment expenses, net of rental income, increased $6.0 million for the third quarter of 2009 and $16.2 million for the nine months ended September 30, 2009 compared with the corresponding periods in 2008. The increase for both periods was primarily due to the acquisition of First Southwest.
Other expenses increased $8.5 million for the third quarter of 2009 and $20.0 million for the nine months ended September 30, 2009 compared to the corresponding periods in 2008. The increase was primarily attributable to the mortgage origination segment due to increases in variable expenses that fluctuate with the volume of loan originations. Also contributing to the increase in other expenses for both periods was the acquisition of First Southwest.
44
Table of Contents
Index to Financial Statements
Lines of business
Banking segment
The following table summarizes the results for the banking segment for the indicated periods (in thousands):
| Three months ended September 30, |
Nine months ended September 30, |
|||||||||||||||||||
| Variance | Variance | |||||||||||||||||||
| 2009 | 2008 | 2009 v. 2008 | 2009 | 2008 | 2009 v. 2008 | |||||||||||||||
| Net interest income |
$ | 39,586 | $ | 31,220 | $ | 8,366 | $ | 115,316 | $ | 93,859 | $ | 21,457 | ||||||||
| Provision for loan losses |
14,310 | 2,635 | 11,675 | 39,073 | 7,818 | 31,255 | ||||||||||||||
| Noninterest income |
4,595 | 4,862 | (267 | ) | 12,848 | 15,706 | (2,858 | ) | ||||||||||||
| Noninterest expense |
23,203 | 22,840 | 363 | 70,528 | 68,639 | 1,889 | ||||||||||||||
| Net income (loss) before taxes |
6,668 | 10,607 | (3,939 | ) | 18,563 | 33,108 | (14,545 | ) | ||||||||||||
| Income tax provision (benefit) |
2,408 | 3,818 | (1,410 | ) | 6,629 | 11,796 | (5,167 | ) | ||||||||||||
| Net income (loss) |
$ | 4,260 | $ | 6,789 | $ | (2,529 | ) | $ | 11,934 | $ | 21,312 | $ | (9,378 | ) | ||||||
Net income was $4.3 million for the third quarter of 2009 and $11.9 million for the nine months ended September 30, 2009, which decreased $2.5 million and $9.4 million, respectively, compared to the corresponding periods in 2008. The decrease for both periods was primarily due to the increase in the provision for loan losses and the increase in noninterest expense, partially offset by the increase in net interest income.
The increase in the provision for loan losses was primarily a result of a significant increase in non-performing loans due to challenging economic conditions. Noninterest expense slightly increased by $0.4 million for the third quarter of 2009 and $1.9 million for the nine months ended September 30, 2009 compared with the corresponding periods in 2008. The increases were primarily due to increases in deposit insurance premiums and occupancy and equipment expenses.
45
Table of Contents
Index to Financial Statements
The following table summarizes the changes in the banking segment’s net interest income for the periods indicated below, including the component changes in the volume of average interest-earning assets and liabilities and changes in the rates earned or paid on those items (in thousands).
| Three months ended September 30, 2009 v. 2008 |
Nine months ended September 30, 2009 v. 2008 |
|||||||||||||||||||||||
| Change due to(1) | Change due to(1) | |||||||||||||||||||||||
| Volume | Yield/Rate | Change | Volume | Yield/Rate | Change | |||||||||||||||||||
| Interest income |
||||||||||||||||||||||||
| Loans |
$ | 13,874 | $ | (11,996 | ) | $ | 1,878 | $ | 13,391 | $ | (19,976 | ) | $ | (6,585 | ) | |||||||||
| Investment securities(2) |
13,638 | (11,840 | ) | 1,798 | 13,980 | (7,775 | ) | 6,205 | ||||||||||||||||
| Federal funds sold |
71 | (189 | ) | (118 | ) | (48 | ) | (298 | ) | (346 | ) | |||||||||||||
| Interest-bearing deposits in other financial institutions |
1,132 | (1,109 | ) | 23 | 684 | (695 | ) | (11 | ) | |||||||||||||||
| Other securities |
201 | (209 | ) | (8 | ) | 101 | (172 | ) | (71 | ) | ||||||||||||||
| Total interest income(2) |
28,916 | (25,343 | ) | 3,573 | 28,108 | (28,916 | ) | (808 | ) | |||||||||||||||
| Interest expense |
||||||||||||||||||||||||
| Deposits |
13,990 | (16,723 | ) | (2,733 | ) | 12,941 | (26,025 | ) | (13,084 | ) | ||||||||||||||
| Notes payable and other borrowings |
(1,151 | ) | (1,393 | ) | (2,544 | ) | 1,376 | (12,145 | ) | (10,769 | ) | |||||||||||||
| Total interest expense |
12,839 | (18,116 | ) | (5,277 | ) | 14,317 | (38,170 | ) | (23,853 | ) | ||||||||||||||
| Net interest income(2) |
$ | 16,077 | $ | (7,227 | ) | $ | 8,850 | $ | 13,791 | $ | 9,254 | $ | 23,045 | |||||||||||
| (1) | Changes attributable to both volume and yield/rate are included in yield/rate. |
| (2) | Taxable equivalent |
Net interest income for the third quarter of 2009 increased $8.9 million compared with the third quarter of 2008. Increases in the volume of interest-earning assets, primarily in the loan and investment securities portfolios, increased net interest income by $28.9 million, while increases in the volume of interest-bearing liabilities reduced net interest income by $12.8 million, and changes in yields earned and rates paid reduced net interest income by $7.2 million. Yields on the majority of variable rate loans declined to their respective rate floors in the first quarter of 2009, while the yields on the investment securities portfolio decreased due to relatively lower market yields, particularly on the auction rate bonds acquired in connection with our acquisition of First Southwest. The $18.1 million decrease in the rates paid on interest-bearing liabilities was due to the decrease in market interest rates compared with the prevailing market rates in the third quarter of 2008.
Net interest income for the nine months ended September 30, 2009 increased $23.0 million compared with the nine months ended September 30, 2008. The increase primarily resulted from a $28.1 million increase in interest income due to an increase in the volume of interest-earning assets, partially offset by a $14.3 million increase in interest expense due to an increase in the volume of interest-bearing liabilities. Changes in the yields earned, primarily in the loan and investment securities portfolios, reduced net interest income by $28.9 million, while the decreases in the rates paid increased net interest income by $38.2 million. The decrease in the yields earned was primarily due to the declining yields on the majority of variable rate loans to their respective rate floors, while rates paid decreased due to falling market interest rates compared to the nine months ended September 30, 2008. Also contributing to the decrease in the yields earned and rates paid was a decrease in the number of days in the first nine months of 2009 due to the 2008 leap year.
46
Table of Contents
Index to Financial Statements
The tables below provide additional details regarding the banking segment’s net interest income (dollars in thousands).
| Three months ended September 30, 2009 |
Three months ended September 30, 2008 | |||||||||||||||||
| Average outstanding balance |
Interest earned or paid |
Annualized yield or rate |
Average outstanding balance |
Interest earned or paid |
Annualized yield or rate | |||||||||||||
| Assets |
||||||||||||||||||
| Interest-earning assets |
||||||||||||||||||
| Loans, gross(2) |
$ | 2,909,314 | $ | 45,351 | 6.18% | $ | 2,693,254 | $ | 43,473 | 6.42% | ||||||||
| Investment securities—taxable |
221,173 | 2,054 | 3.71% | 131,061 | 1,663 | 5.08% | ||||||||||||
| Investment securities—non-taxable(1) |
197,928 | 2,331 | 4.71% | 57,330 | 924 | 6.45% | ||||||||||||
| Federal funds sold |
34,391 | 42 | 0.48% | 30,943 | 160 | 2.06% | ||||||||||||
| Interest-bearing deposits in other financial institutions |
57,942 | 34 | 0.23% | 2,156 | 11 | 2.03% | ||||||||||||
| Other securities |
29,400 | 146 | 1.99% | 22,157 | 154 | 2.78% | ||||||||||||
| Interest-earning assets, gross(1) |
3,450,148 | 49,958 | 5.74% | 2,936,901 | 46,385 | 6.28% | ||||||||||||
| Allowance for loan losses |
(35,764 | ) | (26,297 | ) | ||||||||||||||
| Interest-earning assets, net |
3,414,384 | 2,910,604 | ||||||||||||||||
| Noninterest-earning assets |
875,858 | 493,741 | ||||||||||||||||
| Total assets |
$ | 4,290,242 | $ | 3,404,345 | ||||||||||||||
| Liabilities and Shareholders’ Equity |
||||||||||||||||||
| Interest-bearing liabilities |
||||||||||||||||||
| Interest-bearing deposits |
$ | 2,982,771 | 8,207 | 1.09% | $ | 2,257,223 | 10,940 | 1.93% | ||||||||||
| Notes payable and other borrowings |
462,269 | 1,370 | 1.18% | 499,158 | 3,914 | 3.12% | ||||||||||||
| Total interest-bearing liabilities |
3,445,040 | 9,577 | 1.10% | 2,756,381 | 14,854 | 2.14% | ||||||||||||
| Noninterest-bearing liabilities |
||||||||||||||||||
| Noninterest-bearing deposits |
162,188 | 191,202 | ||||||||||||||||
| Other liabilities |
155,159 | 121,103 | ||||||||||||||||
| Total liabilities |
3,762,387 | 3,068,686 | ||||||||||||||||
| Stockholders’ equity |
527,855 | 335,659 | ||||||||||||||||
| Total liabilities and shareholders’ equity |
$ | 4,290,242 | $ | 3,404,345 | ||||||||||||||
| Net interest income(1) |
$ | 40,381 | $ | 31,531 | ||||||||||||||
| Net interest margin(1) |
4.64% | 4.27% | ||||||||||||||||
| Net interest spread(1) |
4.64% | 4.14% | ||||||||||||||||
| (1) | Taxable equivalent adjustments are based on a 35% tax rate. The adjustment to interest income was $0.8 million and $0.3 million for the third quarter of 2009 and 2008, respectively. |
| (2) | Average loans include non-accrual loans. |
47
Table of Contents
Index to Financial Statements
| Nine months ended September 30, 2009 |
Nine months ended September 30, 2008 | |||||||||||||||||
| Average outstanding balance |
Interest earned or paid |
Annualized yield or rate |
Average outstanding balance |
Interest earned or paid |
Annualized yield or rate | |||||||||||||
| Assets |
||||||||||||||||||
| Interest-earning assets |
||||||||||||||||||
| Loans, gross(2) |
$ | 2,893,475 | $ | 130,918 | 6.05% | $ | 2,696,856 | $ | 137,503 | 6.81% | ||||||||
| Investment securities—taxable |
223,573 | 6,692 | 3.99% | 131,937 | 5,085 | 5.14% | ||||||||||||
| Investment securities—non-taxable(1) |
199,518 | 7,264 | 4.85% | 55,296 | 2,666 | 6.43% | ||||||||||||
| Federal funds sold |
21,987 | 75 | 0.46% | 24,047 | 421 | 2.34% | ||||||||||||
| Interest-bearing deposits in other financial institutions |
26,295 | 46 | 0.23% | 2,634 | 57 | 2.89% | ||||||||||||
| Other securities |
26,285 | 453 | 2.30% | 22,967 | 524 | 3.04% | ||||||||||||
| Interest-earning assets, gross(1) |
3,391,133 | 145,448 | 5.73% | 2,933,737 | 146,256 | 6.66% | ||||||||||||
| Allowance for loan losses |
(31,686 | ) | (26,396 | ) | ||||||||||||||
| Interest-earning assets, net |
3,359,447 | 2,907,341 | ||||||||||||||||
| Noninterest-earning assets |
801,687 | 519,718 | ||||||||||||||||
| Total assets |
$ | 4,161,134 | $ | 3,427,059 | ||||||||||||||
| Liabilities and Shareholders’ Equity |
||||||||||||||||||
| Interest-bearing liabilities |
||||||||||||||||||
| Interest-bearing deposits |
$ | 2,729,682 | 24,146 | 1.18% | $ | 2,166,045 | 37,230 | 2.30% | ||||||||||
| Notes payable and other borrowings |
571,912 | 3,503 | 0.82% | 533,409 | 14,272 | 3.57% | ||||||||||||
| Total interest-bearing liabilities |
3,301,594 | 27,649 | 1.12% | 2,699,454 | 51,502 | 2.55% | ||||||||||||
| Noninterest-bearing liabilities |
||||||||||||||||||
| Noninterest-bearing deposits |
185,475 | 254,215 | ||||||||||||||||
| Other liabilities |
157,130 | 148,001 | ||||||||||||||||
| Total liabilities |
3,644,199 | 3,101,670 | ||||||||||||||||
| Stockholders’ equity |
516,935 | 325,389 | ||||||||||||||||
| Total liabilities and shareholders’ equity |
$ | 4,161,134 | $ | 3,427,059 | ||||||||||||||
| Net interest income(1) |
$ | 117,799 | $ | 94,754 | ||||||||||||||
| Net interest margin(1) |
4.64% | 4.31% | ||||||||||||||||
| Net interest spread(1) |
4.61% | 4.11% | ||||||||||||||||
| (1) | Taxable equivalent adjustments are based on a 35% tax rate. The adjustment to interest income was $2.4 million and $0.9 million for the nine months ended September 30, 2009 and 2008, respectively. |
| (2) | Average loans include non-accrual loans. |
48
Table of Contents
Index to Financial Statements
The banking segment net interest margin shown above exceeds our consolidated net interest margin. Our consolidated net interest margin includes the yields and costs associated with certain items within interest-earning assets and interest-bearing liabilities in the financial advisory segment, as well as the borrowing costs of the parent company, both of which reduce our consolidated net interest margin.
Mortgage origination segment
The following table summarizes the results for the mortgage origination segment for the indicated periods (in thousands):
| Three months ended September 30, |
Nine months ended September 30, |
|||||||||||||||||||||
| 2009 | 2008 | Variance | 2009 | 2008 | Variance | |||||||||||||||||
| 2009 v. 2008 | 2009 v. 2008 | |||||||||||||||||||||
| Net interest income |
$ | (318 | ) | $ | 322 | $ | (640 | ) | $ | (1,138 | ) | $ | 918 | $ | (2,056 | ) | ||||||
| Noninterest income |
52,421 | 25,157 | 27,264 | 163,349 | 66,476 | 96,873 | ||||||||||||||||
| Noninterest expense |
46,626 | 23,342 | 23,284 | 130,880 | 62,740 | 68,140 | ||||||||||||||||
| Net income (loss) before taxes |
5,477 | 2,137 | 3,340 | 31,331 | 4,654 | 26,677 | ||||||||||||||||
| Income tax provision (benefit) |
2,001 | 776 | 1,225 | 11,262 | 1,669 | 9,593 | ||||||||||||||||
| Net income (loss) |
$ | 3,476 | $ | 1,361 | $ | 2,115 | $ | 20,069 | $ | 2,985 | $ | 17,084 | ||||||||||
Net income was $3.5 million for the third quarter of 2009 and $20.1 million for the nine months ended September 30, 2009, which increased $2.1 million and $17.1 million, respectively, compared to the corresponding periods in 2008. The increase for both periods was due primarily to increases in noninterest income, partially offset by increases in noninterest expense. Increased income from loan originations and net gains on the sale of loans accounted for substantially all of the change in noninterest income, which increased $27.3 million for the third quarter of 2009 and $96.9 million for the nine months ended September 30, 2009 compared with the corresponding periods of 2008. Mortgage loan origination volume was $1.3 billion for the third quarter of 2009 compared to $0.6 billion for the third quarter of 2008, an increase of 116.7%. Mortgage loan origination volume was $4.3 billion for the nine months ended September 30, 2009 and $1.7 billion for the nine months ended September 30, 2008, an increase of 152.9%. In the third quarter, mortgage loan origination volume increased primarily due to an increase in the volume of originations for the purchase of homes. For the first half of 2009, refinancings and home purchases accounted by dollar volume for 61.4% and 38.6%, respectively, of the total mortgage loan origination volume. For the three months ended September 30, 2009, refinancings and home purchases accounted by dollar volume for 31.9% and 68.1%, respectively, of the total mortgage loan origination volume. For the nine months ended September 30, 2009, the increase in mortgage loan originations was also attributable to the favorable interest rate environment for mortgage refinancings during the first half of 2009. For the nine months ended September 30, 2009, refinancings and home purchases accounted by dollar volume for 52.1% and 47.9%, respectively, of total mortgage loan origination volume.
Employees’ compensation and benefits accounted for the majority of the increase in noninterest expense. Employees’ compensation and benefits increased $16.7 million for the third quarter of
49
Table of Contents
Index to Financial Statements
2009 and $47.1 million for the nine months ended September 30, 2009, respectively, compared with the corresponding periods in 2008. The increase was attributable to increased staffing levels for the additional mortgage banking offices opened during 2008 and 2009, as well as higher commission-related costs due to the increase in mortgage loan originations.
Financial advisory segment
The following table summarizes the results for the financial advisory segment for the indicated periods (in thousands):
| Three months ended September 30, |
Nine months ended September 30, | |||||||||||||||||||
| 2009 | 2008 | Variance | 2009 | 2008 | Variance | |||||||||||||||
| 2009 v. 2008 | 2009 v. 2008 | |||||||||||||||||||
| Net interest income |
$ | 1,342 | $ | (3 | ) | $ | 1,345 | $ | 3,776 | $ | (21 | ) | $ | 3,797 | ||||||
| Noninterest income |
29,373 | 1,425 | 27,948 | 72,223 | 4,527 | 67,696 | ||||||||||||||
| Noninterest expense |
27,585 | 1,406 | 26,179 | 70,027 | 4,323 | 65,704 | ||||||||||||||
| Net income (loss) before taxes |
3,130 | 16 | 3,114 | 5,972 | 183 | 5,789 | ||||||||||||||
| Income tax provision (benefit) |
1,114 | (12 | ) | 1,126 | 2,100 | (17 | ) | 2,117 | ||||||||||||
| Net income (loss) |
$ | 2,016 | $ | 28 | $ | 1,988 | $ | 3,872 | $ | 200 | $ | 3,672 | ||||||||
Net income was $2.0 million for the third quarter of 2009 and $3.9 million for the nine months ended September 30, 2009, which increased $2.0 million and $3.7 million, respectively compared to the corresponding periods in 2008. The increase for both periods was due primarily to First Southwest, whose operations were included in the financial advisory segment beginning January 1, 2009. The majority of noninterest income is generated from fees and commissions earned from investment advisory and securities brokerage activities, which increased $24.4 million for the third quarter of 2009 and $63.7 million for the nine months ended September 30, 2009 compared with the corresponding periods of 2008.
In addition, First Southwest received $3.1 million from the United States Attorney’s Office in September 2009. First Southwest had made claims to recover its share of certain funds the U.S. government had recovered from its investigation of a stock fraud from which First Southwest incurred significant losses in 1997. The recovery is included in other noninterest income. Contingent fees of $0.5 million were paid to attorneys who assisted us with this recovery and are included in professional services expense.
Financial condition
The following discussion contains a more detailed analysis of our financial condition at September 30, 2009 and as compared to December 31, 2008.
Securities portfolio
Historically, our policy has been to invest primarily in securities of the U.S. government and its agencies, obligations of municipalities in the State of Texas, and other high grade fixed income securities to minimize credit risk. Pursuant to our acquisition of First Southwest, we purchased a
50
Table of Contents
Index to Financial Statements
portfolio of auction rate bonds for which an active market does not currently exist. The securities portfolio plays a role in the management of interest rate sensitivity and generates additional interest income. In addition, the securities portfolio is used to meet collateral requirements and the available-for-sale portion thereof serves as a source of liquidity.
The securities portfolio consists of two major components: securities held-to-maturity and securities available-for-sale. Securities are classified as held-to-maturity based on the intent and ability of our management, at the time of purchase, to hold such securities to maturity. These securities are carried at amortized cost. Securities that may be sold in response to changes in market interest rates, changes in securities’ prepayment risk, increases in loan demand, general liquidity needs, and other similar factors are classified as available-for-sale and are carried at estimated fair value. The table below summarizes our securities portfolio (in thousands).
| September 30, 2009 |
December 31, 2008 | |||||
| Securities available-for-sale, at fair value |
||||||
| U. S. Treasury securities |
$ | — | $ | 11,953 | ||
| U. S. government agency obligations |
— | 10,038 | ||||
| Mortgage-backed securities |
26,986 | 35,439 | ||||
| Collateralized mortgage obligations |
75,610 | 68,515 | ||||
| States and political subdivisions |
— | — | ||||
| Auction rate bonds |
69,821 | 40,612 | ||||
| 172,417 | 166,557 | |||||
| Securities held-to-maturity, at amortized cost |
||||||
| Mortgage-backed securities |
17,739 | 19,982 | ||||
| Collateralized mortgage obligations |
40,097 | 29,030 | ||||
| States and political subdivisions |
107,416 | 57,228 | ||||
| Auction rate bonds |
105,548 | 110,969 | ||||
| 270,800 | 217,209 | |||||
| Trading securities, at fair value |
36,398 | 1,561 | ||||
| Total securities portfolio |
$ | 479,615 | $ | 385,327 | ||
To address a change in an interpretation of the regulatory requirements regarding the maximum allowed level of investments in certain securities, the Bank transferred auction rate bonds with a net carrying amount of $22.6 million from held to maturity to available for sale in June 2009. The net carrying amount of the transferred securities included an unrealized loss of $0.2 million which was included in other comprehensive income. As of September 30, 2009, the unrealized loss on the transferred securities was less than $50,000.
We hold securities of two issuers that exceed 10% of our shareholders’ equity. See “—Years Ended December 31, 2008, 2007 and 2006—Securities”.
51
Table of Contents
Index to Financial Statements
Loan portfolio
Loans held for investment in our banking and financial advisory segments are detailed in the table below (in thousands) and classified by type.
| September 30, 2009 |
December 31, 2008 |
|||||||
| Commercial and industrial |
$ | 1,215,758 | $ | 1,262,456 | ||||
| Lease financing |
84,871 | 101,902 | ||||||
| Construction and land development |
439,115 | 585,320 | ||||||
| Real estate |
1,132,065 | 839,099 | ||||||
| Securities (including margin loans) |
134,756 | 129,638 | ||||||
| Consumer |
50,238 | 51,091 | ||||||
| Loans, gross |
3,056,803 | 2,969,506 | ||||||
| Unearned income |
(4,455 | ) | (3,887 | ) | ||||
| Allowance for loan losses |
(39,799 | ) | (40,672 | ) | ||||
| Loans, net |
$ | 3,012,549 | $ | 2,924,947 | ||||
Loans held for sale of $426.9 million at September 30, 2009 are in our mortgage origination segment and excluded from the table above. A discussion of loans in each of those segments follows.
Banking segment
The banking segment’s loan portfolio constitutes the major earning asset of the banking segment and typically offers the best alternative for obtaining the maximum interest spread above the cost of funds. The overall economic strength of the banking segment generally parallels the quality and yield of its loan portfolio. Total loans, net of the allowance for loan losses, were $2.9 billion as of September 30, 2009 and $2.8 billion as of December 31, 2008. The $44.5 million increase in net loans at September 30, 2009 compared with December 31, 2008, was primarily attributable to growth in real estate loans.
The banking segment does not generally participate in syndicated loan transactions and has no foreign loans in its portfolio. At September 30, 2009, the banking segment had loan concentrations (loans to borrowers engaged in similar activities) which exceeded 10% of total loans in its real estate loan portfolio. The areas of concentration within our real estate portfolio were construction and land development loans and non-construction commercial real estate loans. At September 30, 2009, construction and land development loans were 14% of total loans, while non-construction commercial real estate loans were 26% of total loans.
Mortgage origination segment
The loan portfolio of the mortgage origination segment consists of loans held for sale, primarily single-family residential mortgages funded through PrimeLending, and pipeline loans, which are loans in various stages of the application process, but not yet closed and funded. Pipeline loans may not close if potential borrowers elect in their sole discretion not to proceed with the loan application. Total loans held for sale were $426.9 million as of September 30, 2009 and $192.3 million as of December 31, 2008. The $234.6 million increase in net loans at September 30, 2009 compared with December 31, 2008, was primarily attributable to internally generated growth that resulted in the opening of additional offices, market conditions that led to increased refinancing activity, as well as an increased market share attained by PrimeLending. PrimeLending was able to service the increased demand for refinancings due to the availability of warehouse financing through our banking segment.
52
Table of Contents
Index to Financial Statements
The components of loans held for sale and pipeline loans at September 30, 2009 and December 31, 2008, are shown in the following table (in thousands).
| September 30, 2009 |
December 31, 2008 | |||
| Loans held for sale |
||||
| Unpaid principal balance |
$417,618 | $188,143 | ||
| Fair value adjustment |
9,277 | 4,118 | ||
| $462,895 | $192,261 | |||
| Pipeline loans |
||||
| Unpaid principal balance |
$383,539 | $219,700 | ||
| Fair value adjustment |
6,502 | 4,041 | ||
| $390,041 | $223,741 | |||
Financial advisory segment
The loan portfolio consists primarily of margin loans to customers and correspondents. These loans are collateralized by the securities purchased or by other securities owned by the clients and, because of collateral coverage ratios, are believed to present minimal collectability exposure. Additionally, these loans are subject to a number of regulatory requirements as well as First Southwest’s internal policies. Total loans, net of the allowance for loan losses, were $143.4 million as of September 30, 2009 and $125.5 million as of December 31, 2008.
Allowance for loan losses
The allowance for loan losses is a reserve established through a provision for loan losses charged to expense, which represents management’s best estimate of probable losses that have been incurred within the existing portfolio of loans. Our management has responsibility for determining the level of the allowance for loan losses, subject to review by our board of directors. Among other factors, management, on a quarterly basis, considers our historical loss experience, the size and composition of the loan portfolio, the value and adequacy of collateral and guarantors, delinquencies, non-performing credits, including impaired loans and its risk-rating-based loan “watch” list, along with national and local economic conditions.
There are additional risks of loan losses that cannot be precisely quantified or attributed to particular loans or classes of loans. Since those factors include general economic trends as well as conditions affecting individual borrowers, the allowance for loan losses is an estimate. The sum of these elements is our management’s recommended level for the allowance. The unallocated portion of the allowance is based on loss factors that cannot be associated with specific loans or loan categories. These factors include management’s subjective evaluation of such conditions as credit quality trends, collateral values, portfolio concentrations, delinquency levels, specific industry conditions in the regional economy, regulatory examination results, loan review findings and recent loss experiences in particular portfolio segments. The unallocated portion of the allowance for losses reflects management’s attempt to ensure that the overall reserve appropriately reflects a margin for the imprecision necessarily inherent in estimates of credit losses.
We have developed a methodology that seeks to determine an allowance to absorb probable loan losses inherent in the portfolio based on evaluations of the collectibility of loans, historical loss experience, peer bank loss experience, delinquency trends, economic conditions, portfolio
53
Table of Contents
Index to Financial Statements
composition and specific loss estimates for loans considered substandard or doubtful. We design our loan review program to achieve the objective of reviewing, on an annual basis, loan relationships that account for approximately 60% of the dollar amount of our loan portfolio, regardless of risk. We review all loan relationships that exhibit probable or observed credit weaknesses, the top 25 loan relationships by dollar amount in each market we serve, and additional relationships necessary to achieve our desired coverage ratio. Based on management’s evaluation, estimated loan loss allowances are assigned to the individual loans that present a greater risk of loan loss. If necessary, reserves would be allocated to individual loans based on management’s estimate of the borrower’s ability to repay the loan given the availability and value of collateral and other sources of cash flow. Any reserves for impaired loans are measured based on the present value of the expected future cash flow discounted at the loan’s effective interest rate or the fair value of the underlying collateral. We evaluate the collectability of both principal and interest when assessing the need for a loss accrual. A composite allowance factor that considers our and other peer bank loss experience ratios, delinquency trends, economic conditions, and portfolio composition is applied to the total of commercial and commercial real estate loans not specifically evaluated.
The allowance is subject to regulatory examinations and determinations as to adequacy, which may take into account such factors as the methodology used to calculate the allowance and the size of the allowance in comparison to peer banks identified by regulatory agencies. Homogenous loans, such as consumer installment, residential mortgage loans, and home equity loans, are not individually reviewed and are generally risk graded at the same levels. The risk grade and reserves are established for each homogenous pool of loans based on the expected net charge offs from a current trend in delinquencies, losses or historical experience and general economic conditions. As of September 30, 2009, we had no material delinquencies in these types of loans.
While we believe we have sufficient allowance for our existing portfolio as of September 30, 2009, additional provisions for losses on existing loans may be necessary in the future. We recorded net charge-offs in the amount of $6.3 million for the third quarter of 2009, compared to net charge-offs of $3.0 million for the third quarter of 2008. For the nine months ended September 30, 2009 and 2008, net charge-offs were $39.9 million and $7.9 million, respectively. The allowance for loan losses totaled $39.8 million at September 30, 2009 and $40.7 million at December 31, 2008. The ratio of the allowance for loan losses to total loans outstanding at September 30, 2009 and December 31, 2008 was 1.3% and 1.4%, respectively.
Provision for loan losses
Provisions for loan losses are charged to operations to record the total allowance for loan losses at a level deemed appropriate by the banking segment’s management based on such factors as the volume and type of lending it conducted, the amount of non-performing loans and related collateral security, the present level of the allowance for loan losses, the results of recent regulatory examinations, generally accepted accounting principles, general economic conditions and other factors related to the ability to collect loans in its portfolio.
The provision for loan losses, held primarily in the banking segment, was $39.1 million for the nine months ended September 30, 2009 and $7.8 million for the nine months ended September 30, 2008. The $31.3 million increase was primarily a result of a significant increase in non-performing loans due to challenging economic conditions. Additional information regarding the allowance for loan losses can be found under the heading “—Allowance for loan losses” above.
54
Table of Contents
Index to Financial Statements
The following table presents the activity in our allowance for loan losses for the dates indicated (dollars in thousands). Substantially all of the activity shown below occurred within the banking segment.
| Three months ended September 30, |
Nine months ended September 30, |
|||||||||||||||
| 2009 | 2008 | 2009 | 2008 | |||||||||||||
| Balance at beginning of period |
$ | 31,778 | $ | 26,799 | $ | 40,672 | $ | 26,517 | ||||||||
| Provisions charged to operating expenses |
14,310 | 2,635 | 39,073 | 7,818 | ||||||||||||
| Recoveries of loans previously charged off |
||||||||||||||||
| Commercial and industrial |
190 | 229 | 681 | 818 | ||||||||||||
| Real estate |
69 | — | 69 | — | ||||||||||||
| Construction and land development |
20 | — | 23 | 25 | ||||||||||||
| Lease financing |
— | 25 | 10 | 25 | ||||||||||||
| Consumer |
12 | 13 | 47 | 42 | ||||||||||||
| Total recoveries |
291 | 267 | 830 | 910 | ||||||||||||
| Loans charged off |
||||||||||||||||
| Commercial and industrial |
4,771 | 2,631 | 32,701 | 7,424 | ||||||||||||
| Real estate |
577 | 48 | 2,623 | 201 | ||||||||||||
| Construction and land development |
869 | 466 | 2,798 | 957 | ||||||||||||
| Lease financing |
241 | 119 | 1,367 | 167 | ||||||||||||
| Consumer |
122 | 33 | 1,287 | 92 | ||||||||||||
| Total charge-offs |
6,580 | 3,297 | 40,776 | 8,841 | ||||||||||||
| Net charge-offs |
(6,289 | ) | (3,030 | ) | (39,946 | ) | (7,931 | ) | ||||||||
| Balance at end of period |
$ | 39,799 | $ | 26,404 | $ | 39,799 | $ | 26,404 | ||||||||
| Net charge-offs to average loans outstanding |
0.18% | 0.11% | 1.19% | 0.28% | ||||||||||||
The distribution of the allowance for loan losses among loan types and the percentage of the loans for that type to gross loans, excluding unearned income, are presented in the table below (dollars in thousands). Amounts shown in “Unallocated” include the portion of the allowance that is attributable to factors that cannot be distributed by type. Those factors include credit concentrations, trends in loan growth, and various other market, economic and regulatory considerations.
| September 30, 2009 | December 31, 2008 | |||||||||
| Reserve | % of gross loans |
Reserve | % of gross loans | |||||||
| Commercial and industrial |
$ | 20,918 | 39.77% | $ | 27,641 | 42.51% | ||||
| Real estate (including construction and land development) |
13,688 | 51.40% | 4,928 | 47.97% | ||||||
| Lease financing |
1,134 | 2.78% | 1,152 | 3.43% | ||||||
| Securities (including margin loans) |
1,280 | 4.41% | 1,280 | 4.37% | ||||||
| Consumer |
453 | 1.64% | 377 | 1.72% | ||||||
| Unallocated |
2,326 | 5,294 | ||||||||
| Total |
$ | 39,799 | 100.00% | $ | 40,672 | 100.00% | ||||
55
Table of Contents
Index to Financial Statements
Potential problem loans
Potential problem loans consist of loans that are performing in accordance with contractual terms but for which management has concerns about the ability of an obligor to continue to comply with repayment terms because of the obligor’s potential operating or financial difficulties. Management monitors these loans and reviews their performance on a regular basis. As of September 30, 2009, we had nine credit relationships totaling $13.6 million in loans of this type which are not included in either the non-accrual or 90 days past due loan categories.
Non-performing assets
The following table presents our components of non-performing assets at the dates indicated (in thousands).
| September 30, 2009 |
December 31, 2008 |
September 30, 2008 | |||||||
| Loans accounted for on a non-accrual basis |
|||||||||
| Commercial and industrial |
$ | 25,695 | $ | 32,919 | $ | 32,945 | |||
| Lease financing |
4,337 | 1,388 | 3,135 | ||||||
| Construction and land development |
20,228 | 6,870 | 2,793 | ||||||
| Real estate |
12,290 | 5,149 | 4,979 | ||||||
| Consumer |
— | 492 | — | ||||||
| $ | 62,550 | $ | 46,818 | $ | 43,852 | ||||
| Non-performing loans as a percentage of total loans |
1.80% | 1.48% | 1.54% | ||||||
| Loans past due 90 days or more and still accruing |
$ | 150 | $ | 3,928 | $ | 8,215 | |||
| Other Real Estate Owned |
$ | 13,222 | $ | 9,637 | $ | 10,523 | |||
| Non-performing assets |
$ | 75,922 | $ | 60,383 | $ | 62,590 | |||
| Non-performing assets as a percentage of total assets |
1.62% | 1.53% | 1.86% | ||||||
At September 30, 2009, total non-performing assets increased $15.5 million to $75.9 million compared to December 31, 2008. Non-accrual loans increased by $15.7 million to $62.5 million at September 30, 2009 compared to December 31, 2008. Of these non-accrual loans, $25.7 million were characterized as commercial and industrial loans. The commercial and industrial loans included approximately $9.9 million in business loans for investment properties arising primarily from a single customer relationship and secured principally by the inventory and property, plant and equipment of a group of related borrowers. Also included in the commercial and industrial loan category was a $4.5 million loan secured by the borrower’s accounts receivable and inventory, a $2.5 million loan secured by the borrower’s accounts receivable and inventory, and a $2.4 million loan secured by aircraft.
Non-accrual loans at September 30, 2009 also included $20.2 million characterized as construction and land development loans. This included two residential real estate loans totaling approximately $5.8 million from a single customer relationship and secured by assisted living centers, two residential real estate development loans totaling approximately $4.7 million from a single customer relationship and secured by unimproved land, and $1.6 million in residential real estate loans from a single customer relationship secured by single family residential lots.
56
Table of Contents
Index to Financial Statements
Non-accrual loans also included $12.3 million characterized as real estate loans. This included a $2.0 million commercial real estate loan secured by unoccupied residential property, a $1.2 million commercial real estate loan secured by occupied residential property, three commercial real estate loans from a single customer relationship totaling approximately $1.2 million and secured by unoccupied townhomes, and a $1.1 million commercial real estate loan secured by unoccupied retail space.
Other Real Estate Owned increased $3.6 million to $13.2 million at September 30, 2009 compared to December 31, 2008. This included $10.5 million of commercial real estate property consisting of single family residences under development and $2.2 million of residential lots at various levels of completion. The increase in Other Real Estate Owned was due primarily to the economic downturn affecting the housing market.
Additional interest income that would have been recorded if the non-accrual loans had been current during the nine months ended September 30, 2009 totaled $3.8 million and $2.4 million during the nine months ended September 30, 2008.
Borrowings
Our borrowings as of September 30, 2009 and December 31, 2008 are shown in the table below (in thousands).
| September 30, 2009 |
December 31, 2008 |
Variance | ||||||||
| Short-term borrowings |
$ | 449,410 | $ | 256,452 | $ | 192,958 | ||||
| Notes payable |
70,691 | 151,014 | (80,323 | ) | ||||||
| Junior subordinated debentures |
67,012 | 67,012 | — | |||||||
| Other borrowings |
11,426 | 12,075 | (649 | ) | ||||||
| $ | 598,539 | $ | 486,553 | $ | 111,986 | |||||
Short-term borrowings consist of federal funds purchased and securities sold under agreements to repurchase, as well as borrowings at the Federal Home Loan Bank. The $193.0 million increase in short-term borrowings at September 30, 2009 compared with December 31, 2008 was due primarily to increased borrowing of $275.0 million from the Federal Home Loan Bank, which had favorable pricing relative to the brokered deposit market, which provides an alternative source of funding for the Bank. Our brokered deposits were $181.2 million at September 30, 2009, a decrease of $383.1 million from December 31, 2008.
Notes payable consist primarily of our borrowing facilities with third party lenders. The decrease in notes payable at September 30, 2009 compared with December 31, 2008 related primarily to the redemption in January 2009 of approximately $78.6 million of notes payable that financed the auction rate bonds held by First Southwest Holdings, Inc. prior to the acquisition. We have revolving lines of credit for up to $30 million with JP Morgan Chase Bank, N.A. At September 30, 2009, we had $3.5 million of additional borrowing capacity under those revolving lines of credit.
57
Table of Contents
Index to Financial Statements
Years ended December 31, 2008, 2007 and 2006
Overview of operating results
We had net income of $24.1 million, or $0.92 per diluted share, for the year ended December 31, 2008, compared with $28.6 million, or $1.09 per diluted share, for the year ended December 31, 2007, and $25.7 million, or $0.99 per diluted share, for the year ended December 31, 2006. Return on average shareholders’ equity and return on average assets was 7.6% and 0.7%, respectively, for the year ended December 31, 2008, compared with 13.0% and 1.0%, respectively, for the year ended December 31, 2007, and 13.2% and 1.0%, respectively, for the year ended December 31, 2006. During 2008, net income was adversely affected by a larger increase to the provision for loan losses than prior years.
In addition to the return on average shareholders’ equity and return on average assets ratios above, we consider the ratios shown in the table below to be key indicators of our performance.
| Year ended December 31, | ||||||
| 2008 | 2007 | 2006 | ||||
| Leverage ratio |
12.70% | 8.06% | 8.22% | |||
| Net interest margin |
4.13% | 4.25% | 4.35% | |||
| Efficiency ratio |
75.93% | 75.40% | 78.20% | |||
Net interest margin is detailed in the “Years ended December 31, 2008, 2007 and 2006—Net interest income” section below.
The changes in our earnings during the periods described above are attributable to the factors listed below (in millions).
| Earnings increase (decrease) | ||||||
| Year ended December 31, | ||||||
| 2008 v. 2007 | 2007 v. 2006 | |||||
| Banking Segment |
||||||
| Interest income on loans |
$ (31.3 | ) | $ 26.8 | |||
| Interest expense on deposits |
41.0 | (13.0 | ) | |||
| Provision for loan loss |
(17.3 | ) | (0.5 | ) | ||
| Noninterest expense |
(8.4 | ) | (7.6 | ) | ||
| Mortgage Origination Segment |
||||||
| Income from loan origination and net gains from sale of loans |
34.2 | (21.0 | ) | |||
| Noninterest expense |
(25.3 | ) | 23.7 | |||
| All Other Subsidiaries (including tax effects) |
2.6 | (5.5 | ) | |||
| $ (4.5 | ) | $ 2.9 | ||||
58
Table of Contents
Index to Financial Statements
Banking segment
Net interest income
The following table summarizes the components of the banking segment’s net interest income (in thousands):
| Year ended December 31, | ||||||||||||
| Variance | ||||||||||||
| 2008 | 2007 | 2006 | 2008 v. 2007 | 2007 v. 2006 | ||||||||
| Interest income |
||||||||||||
| Loans, including fees |
$185,830 | $217,104 | $190,325 | $(31,274 | ) | $26,779 | ||||||
| Securities(1) |
11,243 | 10,904 | 10,228 | 339 | 676 | |||||||
| Federal funds sold |
477 | 1,330 | 1,795 | (853 | ) | (465 | ) | |||||
| Interest-bearing deposits with banks |
70 | 176 | 156 | (106 | ) | 20 | ||||||
| Total interest income(1) |
197,620 | 229,514 | 202,504 | (31,894 | ) | 27,010 | ||||||
| Interest expense |
||||||||||||
| Deposits |
48,451 | 89,458 | 76,419 | (41,007 | ) | 13,039 | ||||||
| Notes payable and other borrowings |
16,486 | 17,811 | 14,125 | (1,325 | ) | 3,686 | ||||||
| Total interest expense |
64,937 | 107,269 | 90,544 | (42,332 | ) | 16,725 | ||||||
| Net interest income(1) |
$132,683 | $122,245 | $111,960 | $ 10,438 | $10,285 | |||||||
| (1) | Taxable equivalent |
59
Table of Contents
Index to Financial Statements
The table below provides additional details regarding the banking segment’s net interest income (dollar amounts in thousands).
| Year ended December 31, | |||||||||||||||||||||
| 2008 | 2007 | 2006 | |||||||||||||||||||
| Average outstanding balance |
Interest earned or paid |
Annualized yield or rate |
Average outstanding balance |
Interest earned or paid |
Annualized yield or rate |
Average outstanding balance |
Interest earned or paid |
Annualized yield or rate | |||||||||||||
| Assets |
|||||||||||||||||||||
| Interest-earning assets |
|||||||||||||||||||||
| Loans, gross(1) |
$2,720,068 | $185,830 | 6.83% | $2,419,212 | $217,104 | 8.97% | $2,066,207 | $190,325 | 9.21% | ||||||||||||
| Investment securities—taxable |
164,235 | 7,648 | 4.66% | 153,913 | 8,066 | 5.24% | 158,826 | 8,270 | 5.21% | ||||||||||||
| Investment securities—non-taxable(2) |
55,792 | 3,595 | 6.44% | 45,904 | 2,838 | 6.18% | 31,602 | 1,958 | 6.20% | ||||||||||||
| Federal funds sold |
24,522 | 477 | 1.95% | 23,551 | 1,330 | 5.65% | 35,199 | 1,795 | 5.10% | ||||||||||||
| Interest-bearing deposits in other financial institutions |
4,701 | 70 | 1.49% | 3,700 | 176 | 4.76% | 3,484 | 156 | 4.48% | ||||||||||||
| Interest-earning assets, gross |
2,969,318 | 197,620 | 6.66% | 2,646,280 | 229,514 | 8.67% | 2,295,318 | 202,504 | 8.82% | ||||||||||||
| Allowance for loan losses |
(26,551 | ) | (25,647 | ) | (23,630 | ) | |||||||||||||||
| Interest-earning assets, net |
2,942,767 | 2,620,633 | 2,271,688 | ||||||||||||||||||
| Noninterest-earning assets |
532,588 | 558,019 | 599,143 | ||||||||||||||||||
| Total assets |
$3,475,355 | $3,178,652 | $2,870,831 | ||||||||||||||||||
| Liabilities and Shareholders’ Equity |
|||||||||||||||||||||
| Interest-bearing liabilities |
|||||||||||||||||||||
| Interest-bearing deposits |
$2,230,120 | 48,451 | 2.17% | $1,982,223 | 89,458 | 4.51% | $1,818,149 | 76,419 | 4.20% | ||||||||||||
| Notes payable and other borrowings |
514,664 | 16,486 | 3.20% | 185,590 | 17,811 | 9.60% | 78,670 | 14,125 | 17.95% | ||||||||||||
| Total interest-bearing liabilities |
2,744,784 | 64,937 | 2.37% | 2,167,813 | 107,269 | 4.95% | 1,896,819 | 90,544 | 4.77% | ||||||||||||
| Noninterest-bearing liabilities |
|||||||||||||||||||||
| Noninterest-bearing deposits |
234,342 | 470,046 | 469,862 | ||||||||||||||||||
| Other liabilities |
151,662 | 254,017 | 241,686 | ||||||||||||||||||
| Total liabilities |
3,130,788 | 2,891,876 | 2,608,367 | ||||||||||||||||||
| Shareholders’ equity |
344,567 | 286,776 | 262,464 | ||||||||||||||||||
| Total liabilities and shareholders’ equity |
$3,475,355 | $3,178,652 | $2,870,831 | ||||||||||||||||||
| Net interest income(2) |
$132,683 | $122,245 | $111,960 | ||||||||||||||||||
| Net interest margin(2) |
4.47% | 4.62% | 4.88% | ||||||||||||||||||
| Net interest spread(2) |
4.29% | 3.72% | 4.05% | ||||||||||||||||||
| (1) | Average loans include non-accrual loans. |
| (2) | Taxable equivalent adjustments are based on a 35% tax rate. The adjustment to interest income was $1.2 million, $0.9 million and $0.6 million for 2008, 2007 and 2006, respectively. |
60
Table of Contents
Index to Financial Statements
The following table summarizes the changes in the banking segment’s net interest income for the years ended December 31, 2008, 2007 and 2006, including the component changes in the volume of average interest-earning assets and liabilities and changes in the rates earned or paid on those items (in thousands).
| Years ended December 31, | ||||||||||||||||||
| 2008 v. 2007 | 2007 v. 2006 | |||||||||||||||||
| Change due to(1) | Change |
Change due to(1) | Change |
|||||||||||||||
| Volume | Yield/Rate | Volume | Yield/Rate | |||||||||||||||
| Interest income |
||||||||||||||||||
| Loans |
$ 26,999 | $(58,273 | ) | $(31,274 | ) | $32,516 | $(5,737 | ) | $26,779 | |||||||||
| Investment securities(2) |
1,152 | (813 | ) | 339 | 630 | 46 | 676 | |||||||||||
| Federal funds sold |
55 | (908 | ) | (853 | ) | (594 | ) | 129 | (465 | ) | ||||||||
| Interest-bearing deposits in other financial institutions |
48 | (154 | ) | (106 | ) | 10 | 10 | 20 | ||||||||||
| Total interest income(2) |
28,254 | (60,148 | ) | (31,894 | ) | 32,562 | (5,552 | ) | 27,010 | |||||||||
| Interest expense |
||||||||||||||||||
| Deposits |
11,188 | (52,195 | ) | (41,007 | ) | 6,896 | 6,143 | 13,039 | ||||||||||
| Notes payable and other borrowings |
31,581 | (32,906 | ) | (1,325 | ) | 19,197 | (15,511 | ) | 3,686 | |||||||||
| Total interest expense |
42,769 | (85,101 | ) | (42,332 | ) | 26,093 | (9,368 | ) | 16,725 | |||||||||
| Net interest income(2) |
$(14,515 | ) | $ 24,953 | $ 10,438 | $ 6,469 | $ 3,816 | $10,285 | |||||||||||
| (1) | Changes attributable to both volume and yield/rate are included in yield/rate. |
| (2) | Taxable equivalent. |
Net interest income increased $10.4 million in 2008 compared with 2007. Changes in yields earned and rates paid contributed $24.9 million to the increase in net interest income, due to falling interest rates paid on deposits. Yields on the loan portfolio decreased as well, but not as quickly as rates paid on deposits. Yields on the majority of variable rate loans decreased to their respective rate floors, while rates paid on deposits continued to decline. Changes in the average balance of interest-earning assets, primarily in the loan portfolio, and interest-bearing liabilities reduced net interest income by $14.5 million. The average balance of interest-bearing liabilities grew faster than the average balance of the loan portfolio.
Net interest income in 2007 increased $10.3 million compared with 2006. Changes in the volume of interest-earning assets, primarily loan growth, contributed $32.6 million to the change in net interest income, while changes in the volume of interest-bearing liabilities reduced net interest income by $26.1 million. Increased borrowing from the Federal Home Loan Bank and the Federal Reserve Bank was the primary factor in the increase in interest-bearing liabilities. The borrowings increased due to favorable pricing relative to the brokered deposit market.
Provision for loan losses
The banking segment’s provision for loan losses was $22.8 million for the year ended December 31, 2008, $5.5 million for the year ended December 31, 2007, and $5.0 million for the year ended December 31, 2006. The $17.3 million increase in 2008 compared with 2007 was primarily a result of a significant increase in non-performing loans due to the challenging economic conditions in our market areas. The provision for loan losses increased $0.5 million for
61
Table of Contents
Index to Financial Statements
the year ended December 31, 2007 compared with the year ended December 31, 2006. Additional information regarding the allowance for loan losses can be found in the “Years ended December 31, 2008, 2007 and 2006—Allowance for loan losses” section below.
Noninterest expense
The following table summarizes the banking segment’s noninterest expense for the years ended December 31, 2008, 2007 and 2006 (in thousands).
| Year ended December 31, | ||||||||||||||
| Variance | ||||||||||||||
| 2008 | 2007 | 2006 | 2008 v. 2007 | 2007 v. 2006 | ||||||||||
| Noninterest expense |
||||||||||||||
| Employees’ compensation and benefits |
$43,977 | $40,920 | $35,964 | $3,057 | $4,956 | |||||||||
| Occupancy and equipment, net |
16,877 | 15,407 | 14,840 | 1,470 | 567 | |||||||||
| Professional services |
5,835 | 6,152 | 6,245 | (317 | ) | (93 | ) | |||||||
| Deposit insurance premium |
1,564 | 441 | 267 | 1,123 | 174 | |||||||||
| Repossession and foreclosure |
2,644 | (244 | ) | (2,721 | ) | 2,888 | 2,477 | |||||||
| Other |
13,601 | 13,457 | 13,971 | 144 | (514 | ) | ||||||||
| Total noninterest expense |
$84,498 | $76,133 | $68,566 | $8,365 | $7,567 | |||||||||
Noninterest expense increased $8.4 million, or 11.0%, compared with the year ended December 31, 2007 while noninterest expense for 2007 increased $7.6 million, or 11.0%, compared to 2006. Employees’ compensation and benefits and repossession and foreclosure expenses were the primary contributors to these increases, although there were increases in most noninterest expense categories.
Employees’ compensation and benefits increased $3.1 million, or 7.5%, for the year ended December 31, 2008 compared to 2007. The increase was attributable to normal annual merit increases, increased staffing levels and higher health insurance costs. For the year ended December 31, 2007, employees’ compensation and benefits increased $5.0 million, or 13.8%, compared with the year ended December 31, 2006. The increase was primarily related to the increase in staffing levels to support added locations in 2007, as well as higher health insurance costs.
Repossession and foreclosure expenses increased $2.9 million for the year ended December 31, 2008 compared to a net recovery of $0.2 million for the year ended December 31, 2007. The increase was primarily due to costs incurred to complete construction on the increased volume of foreclosed real estate that exceeded the appraised value of the completed construction. For the year ended December 31, 2007, repossession and foreclosure expenses increased $2.5 million compared to 2006, which was attributable to a significant gain on the sale of repossessed property recorded in 2006.
Occupancy and equipment expenses, net of rental income, increased $1.5 million, or 9.5%, for the year ended December 31, 2008 compared to 2007, reflecting increases in the number of branches. Deposit insurance premiums increased $1.1 million over 2007 due primarily to increased rates imposed by the FDIC. See the section entitled “Management’s discussion and analysis of financial condition and results of operations—Liquidity and capital resources”. Occupancy and equipment expenses, net of rental income, were comparable in 2007 and 2006.
62
Table of Contents
Index to Financial Statements
Mortgage origination segment
Noninterest income
Noninterest income was $93.2 million for the year ended December 31, 2008 compared with $59.0 million in 2007, an increase of $34.2 million, or 58.0%. Increased income from loan originations and net gains on the sale of loans accounted for substantially all of the change in noninterest income. The increase resulted from higher mortgage loan origination volume and a shift in the composition of mortgage loan originations toward government guaranteed mortgages that have a higher value in the secondary market.
Noninterest income decreased by $21.0 million, or 26.3%, during the year ended December 31, 2007 to $59.0 million compared to $80.0 million in 2006. The decrease was primarily due to a decrease in loan originations resulting in reduced gains on the sale of loans.
Noninterest expense
The following table summarizes the mortgage origination segment’s noninterest expense for the years ended December 31, 2008, 2007 and 2006 (in thousands).
| Year ended December 31, | |||||||||||
| Variance | |||||||||||
| 2008 | 2007 | 2006 | 2008 v. 2007 | 2007 v. 2006 | |||||||
| Noninterest expense |
|||||||||||
| Employees’ compensation and benefits |
$56,742 | $42,210 | $58,680 | $14,532 | $(16,470 | ) | |||||
| Occupancy and equipment, net |
8,849 | 6,588 | 9,984 | 2,261 | (3,396 | ) | |||||
| Professional services |
4,320 | 2,442 | 5,273 | 1,878 | (2,831 | ) | |||||
| Repossession and foreclosure |
746 | 719 | 495 | 27 | 224 | ||||||
| Other |
12,789 | 6,178 | 7,415 | 6,611 | (1,237 | ) | |||||
| Total noninterest expense |
$83,446 | $58,137 | $81,847 | $25,309 | $(23,710 | ) | |||||
Noninterest expense increased $25.3 million, or 43.5%, compared with the year ended December 31, 2007. Employees’ compensation and benefits and occupancy and equipment expenses, net of rental income, were the primary contributors to the increase, although the mortgage origination segment experienced increases in all noninterest expense categories. Noninterest expense decreased $23.7 million, or 29.0%, compared to 2006. The majority of the decrease related to employees’ compensation and benefits, although the mortgage origination segment experienced decreases in most of the noninterest expense categories.
Employees’ compensation and benefits increased $14.5 million, or 34.4%, for the year ended December 31, 2008 compared to 2007. The increase was attributable to increased staffing levels for the 24 additional mortgage banking offices, as well as higher commission costs due to the increase in sales volume. Employees’ compensation and benefits decreased $16.5 million, or 28.1%, for the year ended December 31, 2007 compared with the year ended December 31, 2006, which was attributable to lower commission costs due to the decline in sales volume.
Occupancy and equipment expenses, net of rental income, increased $2.3 million, or 34.3%, for the year ended December 31, 2008 compared to 2007. The increase was due to costs incurred on the additional offices added during 2008. Occupancy and equipment expenses, net of rental
63
Table of Contents
Index to Financial Statements
income, decreased $3.4 million, or 34.0%, for the year ended December 31, 2007 compared to the year ended December 31, 2006, which was primarily a result of lease termination costs in 2006.
Professional services increased $1.9 million, or 76.9%, for the year ended December 31, 2008 compared to 2007, reflecting increases in the volume of mortgage loans originated. This expense category decreased $2.8 million, or 53.7%, for the year ended December 31, 2007 compared with the year ended December 31, 2006, which related to lower appraisal costs due to the decline in the real estate market.
Other expenses increased $6.6 million for the year ended December 31, 2008 compared to the year ended December 31, 2007, primarily due to the increase in unreimbursed closing costs on loans and funding fees for loan closing costs and originations. Other expenses decreased $1.2 million for the year ended December 31, 2007 compared to 2006, primarily due to decreases in various expenses that fluctuate with changes in the volume of loan originations.
Financial condition
The following discussion contains a more detailed analysis of our financial condition as of December 31, 2008, 2007 and 2006.
Loan portfolio
Loans held for investment are detailed in the table below (in thousands) and classified by type.
| December 31, | |||||||||||||||
| 2008 | 2007 | 2006 | 2005 | 2004 | |||||||||||
| Commercial and industrial |
$1,262,456 | $1,028,332 | $ 797,471 | $ 744,725 | $ 567,500 | ||||||||||
| Lease financing |
101,902 | 148,780 | 183,219 | 169,536 | 126,722 | ||||||||||
| Construction and land development |
585,320 | 704,321 | 597,408 | 411,077 | 372,173 | ||||||||||
| Real estate |
839,099 | 678,618 | 588,563 | 598,511 | 541,282 | ||||||||||
| Securities (including margin loans) |
129,638 | 4,696 | 4,583 | 4,707 | 5,530 | ||||||||||
| Consumer |
51,091 | 36,082 | 35,458 | 31,108 | 38,549 | ||||||||||
| Loans, gross |
2,969,506 | 2,600,829 | 2,206,702 | 1,959,664 | 1,651,756 | ||||||||||
| Unearned income |
(3,887 | ) | (3,467 | ) | (3,683 | ) | (3,598 | ) | (3,513 | ) | |||||
| Allowance for loan losses |
(40,672 | ) | (26,517 | ) | (24,722 | ) | (22,666 | ) | (22,086 | ) | |||||
| Loans, net |
$2,924,947 | $2,570,845 | $2,178,297 | $1,933,400 | $1,626,157 | ||||||||||
The amounts in the table above represent loans held in our banking and financial advisory segments. A discussion of loans in each of those segments follows.
Banking segment
Total loans, net of the allowance for loan losses, were $2.8 billion, $2.6 billion and $2.2 billion as of December 31, 2008, 2007, and 2006, respectively. The $255.9 million increase in net loans at
64
Table of Contents
Index to Financial Statements
December 31, 2008 compared with December 31, 2007, was primarily attributable to growth in commercial and industrial and real estate loans. For 2007 compared to 2006, loans increased $390.6 million, primarily due to growth in commercial and industrial, real estate, and construction and land development loans.
The banking segment generally does not participate in syndicated loan transactions and has no foreign loans in its portfolio. At December 31, 2008, the banking segment had loan concentrations (loans to borrowers engaged in similar activities) which exceeded 10% of total loans in its real estate loan portfolio. The areas of concentration within our real estate portfolio were construction and land development loans and non-construction commercial real estate loans. At December 31, 2008, construction and land development loans were 20% of total loans, while non-construction commercial real estate loans were 18% of total loans.
The following table provides information regarding the maturities of certain of the banking segment’s loans held for investment, excluding unearned income (in thousands). Non-accrual loans included in the table below were $44.9 million at December 31, 2008.
| December 31, 2008 | ||||||||
| Due within one year |
Due from one to five years |
Due after five years |
Total | |||||
| Commercial and industrial |
$ 964,769 | $288,182 | $ 37,027 | $1,289,978 | ||||
| Real estate (including construction and land development) |
816,016 | 373,036 | 236,447 | 1,425,499 | ||||
| Total |
$1,780,785 | $661,218 | $273,474 | $2,715,477 | ||||
| Fixed rate loans |
$1,131,048 | $617,370 | $273,029 | $2,021,447 | ||||
| Floating rate loans |
649,737 | 43,848 | 445 | 694,030 | ||||
| Total |
$1,780,785 | $661,218 | $273,474 | $2,715,477 | ||||
In the table above, variable rate loans that have reached their applicable rate floor or ceiling are classified as fixed rate loans and not floating rate loans. Of the floating rate loans in the table above, approximately 90.9% carry an interest rate tied to the Wall Street Journal Prime Rate, as published in the Wall Street Journal.
Mortgage origination segment
The loan portfolio of the mortgage origination segment consists of loans held for sale, primarily single-family residential mortgages funded through PrimeLending. Total loans were $192.3 million and $74.2 million as of December 31, 2008 and 2007, respectively. The $118.1 million increase in net loans at December 31, 2008 compared with December 31, 2007, was primarily attributable to internally-generated growth, market conditions that led to increased refinancing activity, and increased market share at PrimeLending. PrimeLending was able to service the increased demand for refinancings due to the availability of warehouse financing through our banking segment. Total loans decreased $26.9 million in 2007 compared to 2006, which was primarily due to the decline in the real estate market.
Financial advisory segment
The loan portfolio within the financial advisory segment is held by First Southwest and consists primarily of margin loans to customers and correspondents. These loans are collateralized by the
65
Table of Contents
Index to Financial Statements
securities purchased or by other securities owned by the clients and, because of collateral coverage ratios, are believed to present minimal collectability exposure. Additionally, these loans are subject to a number of regulatory requirements as well as First Southwest’s internal policies. Total loans were $126.8 million as of the merger on December 31, 2008.
Allowance for loan losses
While we believe we have sufficient allowance for our existing portfolio as of December 31, 2008, additional provisions for losses on existing loans may be necessary in the future. The allowance for loan losses totaled $40.7 million, $26.5 million, and $24.7 million at December 31, 2008, 2007, and 2006 respectively. The $14.2 million increase in 2008 was primarily due to an increase in non-performing loans. The ratio of the allowance for loan losses to total loans outstanding at December 31, 2008, 2007, and 2006 was 1.4%, 1.0% and 1.1% respectively. As of December 31, 2008, we had no material delinquencies in homogenous loans, such as consumer installment, residential mortgage loans, and home equity loans.
The following table presents the activity in our allowance for loan losses for the years indicated (dollar amounts in thousands). Substantially all of the activity shown below occurred in the banking segment.
| For the years ended December 31, | |||||||||||||||
| 2008 | 2007 | 2006 | 2005 | 2004 | |||||||||||
| Balance at beginning of period |
$26,517 | $24,722 | $22,666 | $22,086 | $21,580 | ||||||||||
| Provisions charged to operating expenses |
22,818 | 5,517 | 5,049 | 5,516 | 2,604 | ||||||||||
| Recoveries of loans previously charged off |
|||||||||||||||
| Commercial and industrial |
1,605 | 974 | 804 | 892 | 915 | ||||||||||
| Real estate |
— | 114 | — | 3 | — | ||||||||||
| Construction and land development |
29 | 100 | — | 305 | 14 | ||||||||||
| Lease financing |
30 | 11 | 11 | 46 | — | ||||||||||
| Consumer |
51 | 231 | 47 | 44 | 53 | ||||||||||
| Total recoveries |
1,715 | 1,430 | 862 | 1,290 | 982 | ||||||||||
| Loans charged off |
|||||||||||||||
| Commercial and industrial |
9,445 | 4,044 | 2,022 | 2,383 | 2,452 | ||||||||||
| Real estate |
305 | 143 | 762 | 3,025 | 114 | ||||||||||
| Construction and land development |
1,095 | 697 | 50 | — | 305 | ||||||||||
| Lease financing |
580 | 132 | 405 | 630 | 36 | ||||||||||
| Consumer |
233 | 136 | 616 | 188 | 173 | ||||||||||
| Total charge-offs |
11,658 | 5,152 | 3,855 | 6,226 | 3,080 | ||||||||||
| Net charge-offs |
(9,943 | ) | (3,722 | ) | (2,993 | ) | (4,936 | ) | (2,098 | ) | |||||
| Allowance for losses on margin loans from FSW acquisition |
1,280 | — | — | — | — | ||||||||||
| Balance at end of period |
$40,672 | $26,517 | $24,722 | $22,666 | $22,086 | ||||||||||
| Net charge-offs to average loans outstanding |
0.37% | 0.15% | 0.14% | 0.24% | 0.12% | ||||||||||
66
Table of Contents
Index to Financial Statements
The distribution of the allowance for loan losses among loan types and the percentage of the loans for that type to gross loans, excluding unearned income, are presented in the table below (dollar amounts in thousands). Amounts shown in “Unallocated” include the portion of the allowance that is attributable to factors that cannot be distributed by type of loan. Those factors include credit concentrations, trends in loan growth, and various other market, economic and regulatory considerations.
| December 31, | ||||||||||||||||||||
| 2008 | 2007 | 2006 | 2005 | 2004 | ||||||||||||||||
| Reserve | % of gross loans |
Reserve | % of gross loans |
Reserve | % of gross loans |
Reserve | % of gross loans |
Reserve | % of gross loans | |||||||||||
| Commercial and industrial |
$27,641 | 42.51% | $ 8,849 | 39.54% | $ 7,866 | 36.14% | $ 7,293 | 38.00% | $ 3,864 | 33.63% | ||||||||||
| Real estate (including construction and land development) |
4,928 | 47.97% | 2,348 | 53.17% | 3,032 | 53.74% | 2,756 | 51.52% | 1,668 | 55.66% | ||||||||||
| Lease financing |
1,152 | 3.43% | 1,012 | 5.72% | 1,212 | 8.30% | 1,028 | 8.65% | 427 | 8.03% | ||||||||||
| Securities (including margin loans) |
1,280 | 4.37% | — | 0.18% | — | 0.21% | — | 0.24% | — | 0.31% | ||||||||||
| Consumer |
377 | 1.72% | 257 | 1.39% | 606 | 1.61% | 167 | 1.59% | 127 | 2.37% | ||||||||||
| Unallocated |
5,294 | 14,051 | 12,006 | 11,422 | 16,000 | |||||||||||||||
| Total |
$40,672 | 100.00% | $26,517 | 100.00% | $24,722 | 100.00% | $22,666 | 100.00% | $22,086 | 100.00% | ||||||||||
Potential problem loans
As of December 31, 2008, we had four potential problem loans totaling $15.5 million, which are not included in either the non-accrual or 90 days past due loan categories.
Non-performing assets
The following table presents our components of non-performing assets at the dates indicated (dollar amounts in thousands).
| December 31, | ||||||||||
| 2008 | 2007 | 2006 | 2005 | 2004 | ||||||
| Loans accounted for on a non-accrual basis |
||||||||||
| Commercial and industrial |
$32,919 | $ 9,953 | $ 5,238 | $ 1,126 | $ 2,047 | |||||
| Lease financing |
1,388 | 1,955 | 216 | — | — | |||||
| Construction and land development |
6,870 | 2,534 | 1,793 | 15,119 | 1,011 | |||||
| Real estate |
5,149 | 2,773 | 3,622 | 2,556 | 362 | |||||
| Consumer |
492 | 25 | 32 | 177 | 49 | |||||
| $46,818 | $17,240 | $10,901 | $18,978 | $ 3,469 | ||||||
| Non-performing loans as a percentage of total loans |
1.48% | 0.64% | 0.47% | 0.88% | 0.19% | |||||
| Loans past due 90 days or more, not included above |
$ 3,928 | $ 1,263 | $ 2,409 | $ 20 | $ 971 | |||||
| Other Real Estate Owned |
$ 9,637 | $ 6,355 | $ 3,244 | $ 2,453 | $ 8,760 | |||||
| Non-performing assets |
$60,383 | $24,858 | $16,554 | $21,451 | $13,200 | |||||
| Non-performing assets as a percentage of total assets |
1.53% | 0.78% | 0.57% | 0.80% | 0.54% | |||||
67
Table of Contents
Index to Financial Statements
At December 31, 2008, total non-performing assets increased $35.5 million to $60.4 million compared to the year ended December 31, 2007. Non-accrual loans increased by $29.6 million to $46.8 million for the year ended December 31, 2008 compared to 2007. Of these non-accrual loans, $32.9 million were characterized as commercial and industrial loans. This amount included approximately $28.9 million in business loans for investment properties arising primarily from a single customer relationship and secured principally by the inventory and property, plant and equipment of a group of related borrowers. Loans to these related borrowers totaled approximately $29.4 million and $29.3 million at December 31, 2008 and 2007, respectively. During the second quarter of 2008, we determined that these borrowers’ cash flow from operations would be insufficient to meet interest payments as they became due. In addition, we became uncertain of the timing of cash flows from anticipated asset sales to third parties that could be used to service these loans. As a result, we placed these loans on non-accrual status. Subsequently, we obtained updated appraisals of the collateral securing these loans and continued to review the loan relationship for impairment on a periodic basis. When appropriate, we made provision for expected losses on the loans. Specific reserves for this loan relationship were $17.0 million and $2.8 million at December 31, 2008 and 2007, respectively.
Non-accrual loans at December 31, 2008 also included $6.9 million in construction and land development, which consisted primarily of residential real estate development loans secured by fully-developed residential lots and unimproved land. Other Real Estate Owned increased $3.3 million to $9.6 million at December 31, 2008 compared to 2007. This included $7.3 million of commercial real estate property consisting of single family residences and $1.0 million of residential lots at various levels of completion. The increase in Other Real Estate Owned was due primarily to the economic downturn in the housing market during 2008. Total non-performing assets increased $8.3 million to $24.9 million for the year ended December 31, 2007 compared to the year ended December 31, 2006. The increase related primarily to the $6.3 million increase in non-accrual loans during 2007. Within this category, commercial and industrial loans made up the majority of the increase, which loans increased by $4.7 million for the year ended December 31, 2007 compared to 2006. Other Real Estate Owned increased $3.1 million to a balance of $6.4 million at December 31, 2007 compared to 2006. Of the December 31, 2007 balance, $5.4 million consisted primarily of commercial real estate properties.
Additional interest income that would have been recorded if the non-accrual loans had been current during the years ended December 31, 2008, 2007 and 2006 totaled $3.3 million, $1.3 million, and $0.6 million respectively.
68
Table of Contents
Index to Financial Statements
Securities
The table below summarizes our securities portfolio (in thousands).
| December 31, | ||||||
| 2008 | 2007 | 2006 | ||||
| Securities available-for-sale, at fair value |
||||||
| U. S. Treasury securities |
$ 11,953 | $ — | $ — | |||
| U. S. government agency obligations |
10,038 | 18,000 | 17,666 | |||
| Mortgage-backed securities |
35,439 | 36,039 | 28,174 | |||
| Collateralized mortgage obligations |
68,515 | 32,637 | 35,813 | |||
| Auction rate bonds |
40,612 | — | — | |||
| 166,557 | 86,676 | 81,653 | ||||
| Securities held-to-maturity, at amortized cost |
||||||
| Mortgage-backed securities |
19,982 | 23,026 | 29,430 | |||
| Collateralized mortgage obligations |
29,030 | 29,520 | 30,987 | |||
| States and political subdivisions |
57,228 | 51,953 | 45,005 | |||
| Auction rate bonds |
110,969 | — | — | |||
| Other |
— | — | 150 | |||
| 217,209 | 104,499 | 105,572 | ||||
| Trading securities, at fair value |
1,561 | — | — | |||
| Total securities portfolio |
$385,327 | $191,175 | $187,225 | |||
We hold securities of two issuers that exceed 10% of our shareholders’ equity. The issuers are Indiana Secondary Market for Education Loans, Inc. and Access to Loans for Learning Student Loan Corporation, which have an aggregate book value and aggregate market value of $40.6 million and an aggregate book value and aggregate market value of $111.0 million, respectively, as of December 31, 2008. See our risk factor entitled “Financial markets are susceptible to disruptive events that may lead to little or no liquidity for auction rate bonds”. We had a net unrealized gain of $1.1 million related to the available-for-sale investment portfolio at December 31, 2008, compared with a net unrealized loss of $2.9 million at December 31, 2007 and $2.2 million at December 31, 2006 respectively.
The market value of securities held-to-maturity at December 31, 2008 was $0.2 million below book value. At December 31, 2007, market value of held-to-maturity securities was $1.9 million below book value. The market value of held-to-maturity securities was $0.8 million below book value at December 31, 2006.
69
Table of Contents
Index to Financial Statements
The following table sets forth the estimated maturities of securities, based on current performance. Contractual maturities may be different (dollar amounts in thousands, yields are tax-equivalent).
| December 31, 2008 | ||||||||||
| One year or less |
One year to five years |
Five years to ten years |
Greater than ten years |
Total | ||||||
| U. S. Treasury securities |
||||||||||
| Amortized cost |
$11,920 | $ — | $ — | $ — | $ 11,920 | |||||
| Fair value |
11,953 | — | — | — | 11,953 | |||||
| Weighted average yield |
1.32% | 0.00% | 0.00% | 0.00% | 1.32% | |||||
| U. S. government agency obligations |
||||||||||
| Amortized cost |
— | 10,000 | — | — | 10,000 | |||||
| Fair value |
— | 10,038 | — | — | 10,038 | |||||
| Weighted average yield |
0.00% | 3.57% | 0.00% | 0.00% | 3.57% | |||||
| Mortgage-backed securities |
||||||||||
| Amortized cost |
— | 33,508 | 16,260 | 5,249 | 55,017 | |||||
| Fair value |
— | 34,403 | 16,659 | 4,943 | 56,005 | |||||
| Weighted average yield |
0.00% | 5.21% | 5.43% | 5.47% | 5.30% | |||||
| Collateralized mortgage obligations |
||||||||||
| Amortized cost |
— | 15,295 | 58,945 | 22,638 | 96,878 | |||||
| Fair value |
— | 15,292 | 59,308 | 23,000 | 97,600 | |||||
| Weighted average yield |
0.00% | 5.14% | 4.94% | 5.64% | 5.13% | |||||
| States and political subdivisions |
||||||||||
| Amortized cost |
1,305 | 2,488 | 12,493 | 40,942 | 57,228 | |||||
| Fair value |
1,330 | 2,629 | 12,557 | 39,882 | 56,398 | |||||
| Weighted average yield |
5.73% | 6.29% | 6.42% | 6.54% | 6.49% | |||||
| Total securities portfolio |
||||||||||
| Amortized cost |
$13,225 | $61,291 | $87,698 | $68,829 | $231,043 | |||||
| Fair value |
13,283 | 62,362 | 88,524 | 67,825 | 231,994 | |||||
| Weighted average yield |
1.75% | 4.96% | 5.24% | 6.16% | 5.24% | |||||
As of December 31, 2008, we acquired $151.6 million of auction rate bonds that are not included in the table above. These securities mature in more than 10 years.
Deposits
Banking segment
The banking segment’s major source of funds and liquidity is its deposit base. Deposits provide funding for its investment in loans and securities. Interest paid for deposits must be managed carefully to control the level of interest expense.
The mix of the deposit base (time deposits versus interest-bearing and noninterest-bearing demand deposits and savings) is constantly changing due to the banking segment’s needs and market conditions. Overall, average deposits at December 31, 2008 were $24.2 million, or 1.0%, higher than average deposits at December 31, 2007. Average noninterest-bearing demand
70
Table of Contents
Index to Financial Statements
deposits at December 31, 2008 decreased $235.7 million from December 31, 2007 levels, while average interest-bearing demand deposits increased $416.6 million compared to 2007. The change in composition is attributable to a Bank program, begun in January 2008, which sweeps demand deposits into money market accounts and reduces the amount of reserves the Bank is required to carry for regulatory purposes.
Average deposits for the year ended December 31, 2007 increased $152.3 million, or 6.7%, compared to 2006. Average noninterest-bearing deposits, savings, certificates of deposit, and foreign deposits increased $0.2 million, $9.5 million, $109.1 million, and $67.8 million, respectively, while average interest bearing demand deposits decreased $34.3 million during the year ended December 31, 2007 as compared to 2006. The average cost of deposits increased in 2007 mainly due to higher market rates.
At December 31, 2008, we had approximately $136.5 million in interest bearing time deposits of $100,000 or more in our Cayman Islands branch.
The table below presents the banking segment’s average balances of deposits and the average rates paid on those deposits for the years ended December 31, 2008, 2007 and 2006 (dollar amounts in thousands).
| Year ended December 31, | ||||||||||||
| 2008 | 2007 | 2006 | ||||||||||
| Average balance |
Average rate paid |
Average balance |
Average rate paid |
Average balance |
Average rate paid | |||||||
| Noninterest-bearing demand deposits |
$ 234,342 | — | $ 470,046 | — | $ 469,862 | — | ||||||
| Interest-bearing demand deposits |
915,455 | 0.93% | 498,815 | 3.44% | 533,153 | 3.36% | ||||||
| Savings deposits |
160,855 | 2.00% | 165,650 | 4.05% | 156,141 | 3.93% | ||||||
| Certificates of deposit |
940,976 | 3.42% | 1,111,435 | 5.07% | 1,002,340 | 4.63% | ||||||
| Foreign deposits |
212,833 | 2.11% | 194,341 | 4.76% | 126,515 | 4.73% | ||||||
| $2,464,461 | 1.97% | $2,440,287 | 3.67% | $2,288,011 | 3.34% | |||||||
The maturity of interest bearing time deposits of $100,000 or more as of December 31, 2008 is set forth in the table below (in thousands).
| December 31, 2008 | ||
| Months to maturity: |
||
| 3 months or less |
$251,825 | |
| 3 months to 6 months |
67,184 | |
| 6 months to 12 months |
97,563 | |
| Over 12 months |
150,577 | |
| $567,149 | ||
The banking segment experienced growth of $76.6 million, or 15.6%, in interest bearing time deposits of $100,000 or more for the year ended December 31, 2008 compared to 2007. At December 31, 2008, there were $416.6 million in interest bearing time deposits of $100,000 or more scheduled to mature within one year.
71
Table of Contents
Index to Financial Statements
Financial advisory segment
The financial advisory segment’s deposit portfolio is held by First Southwest and consists of interest bearing and non-interest bearing demand accounts used to finance customer transactions. Total deposits were $82.1 million as of December 31, 2008.
Borrowings
Our borrowings as of December 31, 2008, 2007 and 2006 are shown in the table below (in thousands).
| December 31, | |||||||||||
| Variance | |||||||||||
| 2008 | 2007 | 2006 | 2008 v. 2007 | 2007 v. 2006 | |||||||
| Short-term borrowings |
$256,452 | $413,060 | $ 44,977 | $(156,608 | ) | $368,083 | |||||
| Notes payable |
151,014 | 40,256 | 35,860 | 110,758 | 4,396 | ||||||
| Junior subordinated debentures |
67,012 | 51,548 | 51,548 | 15,464 | — | ||||||
| Other borrowings |
12,075 | 7,240 | 6,324 | 4,835 | 916 | ||||||
| $486,553 | $512,104 | $138,709 | $ (25,551 | ) | $373,395 | ||||||
Short-term borrowings consist of federal funds purchased and securities sold under agreements to repurchase, as well as borrowings at the Federal Home Loan Bank and the Federal Reserve Bank. The $156.6 million decrease in short-term borrowings at December 31, 2008 compared with December 31, 2007, was attributable to the maturity of approximately $250.0 million in Federal Home Loan Bank notes, partially offset by the $75.4 million increase in federal funds and securities sold under agreements to repurchase. Short-term borrowings increased $368.1 million at December 31, 2007 compared to 2006. The increase was attributable to a shift in the funding of the Bank from brokered deposits to borrowings from the Federal Home Loan Bank and the Federal Reserve Bank, which allowed the Bank to obtain favorable pricing relative to the brokered deposit market.
Notes payable consisted primarily of our borrowing facilities with third party lenders. The increase in notes payable at December 31, 2008 compared with December 31, 2007, reflects borrowings made to enhance capital ratios at the Bank. PlainsCapital had $4.4 million of additional borrowing capacity under revolving lines of credit at December 31, 2008.
The increase in junior subordinated debentures shown in the table above reflects our issuance of $15.5 million of junior subordinated debentures by to PCC Statutory Trust IV, which we formed in February 2008. The trust was created for the sole purpose of issuing and selling preferred and common securities, the proceeds of which were used to purchase our junior subordinated debentures.
72
Table of Contents
Index to Financial Statements
Quarterly results
| Three months ended | |||||||||
| (in thousands, except per share data) | September 30, 2009 |
June 30, 2009 |
March 31, 2009 | ||||||
| Interest income |
$ | 51,440 | $ | 50,872 | $ | 47,634 | |||
| Interest expense |
10,830 | 9,885 | 11,277 | ||||||
| Net interest income |
40,610 | 40,987 | 36,357 | ||||||
| Provision for loan losses |
14,310 | 10,750 | 14,013 | ||||||
| Noninterest income |
86,389 | 91,465 | 70,566 | ||||||
| Noninterest expense |
97,414 | 96,739 | 77,282 | ||||||
| Net income before taxes |
15,275 | 24,963 | 15,628 | ||||||
| Income tax provision |
5,523 | 8,866 | 5,602 | ||||||
| Net income |
9,752 | 16,097 | 10,026 | ||||||
| Less: Net income attributable to noncontrolling interest |
70 | 33 | 23 | ||||||
| Net income attributable to PlainsCapital Corporation |
$ | 9,682 | $ | 16,064 | $ | 10,003 | |||
| Earnings per common share |
|||||||||
| Basic |
$ | 0.27 | $ | 0.47 | $ | 0.27 | |||
| Diluted |
0.25 | 0.44 | 0.26 | ||||||
| Year ended December 31, 2008 | |||||||||||||
| (in thousands, except per share data) | Fourth quarter |
Third quarter |
Second quarter |
First quarter | |||||||||
| Interest income |
$ | 46,469 | $ | 46,663 | $ | 47,182 | $ | 53,078 | |||||
| Interest expense |
13,902 | 15,124 | 15,839 | 21,204 | |||||||||
| Net interest income |
32,567 | 31,539 | 31,343 | 31,874 | |||||||||
| Provision for loan losses |
15,000 | 2,635 | 2,883 | 2,300 | |||||||||
| Noninterest income |
32,357 | 31,444 | 27,933 | 27,332 | |||||||||
| Noninterest expense |
50,583 | 47,588 | 43,680 | 44,434 | |||||||||
| Net income (loss) before taxes |
(659 | ) | 12,760 | 12,713 | 12,472 | ||||||||
| Income tax provision (benefit) |
(723 | ) | 4,582 | 4,523 | 4,343 | ||||||||
| Net income |
64 | 8,178 | 8,190 | 8,129 | |||||||||
| Less: Net income attributable to noncontrolling interest |
203 | 52 | 84 | 98 | |||||||||
| Net income (loss) attributable to PlainsCapital Corporation |
$ | (139 | ) | $ | 8,126 | $ | 8,106 | $ | 8,031 | ||||
| Earnings (loss) per common share |
|||||||||||||
| Basic |
$ | (0.01 | ) | $ | 0.31 | $ | 0.31 | $ | 0.31 | ||||
| Diluted |
(0.01 | ) | 0.31 | 0.31 | 0.30 | ||||||||
73
Table of Contents
Index to Financial Statements
| Year ended December 31, 2007 | ||||||||
| (in thousands, except per share data) | Fourth quarter |
Third quarter |
Second quarter |
First quarter | ||||
| Interest income |
$56,931 | $57,238 | $55,009 | $51,717 | ||||
| Interest expense |
26,385 | 27,772 | 26,184 | 24,464 | ||||
| Net interest income |
30,546 | 29,466 | 28,825 | 27,253 | ||||
| Provision for loan losses |
2,154 | 300 | 1,645 | 1,418 | ||||
| Noninterest income |
20,726 | 20,459 | 21,519 | 21,577 | ||||
| Noninterest expense |
37,922 | 38,621 | 36,640 | 37,632 | ||||
| Net income before taxes |
11,196 | 11,004 | 12,059 | 9,780 | ||||
| Income tax provision |
3,329 | 3,894 | 4,338 | 3,343 | ||||
| Net income |
7,867 | 7,110 | 7,721 | 6,437 | ||||
| Less: Net income attributable to noncontrolling interest |
159 | 163 | 112 | 109 | ||||
| Net income attributable to PlainsCapital Corporation |
$ 7,708 | $ 6,947 | $ 7,609 | $ 6,328 | ||||
| Earnings per common share |
||||||||
| Basic |
$ .30 | $ .27 | $ .29 | $ .24 | ||||
| Diluted |
.29 | .27 | .29 | .24 | ||||
Liquidity and capital resources
Liquidity refers to the measure of our ability to meet our customers’ short-term and long-term deposit withdrawals and anticipated and unanticipated increases in loan demand without penalizing earnings. Interest rate sensitivity involves the relationships between rate-sensitive assets and liabilities and is an indication of the probable effects of interest rate fluctuations on our net interest income. We discuss our management of interest rate and other risks in the following section “Quantitative and qualitative disclosures about market risk”.
Our asset and liability group is responsible for continuously monitoring our liquidity position to ensure that assets and liabilities are managed in a manner that will meet all short-term and long-term cash requirements. Funds invested in short-term marketable instruments, the continuous maturing of other interest-earning assets, cash flows from self-liquidating investments such as mortgage-backed securities and collateralized mortgage obligations, the possible sale of available-for-sale securities, and the ability to securitize certain types of loans provide sources of liquidity from an asset perspective. The liability base provides sources of liquidity through deposits and the maturity structure of short-term borrowed funds. For short-term liquidity needs, we utilize federal fund lines of credit with correspondent banks, securities sold under agreements to repurchase and borrowings under lines of credit with other financial institutions. For intermediate liquidity needs, we utilize advances from the Federal Home Loan Bank and Federal Reserve Bank. To supply liquidity over the longer term, we have access to brokered certificates of deposit, term loans at the Federal Home Loan Bank and Federal Reserve Bank and borrowings under lines of credit with other financial institutions.
On December 19, 2008, we sold 87,631 shares of our Series A Preferred Stock, liquidation preference $1,000 per share, for approximately $87.6 million and 4,382 shares of our Series B Preferred Stock, liquidation preference $1,000 per share, to the U.S. Treasury pursuant to the TARP Capital Purchase Program. The shares of Series B Preferred Stock were issued to the U.S. Treasury for nominal consideration upon the exercise of a warrant issued in conjunction with the
74
Table of Contents
Index to Financial Statements
Series A Preferred Stock. Our total cost to redeem the Series A and Series B Preferred Stock will be equal to the aggregate liquidation preference of the preferred stock, approximately $92.0 million, plus any accrued and unpaid dividends on the Series A and Series B Preferred Stock. The Series A and Series B Preferred Stock are senior to shares of our Original Common Stock and Common Stock with respect to dividends and liquidation preference. Under the terms of the Series A Preferred Stock, we are obligated to pay a 5% per annum cumulative dividend on the stated value of the preferred stock until February 14, 2014 and thereafter at a rate of 9% per annum. As long as shares of the Series A and Series B Preferred Stock remain outstanding, we may not pay dividends to our common shareholders (nor may we repurchase or redeem any shares of our Original Common Stock and Common Stock) unless all accrued and unpaid dividends on the preferred stock have been paid in full. Furthermore, prior to December 19, 2011, unless we have redeemed all of the Series A and Series B Preferred Stock, the consent of the U.S. Treasury will be required to, among other things, increase the amount of dividends paid on our Common Stock. After December 19, 2011 and thereafter until December 19, 2018, the consent of the U.S. Treasury (if it still holds our preferred stock) will be required for any increase in the aggregate Original Common Stock and Common Stock dividends per share greater than 3% per annum. After December 19, 2018, we will be prohibited from paying dividends on or repurchasing any common stock until the preferred stock issued to the U.S. Treasury is redeemed in whole or the U.S. Treasury has transferred all of its preferred stock to third parties. If dividends on the preferred stock are not paid in full for six dividend periods, whether or not consecutive, the U.S. Treasury will have the right to elect two directors to our board of directors until all unpaid cumulative dividends are paid in full. The terms of the Series B Preferred Stock are identical to those described above for the Series A Preferred Stock except that (i) the dividend rate is 9% per annum and (ii) the Series B Preferred Stock may not be redeemed unless all of the Series A Preferred Stock is redeemed. Subject to regulatory approval, we intend to redeem the Series A and Series B Preferred Stock with the proceeds from this offering.
As a member institution of the FDIC, we are required to pay semi-annual deposit insurance premium assessments to the FDIC. During the year ended December 31, 2008, we paid approximately $1.6 million in deposit insurance assessments. Due to the recent failure of several unaffiliated FDIC insurance depository institutions, deposit insurance premium assessments paid by all banks has increased. On October 7, 2008, the board of directors of the FDIC adopted a restoration plan and issued a notice of proposed rulemaking and request for comment that would (i) revise deposit insurance assessment rates, including base assessment rates, to raise assessment revenue required under the restoration plan; (ii) change the way the assessment system differentiates risk among insured institutions to take into account new risk measures; and (iii) make technical and other changes to the rules governing the risk-based assessment system. On May 22, 2009, the FDIC announced that it will levy a special assessment on insured institutions as part of its effort to rebuild the FDIC deposit insurance fund. The special assessment equaled five basis points on each FDIC-insured depository institution’s assets, minus its Tier 1 capital, as of June 30, 2009, resulting in a special assessment to us of approximately $1.8 million, which will be payable on September 30, 2009.
On September 29, 2009, the Board of Directors of the FDIC adopted a Notice of Proposed Rulemaking that would require FDIC-insured institutions, such as the Bank, to prepay on December 30, 2009 their estimated quarterly risk-based assessments for the fourth quarter of 2009 and for all of 2010, 2011 and 2012. In addition, the FDIC voted to adopt a uniform three-basis point increase in assessment rates effective on January 1, 2011. We expect that we may be required to prepay an estimated $14 million on December 30, 2009 for our fourth quarter of
75
Table of Contents
Index to Financial Statements
2009 and all of 2010, 2011 and 2012 FDIC assessments. Our prepaid assessments would be subject to adjustment based upon our assessment base during the prepaid period. As a result of the enhancements to deposit insurance protection and the expectation that there will be further demands on the FDIC’s deposit insurance fund, we expect that our deposit insurance costs may increase further. When the deposit insurance premium assessment rates applicable to us increase, our capital resources will be adversely impacted.
We are subject to various regulatory capital requirements administered by the federal banking agencies. Failure to meet minimum capital requirements may prompt certain actions by regulators that, if undertaken, could have a direct material adverse effect on our financial condition and results of operations. Under capital adequacy guidelines and the regulatory framework for prompt corrective action, we must meet specific capital guidelines that involve quantitative measures of our assets, liabilities, and certain off-balance sheet items as calculated under regulatory accounting practices. Our capital amounts and classification are also subject to qualitative judgments by the regulators about components, risk weightings, and other factors.
At September 30, 2009, we exceeded all regulatory capital requirements and were considered to be “well-capitalized” with a total capital to risk-weighted assets ratio of 13.57%, Tier 1 capital to risk-weighted assets ratio of 11.95% and a Tier 1 capital to average assets, or leverage, ratio of 9.98%. At September 30, 2009, the Bank was also considered to be “well-capitalized”. We discuss regulatory capital requirements in more detail in Note 12 to our unaudited consolidated interim financial statements.
Cash and cash equivalents (consisting of cash and due from banks and federal funds sold), totaled $214.5 million at September 30, 2009, an increase of $90.1 million, or 72.4%, from $124.4 million at September 30, 2008. This increase was primarily due to the increase in net deposits, partially offset by the increase in cash used in our mortgage origination segment’s operations due to higher loan volume. Cash and cash equivalents totaled $114.6 million at December 31, 2008, a decrease of $11.8 million, or 9.4%, from $126.4 million at December 31, 2007. This decrease was primarily due to growth in the loan portfolio and the purchase of securities, partially offset by the increase in our deposits.
Deposit flows, calls of investment securities and borrowed funds, and prepayments of loans and mortgage-backed securities are strongly influenced by interest rates, general and local economic conditions and competition in the marketplace. These factors reduce the predictability of the timing of these sources of funds.
Cash flow used in operations during the first nine months of 2009 was $137.3 million, an increase in cash used of $113.5 million compared with September 30, 2008. Operating cash flow decreased due to higher levels of mortgage originations during the first nine months of 2009 and the operating cash needs of First Southwest, whose operations were included beginning January 1, 2009. Cash used in operating activities during 2008 was $103.0 million, an increase of $38.7 million compared with 2007. Cash used in operating activities increased due to increases in accrued liabilities offset by decreased cash flow from our mortgage origination operations. The increases in accrued liabilities relate primarily to the purchase of auction rate bonds in connection with our acquisition of First Southwest.
Our primary use of funds is for the origination of loans, primarily commercial and industrial loans and real estate loans. Our loan portfolio, excluding loans held for sale, at September 30, 2009, was $3.1 billion, an increase of $87.3 million compared with $3.0 billion at December 31, 2008.
76
Table of Contents
Index to Financial Statements
The increase in net loan originations in the first nine months of 2009 was concentrated in the real estate loan portfolio. Our loan portfolio at December 31, 2008, was $3.0 billion, an increase of $368.7 million compared with $2.6 billion at December 31, 2007. The increases in net loan originations between 2007 and 2006 were concentrated in the real estate and business loan portfolios.
Cash flow used in our investment activities included net purchases of securities for our investment portfolio during the nine months ended September 30, 2009, which were $56.3 million compared with net purchases of $17.9 million during the nine months ended September 30, 2008. The increase in net purchases of securities during the first nine months of 2009 was composed primarily of auction rate bonds acquired in connection with our acquisition of First Southwest. Additionally, collateralized mortgage obligations and municipal securities were purchased to provide collateral for repurchase agreements. We sold approximately $21.3 million of available for sale securities during the first nine months of 2009.
Cash flow from our investment activities included net purchases of securities for our investment portfolio during the year ended December 31, 2008, which were $188.9 million compared with net purchases of $4.9 million during the year ended December 31, 2007. The increase in net purchases of securities in 2008 was composed primarily of auction rate bonds acquired in connection with our acquisition of First Southwest. Additionally, U.S. Treasury Bills, collateralized mortgage obligations and municipal securities were purchased to provide collateral for repurchase agreements. The proceeds from maturities and principal reductions of securities available-for-sale were $25.0 million for the year ended December 31, 2008 compared with $403.0 million in 2007. We did not sell securities during the years ended December 31, 2008, 2007 or 2006.
Cash flows from financing activities were $444.8 million during the first nine months of 2009 compared with $161.3 million in the corresponding period in 2008. The $283.5 million increase is primarily attributable to the net increase in deposits. PlainsCapital had $3.5 million of additional borrowing capacity under revolving lines of credit at September 30, 2009. Cash flows from financing activities were $369.8 million in 2008 compared with $264.8 million in 2007. The $105.0 million increase is primarily attributable to the issuance of preferred stock to the U.S. Treasury pursuant to the TARP Capital Purchase Program and the issuance of junior subordinated debentures to PCC Statutory Trust IV, which we formed in February 2008. We paid dividends on our common stock of $5.3 million, $4.9 million and $4.9 million in 2008, 2007 and 2006, respectively.
We had deposits of $3.2 billion at September 30, 2009, an increase of $323.7 million, or 11.1%, from $2.9 billion at December 31, 2008. Deposit flows are affected by the level of market interest rates, the interest rates and products offered by competitors, the volatility of equity markets and other factors. Within deposits, interest-bearing money market deposits at September 30, 2009 increased by $659.5 million from the December 31, 2008 level. Brokered deposits at September 30, 2009 decreased by $383.1 million from the level at December 31, 2008, resulting from our decision to pursue other sources of funding with more favorable pricing. We had deposits of $2.9 billion at December 31, 2008 compared with $2.4 billion at December 31, 2007, an increase of $532.7 million. The increase was attributable to an increase in brokered deposits resulting from attractive pricing compared with other sources of funding.
At December 31, 2008, there were $1.2 billion in time deposits scheduled to mature within one year. Based on our historical experience and competitive pricing practices, we expect to be able
77
Table of Contents
Index to Financial Statements
to retain or replace a substantial portion of these maturing deposits throughout the remainder of 2009.
Our 15 largest depositors, excluding First Southwest, our indirect wholly-owned subsidiary, accounted for approximately 27% of our total deposits and our five largest depositors, excluding First Southwest, accounted for approximately 15% of our total deposits at September 30, 2009. The loss of one or more of our largest Bank customers, or a significant decline in the deposit balances due to ordinary course fluctuations related to these customers’ businesses, would adversely affect our liquidity and require us to raise deposit rates to attract new deposits, purchase federal funds or borrow funds on a short-term basis to replace such deposits. We have not experienced any liquidity issues to date with respect to brokered deposits or our other large balance deposits and we believe alternative sources of funding are available, albeit currently at slightly higher rates, to more than compensate for the loss of one or more of these customers.
PrimeLending funds the mortgage loans it originates through a warehouse line of credit maintained with the Bank. PrimeLending sells substantially all mortgage loans it originates to various investors in the secondary market with servicing released. As these mortgage loans are sold in the secondary market, PrimeLending pays down its warehouse line of credit with the Bank.
First Southwest relies on its equity capital, short-term bank borrowings, interest and non-interest bearing client credit balances, correspondent deposits and other payables to finance its assets and operations. First Southwest has credit arrangements with commercial banks of up to $140.0 million, which are used to finance securities owned, securities held for correspondent accounts and receivables in customer margin accounts. These credit arrangements are provided on an “as offered” basis and are not committed lines of credit. As such, these lines can be reduced or eliminated at any time by the banks extending the credit. Outstanding balances are due on demand and bear interest at rates indexed to the federal funds rate. At September 30, 2009, First Southwest had borrowed approximately $11.0 million under these arrangements.
The following table sets forth information concerning our contractual obligations (in thousands) at December 31, 2008 for the periods shown:
| December 31, 2008 | ||||||||||
| 2009 | 2010 | 2011-2013 | Thereafter | Total | ||||||
| Short-term borrowings |
$256,452 | $ — | $ — | $ — | $256,452 | |||||
| Long-term debt obligations |
108,383 | 1,534 | — | 108,109 | 218,026 | |||||
| Capital lease obligations |
715 | 715 | 2,256 | 9,287 | 12,973 | |||||
| Operating lease obligations |
13,152 | 12,927 | 28,338 | 28,462 | 82,879 | |||||
| $378,702 | $15,176 | $30,594 | $145,858 | $570,330 | ||||||
Payments for borrowings do not include interest. Payments related to leases are based on actual payments specified in the underlying contracts.
In accordance with the FINRA Settlement, First Southwest repurchased $41.6 million in face value of auction rate bonds in February 2009 and has agreed to make its best efforts to provide liquidity to those other customers having accounts the value of which exceeded $10.0 million at the time of their purchase of auction rate bonds. These investors purchased approximately $56.7 million in auction rate bonds from First Southwest. We believe that we have satisfied our
78
Table of Contents
Index to Financial Statements
material obligations pursuant to the FINRA Settlement by offering these investors loans extended on the basis of reasonable and customary credit standards secured by the subject auction rate bonds.
Quantitative and qualitative disclosures about market risk
Some of the information below contains forward-looking statements. The primary objective of the following information is to provide forward-looking quantitative and qualitative information about our potential exposure to market risks. The disclosure is not meant to be a precise indicator of expected future losses, but rather an indicator of reasonably possible losses, and therefore our actual results may differ from any of the following projections. This forward-looking information provides an indicator of how we view and manage our ongoing market risk exposures.
We are engaged primarily in the business of investing funds obtained from deposits and borrowings in interest-earning loans and investments, and our primary component of market risk is interest rate risk volatility. Consequently, our earnings depend to a significant extent on our net interest income, which is the difference between interest income on loans and investments and our interest expense on deposits and borrowing. To the extent that our interest-bearing liabilities do not reprice or mature at the same time as our interest-bearing assets, we are subject to interest rate risk and corresponding fluctuations in net interest income.
Interest rate risk is the potential of economic losses due to future interest rate changes. These economic losses can be reflected as a loss of future net interest income and/or a loss of current fair market values. The magnitude of the change in earnings and market value of portfolio equity resulting from interest rate changes is impacted by the time remaining to maturity on fixed-rate obligations, the contractual ability to adjust rates prior to maturity, competition, and the general level of interest rates and customer actions. Our objective is to measure the effect of interest rate changes on net interest income and to adjust the balance sheet to minimize the inherent risk while at the same time maximizing income.
There are several common sources of interest rate risk that must be effectively managed if there is to be minimal impact on our earnings and capital. Repricing risk arises largely from timing differences in the pricing of assets and liabilities. Reinvestment risk refers to the reinvestment of cash flows from interest payments and maturing assets at lower or higher rates. Basis risk exists when different yield curves or pricing indices do not change at precisely the same time or in the same magnitude such that assets and liabilities with the same maturity are not all affected equally. Yield curve risk refers to unequal movements in interest rates across a full range of maturities.
We have employed asset/liability management policies that attempt to manage our interest-earning assets and interest-bearing liabilities, thereby attempting to control the volatility of net interest income, without having to incur unacceptable levels of credit or investment risk. We manage our exposure to interest rates by structuring our balance sheet in the ordinary course of business. In addition, the asset/liability management policies permit the use of various derivative instruments to manage interest rate risk or hedge specified assets and liabilities. We manage our interest rate sensitivity position consistent with our established asset/liability management policies.
79
Table of Contents
Index to Financial Statements
An interest rate sensitive asset or liability is one that, within a defined time period, either matures or experiences an interest rate change in line with general market interest rates. The management of interest rate risk is performed by analyzing the maturity and repricing relationships between interest-earning assets and interest-bearing liabilities at specific points in time (“GAP”) and by analyzing the effects of interest rate changes on net interest income over specific periods of time by projecting the performance of the mix of assets and liabilities in varied interest rate environments. Interest rate sensitivity reflects the potential effect on net interest income resulting from a movement in interest rates. A company is considered to be asset sensitive, or have a positive GAP, when the amount of its interest-earning assets maturing or repricing within a given period exceeds the amount of its interest-bearing liabilities also maturing or repricing within that time period. Conversely, a company is considered to be liability sensitive, or have a negative GAP, when the amount of its interest-bearing liabilities maturing or repricing within a given period exceeds the amount of its interest-earning assets also maturing or repricing within that time period. During a period of rising interest rates, a negative GAP would tend to affect net interest income adversely, while a positive GAP would tend to result in an increase in net interest income. During a period of falling interest rates, a negative GAP would tend to result in an increase in net interest income, while a positive GAP would tend to affect net interest income adversely. However, it is our intent to achieve a proper balance so that incorrect rate forecasts should not have a significant impact on earnings.
As of December 31, 2008
Interest rate sensitivity analysis presents the amount of assets and liabilities that are estimated to reprice through specified periods. The interest rate sensitivity analysis in the table below reflects changes in banking segment earnings and costs resulting from changes assets and liabilities on December 31, 2008 that will either be repriced in accordance with market rates, mature or are estimated to mature early within the periods indicated. This is a one-day position that is continually changing and is not necessarily indicative of our position at any other time.
80
Table of Contents
Index to Financial Statements
As illustrated in the table below, as of December 31, 2008, the banking segment was asset sensitive overall, but liability sensitive in the short term. This occurred due to a reclassification made for regulatory purposes. The reclassification shifted noninterest-bearing demand deposits to interest-bearing demand deposits, resulting in a reduction of the reserves the Bank is required to carry. The Bank was asset sensitive primarily due to the high ratio of loans to interest sensitive assets. The majority of the loan portfolio was indexed to the Wall Street Journal Prime rate and can adjust either daily or monthly. To match this, the Bank has also kept the maturities of most of its borrowings short, either maturing or repricing within one month. It also attempts to match longer term assets with certificates of deposit with terms of three to five years.
| December 31, 2008 | ||||||||||||||||||||||
| (dollar amounts in thousands) | 3 months or less |
> 3 months to 1 year |
> 1 year to 3 years |
> 3 years to 5 years |
> 5 years | Total | ||||||||||||||||
| Interest sensitive assets: |
||||||||||||||||||||||
| Loans(1) |
$ | 2,035,027 | $ | 315,540 | $ | 237,039 | $ | 75,751 | $ | 179,756 | $ | 2,843,113 | ||||||||||
| Securities |
26,079 | 44,771 | 61,486 | 23,090 | 229,901 | 385,327 | ||||||||||||||||
| Federal funds sold |
21,786 | — | — | — | — | 21,786 | ||||||||||||||||
| Other interest sensitive assets |
7,681 | — | — | — | — | 7,681 | ||||||||||||||||
| Total interest sensitive assets |
2,090,573 | 360,311 | 298,525 | 98,841 | 409,657 | 3,257,907 | ||||||||||||||||
| Interest sensitive liabilities: |
||||||||||||||||||||||
| Interest bearing checking(1) |
$ | 1,163,733 | $ | — | $ | — | $ | — | $ | — | $ | 1,163,733 | ||||||||||
| Savings |
151,341 | — | — | — | — | 151,341 | ||||||||||||||||
| Time deposits |
1,025,153 | 268,243 | 55,523 | 9,161 | 5,802 | 1,363,882 | ||||||||||||||||
| Notes payable & other borrowings |
324,170 | 574 | 3,204 | 847 | 5,898 | 334,693 | ||||||||||||||||
| Total interest sensitive liabilities |
2,664,397 | 268,817 | 58,727 | 10,008 | 11,700 | 3,013,649 | ||||||||||||||||
| Interest sensitivity gap |
$ | (573,824 | ) | $ | 91,494 | $ | 239,798 | $ | 88,833 | $ | 397,957 | $ | 244,258 | |||||||||
| Cumulative interest sensitivity gap |
$ | (573,824 | ) | $ | (482,330 | ) | $ | (242,532 | ) | $ | (153,699 | ) | $ | 244,258 | ||||||||
| Percentage of cumulative gap to total interest |
||||||||||||||||||||||
| Sensitive assets |
-17.61% | -14.80% | -7.44% | -4.72% | 7.50% | |||||||||||||||||
| (1) | Excludes First Southwest. |
The positive GAP in the interest rate sensitivity analysis indicates that our net interest income would rise in the long-term if rates increase and generally fall in the long-term if rates decline. Because of inherent limitations in interest rate sensitivity analyses, the banking segment uses multiple interest rate risk measurement techniques. Simulation analysis is used to subject the current repricing conditions to rising and falling interest rates in increments and decrements of 1%, 2% and 3% to determine the effect on net interest income changes for the next 12 months. The banking segment also measures the effects of changes in interest rates on market value of portfolio equity by discounting future cash flows of deposits and loans using new rates at which deposits and loans would be made to similar depositors and borrowers. Market value changes in the investment portfolio are estimated by discounting future cash flows and using duration analysis. Loan and investment security prepayments are estimated using current market
81
Table of Contents
Index to Financial Statements
information. We believe the simulation analysis presents a more accurate picture than interest rate sensitivity analysis alone since certain rate indices that affect liabilities do not change with the same magnitude over the same period of time as changes in the prime rate or other indices that reprice loans and investment securities. The projected changes in net interest income at December 31, 2008 were in compliance with established policy guidelines.
The table below shows the estimated impact of increases and decreases in interest rates of 1%, 2% and 3% on net interest income and on market value of portfolio equity for the banking segment as of December 31, 2008 (dollar amounts in thousands).
| December 31, 2008 | ||||||||||||
| Changes in net interest income |
Changes in market value of portfolio equity | |||||||||||
| Change in interest rates | Amount | Percent | Amount | Percent | ||||||||
| Up 3% |
$ | 3,913 | 3.15% | $ | 16,957 | 3.59% | ||||||
| Up 2% |
$ | 24 | 0.02% | $ | 8,338 | 1.77% | ||||||
| Up 1% |
$ | (533 | ) | -0.43% | $ | 4,596 | 0.97% | |||||
| Down 1% |
$ | 166 | 0.13% | $ | (23,113 | ) | -4.89% | |||||
| Down 2% |
$ | 294 | 0.24% | $ | (52,837 | ) | -11.19% | |||||
| Down 3% |
$ | (535 | ) | -0.43% | $ | (67,948 | ) | -14.38% | ||||
The projected changes in net interest income and market value of portfolio equity to changes in interest rates at December 31, 2008 were in compliance with established policy guidelines. These projected changes in the market value of portfolio equity model are based on numerous assumptions of growth and changes in the mix of assets or liabilities. The results in the table above show changes in net interest income that are smaller than the changes would be under normal interest rate conditions.
With respect to increases in interest rates, the historically low level of interest rates, combined with the operation of repricing floors that are in effect for a significant portion of our loan portfolio, would cause yields on our earning assets to rise more slowly than increases in interest rates. As a result, in a rising interest rate environment, our interest rate margins would be compressed until the rise in interest rates was sufficient to allow the loan portfolio to reprice above the applicable repricing floors. In the table above, loans would begin to reprice if interest rates were to rise by more than 2%.
Due to historically low interest rates, the table above may not predict the full effect of decreasing interest rates upon our net interest income that would occur under a more traditional, higher interest rate environment because short-term interest rates are near zero percent and facts underlying certain of our modeling assumptions, such as the fact that deposit and loan rates cannot fall below zero percent, distort the model’s results.
As of September 30, 2009
The interest rate sensitivity analysis in the table below reflects changes in banking segment earnings and costs resulting from changes in assets and liabilities on September 30, 2009 that will either be repriced in accordance with market rates, mature or are estimated to mature early within the periods indicated. This is a one-day position that is continually changing and is not necessarily indicative of our position at any other time.
82
Table of Contents
Index to Financial Statements
As illustrated in the table below, the banking segment is asset sensitive overall. Loans which adjust daily or monthly to the Wall Street Journal Prime rate comprise a large percentage of interest sensitive assets and are the primary cause of the banking segment’s asset sensitivity. To help neutralize interest rate sensitivity, the banking segment has kept the terms of most of its borrowings under one year. It also attempts to match longer term assets with certificates of deposit with terms of three to five years.
| September 30, 2009 | |||||||||||||
| (Dollar amounts in thousands) | 3 Months or Less |
> 3 Months to 1 Year |
> 1 Year to 3 Years |
> 3 Years to 5 Years |
> 5 Years | Total | |||||||
| Interest sensitive assets: |
|||||||||||||
| Loans |
$2,408,472 | $ 313,919 | $ 310,281 | $ 83,780 | $223,886 | $3,340,338 | |||||||
| Securities |
197,886 | 52,339 | 59,554 | 9,763 | 123,675 | 443,217 | |||||||
| Federal funds sold |
26,366 | — | — | — | — | 26,366 | |||||||
| Other interest sensitive assets |
120,148 | — | — | — | — | 120,148 | |||||||
| Total interest sensitive assets |
2,752,872 | 366,258 | 369,835 | 93,543 | 347,561 | 3,930,069 | |||||||
| Interest sensitive liabilities: |
|||||||||||||
| Interest bearing checking |
$1,401,064 | $ — | $ — | $ — | $ — | $1,401,064 | |||||||
| Savings |
138,039 | — | — | — | — | 138,039 | |||||||
| Time deposits |
680,405 | 383,541 | 31,707 | 4,588 | 2,880 | 1,103,121 | |||||||
| Notes payable & other borrowings |
166,554 | 277,055 | 1,415 | 768 | 5,607 | 451,399 | |||||||
| Total interest sensitive liabilities |
2,386,062 | 660,596 | 33,122 | 5,356 | 8,487 | 3,093,623 | |||||||
| Interest sensitivity gap |
$ 366,810 | $(294,338 | ) | $336,713 | $ 88,187 | $339,074 | $ 836,446 | ||||||
| Cumulative interest sensitivity gap |
$ 366,810 | $ 72,472 | $409,185 | $497,372 | $836,446 | ||||||||
| Percentage of cumulative gap to total interest Sensitive assets |
9.33% | 1.84% | 10.41% | 12.66% | 21.28% | ||||||||
The positive GAP in the interest rate sensitivity analysis indicates that banking segment net interest income would generally rise if rates increase. Because of inherent limitations in interest rate sensitivity analysis, the banking segment uses multiple interest rate risk measurement techniques. Simulation analysis is used to subject the current repricing conditions to rising and falling interest rates in increments and decrements of 1%, 2% and 3% to determine the effect on net interest income changes for the next 12 months. The banking segment also measures the effects of changes in interest rates on market value of portfolio equity by discounting projected cash flows of deposits and loans. Market value changes in the investment portfolio are estimated by discounting future cash flows and using duration analysis. Loan and investment security prepayments are estimated using current market information. We believe the simulation analysis presents a more accurate picture than the GAP analysis. Simulation analysis recognizes that deposit products may not react to changes in interest rates as quickly or with the same magnitude as earning assets contractually tied to a market rate index. The sensitivity to changes in market rates varies across deposit products. Also, unlike GAP analysis, simulation analysis takes
83
Table of Contents
Index to Financial Statements
into account the effect of embedded options in the securities and loan portfolios as well as any off-balance-sheet derivatives. The projected changes in net interest income at September 30, 2009 were in compliance with established policy guidelines.
The table below shows the estimated impact of increases and decreases in interest rates of 1%, 2% and 3% on net interest income and on market value of portfolio equity for the banking segment as of September 30, 2009 (dollars in thousands).
| September 30, 2009 | ||||||||||||
| Changes In net interest income |
Changes in market value of equity | |||||||||||
| Change in Interest Rates | Amount | Percent | Amount | Percent | ||||||||
| Up 3% |
$ | (2,844 | ) | -1.81% | $ | 41,999 | 6.89% | |||||
| Up 2% |
$ | (7,996 | ) | -5.10% | $ | 26,360 | 4.33% | |||||
| Up 1% |
$ | (7,402 | ) | -4.72% | $ | 18,971 | 3.11% | |||||
| Down 1% |
$ | 33 | 0.02% | $ | (21,325 | ) | -3.50% | |||||
| Down 2% |
$ | (1,892 | ) | -1.21% | $ | (55,885 | ) | -9.17% | ||||
| Down 3% |
$ | (2,909 | ) | -1.85% | $ | (89,163 | ) | -14.63% | ||||
The projected changes in net interest income and market value of equity to changes in interest rates at September 30, 2009 were in compliance with established policy guidelines. These projected changes in net interest income results are based on numerous assumptions of growth and changes in the mix of assets or liabilities.
The historically low level of interest rates, combined with the existence of rate floors that are in effect for a significant portion of the loan portfolio, are projected to cause yields on our earning assets to rise more slowly than increases in market interest rates. As a result, in a rising interest rate environment, our interest rate margins would be compressed until the rise in market interest rates is sufficient to allow our loan portfolio to reprice above applicable rate floors. In the table above, loans would begin to reprice if interest rates were to rise by 3%.
Due to historically low interest rates, the table above may not predict the full effect of decreasing interest rates upon our net interest income that would occur under a more traditional, higher interest rate environment because short-term interest rates are near zero percent and facts underlying certain of our modeling assumptions, such as the assumption that deposit and loan rates cannot fall below zero percent, distort the model’s results.
Off-balance-sheet arrangements; commitments; guarantees
In the normal course of business, we enter into various transactions, which, in accordance with GAAP, are not included in our consolidated balance sheets. We enter into these transactions to meet the financing needs of our customers. These transactions include commitments to extend credit and standby letters of credit, which involve, to varying degrees, elements of credit risk and interest rate risk in excess of the amounts recognized in its consolidated balance sheets.
We enter into contractual loan commitments to extend credit, normally with fixed expiration dates or termination clauses, at specified rates and for specific purposes. Substantially all of our commitments to extend credit are contingent upon customers maintaining specific credit standards until the time of loan funding. We minimize our exposure to loss under these commitments by subjecting them to credit approval and monitoring procedures. We assess the credit risk associated with certain commitments to extend credit in determining the level of the allowance for possible loan losses.
84
Table of Contents
Index to Financial Statements
Standby letters of credit are written conditional commitments issued by us to guarantee the performance of a customer to a third party. In the event the customer does not perform in accordance with the terms of the agreement with the third party, we would be required to fund the commitment. The maximum potential amount of future payments we could be required to make is represented by the contractual amount of the commitment. If the commitment is funded, we would be entitled to seek recovery from the customer. Our policies generally require that standby letter of credit arrangements contain security and debt covenants similar to those contained in loan agreements.
In the normal course of business, First Southwest executes, settles, and finances various securities transactions that may expose First Southwest to off-balance sheet risk in the event that a customer or counterparty does not fulfill its contractual obligations. Examples of such transactions include the sale of securities not yet purchased by customers or for the account of First Southwest, clearing agreements between First Southwest and various clearinghouses and broker-dealers, secured financing arrangements that involve pledged securities, and when-issued underwriting and purchase commitments.
Critical accounting policies and estimates
Our accounting policies are integral to understanding the results reported. Our accounting policies are described in detail in Note 1 to our consolidated financial statements for the year ended December 31, 2008. In particular, you are encouraged to read in its entirety Note 1 for additional insight into management’s approach and methodology in estimating the allowance for loan losses. We believe that of our significant accounting policies, the allowance for loan losses may involve a higher degree of judgment and complexity.
The allowance for loan losses is a valuation allowance for probable losses inherent in the loan portfolio. Loans are charged to the allowance when the loss is confirmed or when a determination is made that a probable loss has occurred on a specific loan. Recoveries are credited to the allowance at the time of recovery. Throughout the year, management estimates the probable level of losses to determine whether the allowance for credit losses is adequate to absorb losses in the existing portfolio. Based on these estimates, an amount is charged to the provision for loan losses and credited to the allowance for loan losses in order to adjust the allowance to a level determined to be adequate to absorb losses. Management’s judgment as to the level of probable losses on existing loans involves the consideration of current economic conditions and their estimated effects on specific borrowers; an evaluation of the existing relationships among loans, potential loan losses and the present level of the allowance; results of examinations of the loan portfolio by regulatory agencies; and management’s internal review of the loan portfolio. In determining the ability to collect certain loans, management also considers the fair value of any underlying collateral. The amount ultimately realized may differ from the carrying value of these assets because of economic, operating or other conditions beyond our control. For a complete discussion of allowance for loan losses and provisions for loan losses, see the section entitled “Management’s discussion and analysis of financial condition and results of operations—Allowance for loan losses”.
85
Table of Contents
Index to Financial Statements
Overview
We are a Texas-based and Dallas-headquartered financial holding company registered under the Bank Holding Company Act, as amended by Gramm-Leach-Bliley Act. Although not true of the first nine months of 2009, historically, the majority of our net income has been derived from our wholly-owned bank subsidiary, PlainsCapital Bank. The Bank provides business and consumer banking services from offices located throughout central, north and west Texas. In addition to the Bank, we have various other subsidiaries with specialized areas of expertise that allow us to provide a wide array of financial products and services such as mortgage origination and financial advisory services. As of September 30, 2009, on a consolidated basis, we had total assets of approximately $4.7 billion, total deposits of $3.2 billion, total loans, including loans held for sale, of approximately $3.5 billion and shareholders’ equity of approximately $431.1 million.
History and expansion
Shortly after incorporating as a Texas corporation in 1987, we purchased Plains National Bank (“Plains National”) in Lubbock, Texas in 1988. At the time, Plains National had approximately $198.8 million in assets and was the fifth largest bank in the Lubbock market. Over the twenty years, Plains National’s market share and service offering grew, and it became the largest bank in the Lubbock market with approximately $1.01 billion in deposits and 19.2% of Lubbock’s deposit market share as of June 30, 2009. In 1998, we expanded our product offerings beyond traditional banking services by acquiring McAfee Mortgage Company, a Lubbock-based mortgage company.
In 1999, we acquired PrimeLending, a Dallas-based mortgage company with five locations in the Dallas-Fort Worth metroplex, and Plains National converted from a national chartered bank to a Texas chartered bank, opened its first Dallas location in the Turtle Creek neighborhood and changed its name to PNB Financial Bank. In 2000, we moved our corporate headquarters to Dallas and PNB Financial Bank opened its first location in Austin. In 2003, as part of a larger branding campaign, PNB Financial Bank changed its name to PlainsCapital Bank. Additionally, we acquired a majority interest in Hester Capital, a registered investment advisor under the Investment Advisers Act of 1940 specializing in investment portfolio management services for private clients including families, trusts and estates. In 2004, the Bank entered the Fort Worth and San Antonio markets. In 2008, the Bank entered the Arlington market.
On December 31, 2008, we acquired First Southwest Holdings, Inc., a diversified private investment banking corporation. Upon completion of this acquisition, First Southwest Holdings, Inc. was merged into First Southwest Holdings, LLC, and it became a wholly-owned subsidiary of the Bank. See the section entitled “Business segments—Financial advisory”.
As a result of this acquisition, we had over 500 shareholders of record as of December 31, 2008 and therefore were required to: (i) register our common stock under Section 12(g) of the Securities Exchange Act of 1934, as amended (the “Exchange Act”), (ii) file a registration statement on Form 10 and (iii) comply with the periodic reporting requirements of the Exchange Act.
86
Table of Contents
Index to Financial Statements
As of September 30, 2009, we had approximately $3.2 billion in deposits. The following table summarizes our deposit portfolio as of September 30, 2009 (dollar amounts in thousands).
| September 30, 2009 | ||||||||||||||||
| West Texas(1) | DFW | Central/ South(2) |
Other(3) | Total | ||||||||||||
| Demand deposits |
$ | 215,976 | $ | 235,430 | $ | 119,730 | $ (388,140 | ) | $ | 182,996 | ||||||
| NOW accounts |
224,142 | 92,798 | 15,404 | (256,064 | ) | 76,280 | ||||||||||
| Money market deposit accounts |
91,514 | 324,855 | 63,502 | 1,150,136 | 1,630,007 | |||||||||||
| Other savings deposits |
43,527 | 33,129 | 61,335 | 48 | 138,039 | |||||||||||
| Time deposits under $100,000 |
149,130 | 61,993 | 9,773 | 4 | 220,900 | |||||||||||
| Time deposit of $100,000 or more |
252,683 | 383,293 | 64,990 | 12 | 700,978 | |||||||||||
| Brokered deposits |
— | — | — | 181,245 | 181,245 | |||||||||||
| Foreign deposits |
— | — | — | 119,327 | 119,327 | |||||||||||
| Total deposits |
$ | 976,972 | $ | 1,131,498 | $ | 334,734 | $ | 806,568 | $ | 3,249,772 | ||||||
| Percentage of total deposits |
30.1% | 34.8% | 10.3% | 24.8% | 100.0% | |||||||||||
| (1) | “West Texas” consists of deposits originated in Lubbock, Texas. |
| (2) | “Central/South” primarily consists of deposits originated in Austin, Texas and San Antonio, Texas. |
| (3) | “Other” primarily consists of brokered deposits purchased through various intermediaries operating on a national basis and foreign deposits, both of which are managed by our Treasury Management department. Foreign deposits do not originate from foreign sources, and transfers of these funds neither come from nor go to facilities outside the U.S. Deposit reclassifications are reflected between demand deposits, NOW accounts, and money market deposit accounts on an overall basis. Such adjustments are made internally to help reduce reserve balance requirements at the Federal Reserve Bank. |
The following table summarizes our loan portfolio as of September 30, 2009 (dollar amounts in thousands).
| September 30, 2009 | |||||||||||||||
| West Texas(1) | DFW | Central/ South(2) |
Other(3) | Total | |||||||||||
| Commercial and industrial |
$ | 249,204 | $ | 707,666 | $ | 258,888 | $ | — | $ | 1,215,758 | |||||
| Lease financing |
— | — | — | 84,871 | 84,871 | ||||||||||
| Construction and land development |
40,468 | 266,950 | 131,697 | — | 439,115 | ||||||||||
| Real estate |
252,303 | 575,896 | 303,866 | — | 1,132,065 | ||||||||||
| Securities (including margin loans) |
1,155 | 440 | 195 | 132,966 | 134,756 | ||||||||||
| Consumer |
18,429 | 29,159 | 2,650 | — | 50,238 | ||||||||||
| Loans, gross |
$ | 561,559 | $ | 1,580,111 | $ | 697,296 | $ | 217,837 | $ | 3,056,803 | |||||
| Percentage of loans, gross |
18.4% | 51.7% | 22.8% | 7.1% | 100.0% | ||||||||||
| (1) | “West Texas” consists of loans originated from Lubbock, Texas. |
| (2) | “Central/South” primarily consists of loans originated from Austin, Texas and San Antonio, Texas. |
| (3) | “Other” primarily consists of margin loans held by First Southwest and lease financing. |
As of September 30, 2009, we had a total of 35 U.S. bank locations. Additionally, we maintain a location of our Bank in the Cayman Islands, which we opened in 2006. We believe that a Cayman Islands location of our Bank enables us to offer more competitive cash management and deposit products to our customers. Our Cayman Islands location consists of an agented office to facilitate our offering of these products. All deposits in the Cayman location come from U.S. based
87
Table of Contents
Index to Financial Statements
customers of the Bank. Deposits do not originate from foreign sources, and funds transfers neither come from nor go to facilities outside of the U.S. All deposits are in U.S. dollars. As of September 30, 2009, our Cayman Islands deposits totaled approximately $119.3 million.
Business segments
Operating as a financial services company allows us to seek to diversify risk so that revenue can be generated in a wider variety of market conditions and it also facilitates cross-selling between our business segments. We operate in three business segments: banking, mortgage origination and financial advisory. For more financial information about each of these business segments, see the section entitled “Management’s discussion and analysis of financial condition and results of operations”. See also Note 18 in the notes to our consolidated financial statements for the three and nine months ended September 30, 2009 and Note 24 in the notes to our consolidated financial statements for the years ended December 31, 2008, 2007 and 2006 included elsewhere in this prospectus.
During the third quarter of 2009, we changed our segment reporting. We describe this change in Note 18 to our consolidated interim financial statements for the three and nine months ended September 30, 2009. We did not restate our annual financial information for the periods ended December 31, 2008, 2007 and 2006 because the information for these periods is presented on the basis that management used to manage our business during these periods.
Banking
Our banking segment primarily operates through the Bank and PlainsCapital Leasing, LLC. As of September 30, 2009, our banking segment had approximately $4.4 billion in assets and total deposits of approximately $3.3 billion. The primary source of our deposits is residents located in the Texas markets we serve.
Business banking. Our business banking customers primarily consist of agribusiness, energy, health care, institutions of higher education, real estate (including construction and land development), and wholesale/retail trade companies. We provide these customers with extensive banking services such as Internet banking, business check cards and other add-on services as determined on a customer-by-customer basis. Our treasury management services, which are designed to reduce the time, burden and expense of collecting, transferring, disbursing and reporting cash, are also available to our business customers. We offer these business customers lines of credits, equipment loans and leases, letters of credit, agricultural loans, commercial real estate loans and other loan products.
88
Table of Contents
Index to Financial Statements
The table below sets forth a distribution of our business loans by type as of September 30, 2009 (dollar amounts in thousands).
| September 30, 2009 | ||||
| Amount | % of Total Loans | |||
| Loans: |
||||
| Commercial and industrial |
$1,215,758 | 39.8% | ||
| Real estate |
1,132,065 | 37.0% | ||
| Construction and land development |
439,115 | 14.4% | ||
| Lease financing |
84,871 | 2.8% | ||
| Total business loans |
2,871,809 | 93.9% | ||
| All other loans |
184,994 | 6.1% | ||
| Total loans |
$3,056,803 | 100.0% | ||
Commercial and industrial loans are primarily made within our market areas in Texas and are underwritten on the basis of the borrower’s ability to service the debt from income. In general, commercial and industrial loans involve more credit risk than residential mortgage loans and commercial mortgage loans and, therefore, usually yield a higher return. The increased risk in commercial and industrial loans results primarily from the type of collateral securing these loans, typically commercial real estate, accounts receivable, equipment and inventory. Additionally, increased risk arises from the expectation that commercial and industrial loans generally will be serviced principally from the operations of the business, and those operations may not be successful. Historical trends have shown theses types of loans to have higher delinquencies than mortgage loans. As a result of the additional risk and complexity associated with commercial and industrial loans, such loans require more thorough underwriting and servicing than loans to individuals. To manage these risks, our policy is to attempt to secure commercial and industrial loans with both the assets of the borrowing business and other additional collateral and guarantees that may be available. In addition, depending on the size of the credit, we actively monitor certain fiscal measures of the borrower, including cash flow, collateral value and other appropriate credit factors. We also have processes in place to analyze and evaluate on a regular basis our exposure to industries, products, market changes and economic trends.
The Bank also offers term financing on commercial real estate properties that include retail, office, multi-family, industrial, warehouse and non-owner occupied single family residences. Commercial mortgage lending can involve high principal loan amounts, and the repayment of these loans is dependent, in large part, on a borrower’s on-going business operations or on income generated from the properties that are leased to third parties. As a general practice, the Bank requires its commercial mortgage loans to be secured with first lien positions on the underlying property, to generate adequate equity margins, to be serviced by businesses operated by an established management team, and to be guaranteed by the principals of the borrower. The Bank seeks lending opportunities where cash flow from the collateral provides adequate debt service coverage and/or the guarantor’s net worth is comprised of assets other than the project being financed.
The Bank offers construction financing for (i) commercial, retail, office, industrial, warehouse and multi-family developments, (ii) residential developments, and (iii) single family residential properties. Loans to finance these transactions are generally secured by first liens on the underlying real property. We generally require that the subject property of a construction loan for commercial real estate be pre-leased. The Bank conducts periodic completion inspections,
89
Table of Contents
Index to Financial Statements
either directly or through an agent, prior to approval of periodic draws on these loans. Construction loans involve additional risks because loan funds are advanced upon the security of a project under construction, and the project is of uncertain value prior to its completion. Because of uncertainties inherent in estimating construction costs, the market value of the completed project and the effects of governmental regulation on real property, it can be difficult to accurately evaluate the total funds required to complete a project and the related loan-to-value ratio. As a result of these uncertainties, construction lending often involves the disbursement of substantial funds with repayment dependent, in part, on the success of the ultimate project rather than the ability of a borrower or guarantor to repay the loan. If the Bank is forced to foreclose on a project prior to completion, it may not be able to recover the entire unpaid portion of the loan. Additionally, it may be required to fund additional amounts to complete a project and may have to hold the property for an indeterminate period of time.
In addition to the real estate lending activities described above, a portion of the bank’s real estate portfolio consists of the origination of single family residential mortgage loans typically collateralized by owner occupied properties located in its market areas. These residential mortgage loans are generally secured by a first lien on the underlying property and have maturities of five years or less. Longer term mortgage financing is provided for certain customers within the Bank’s private banking group. As of September 30, 2009, the Bank had approximately $228.4 million in one-to-four family residential loans, which represented approximately 7.5% of its total loans.
PlainsCapital Leasing, LLC, a wholly-owned subsidiary of the Bank, provides commercial customers with an alternative to purchasing expensive capital equipment by allowing them to lease capital equipment from us. We have historically leased equipment to customers in the transportation, medical, machine tools, electronics, entertainment and audio/visual industries.
Personal banking. We offer a broad range of personal banking products and services for individuals. Similar to our business banking operations, we also provide our personal banking customers with a variety of add-on features such as check cards, safe deposit boxes, Internet banking, bill pay, overdraft privilege services, gift cards and access to ATM facilities throughout the U.S. We offer a variety of deposit accounts to our personal banking customers including savings, checking, interest-bearing checking, money market and certificates of deposit.
We loan to individuals for personal, family and household purposes, including lines of credit, home improvement loans, home equity loans, credit cards and loans for purchasing and carrying securities. At September 30, 2009, we had approximately $185.0 million of loans for these purposes, which is shown in the table above as “All other loans”.
Wealth and investment management. Our private banking team personally assists high net worth individuals and their families with their banking needs, including depository, credit, asset management, and trust and estate services. We offer trust and asset management services in order to assist these customers in managing, and ultimately transferring, their wealth. Our wealth management services provide personal trust, investment management and employee benefit plan administration services, including estate planning, management and administration, investment portfolio management, employee benefit accounts, and individual retirement accounts.
90
Table of Contents
Index to Financial Statements
Mortgage origination
Our mortgage origination segment operates through a wholly-owned subsidiary of the Bank, PrimeLending. Founded in 1986, PrimeLending is a residential mortgage originator licensed to originate and close loans in 49 states. At September 30, 2009, it operated from 154 locations in 32 states, originating a majority of its mortgages from its Texas locations. In addition to the Dallas market, PrimeLending also serves other Texas markets, including Austin, Forth Worth, Houston and San Antonio. The mortgage lending business is subject to seasonality, and the overall demand for mortgage loans is driven largely by the applicable interest rates at any given time.
PrimeLending handles loan processing, underwriting and closings in-house. Mortgage loans originated by PrimeLending are funded through a warehouse line of credit maintained with the Bank. PrimeLending sells substantially all mortgage loans it originates to various investors in the secondary market and does not service these loans. As these mortgage loans are sold in the secondary market, PrimeLending pays down its warehouse line of credit with the Bank. Loans sold are subject to certain indemnification provisions with investors, including the repurchase of loans sold and the repayment of sales proceeds to investors under certain conditions. In addition, if a customer defaults on a mortgage payment shortly after the loan is originated, the purchaser of the loan may have a put right, whereby they can require us to repurchase the loan at the full amount paid by the purchaser.
Our mortgage lending underwriting strategy seeks to follow conservative loan policies and underwriting practices, including:
| • | granting loans on a sound and collectible basis; |
| • | obtaining a balance between maximum yield and minimum risk; |
| • | ensuring that primary and secondary sources of repayment are adequate in relation to the amount of the loan; and |
| • | ensuring that each loan is properly documented and, if appropriate, insurance coverage is adequate. |
In addition to its branch office network, PrimeLending recently completed the formation of PrimeLending Ventures, LLC, which was formed with the objective of establishing various “affiliated business arrangements” to originate residential mortgages for customers of referring business partners and for other customers not associated with business partners. PrimeLending Ventures, LLC became operational during the first quarter of 2009.
Since its inception, PrimeLending has grown from originating approximately $80 million in mortgage loans annually with a staff of 20 individuals to originating approximately $4.3 billion in loans in the first nine months of 2009 with approximately 1,500 employees. PrimeLending offers a variety of loan products catering to the specific needs of borrowers, including 30-year and 15-year fixed rate conventional mortgages, adjustable rate mortgages, jumbo loans, FHA and Veteran Affairs (VA) loans, permanent construction financing, relocation programs and refinancing options. Mortgage loans originated by PrimeLending are secured by a first lien on the underlying property. PrimeLending does not currently originate subprime loans (which we define to be loans to borrowers having a Fair Isaac Corporation (FICO) score lower than 620 or that do not comply with applicable agency or investor-specific underwriting guidelines).
91
Table of Contents
Index to Financial Statements
Financial advisory
Our financial advisory segment operates through First Southwest and Hester Capital. Through these subsidiaries, we serve families, trusts, endowments, foundations and other non-profit entities, retirement plans, public funds, local governments, public agencies, financial institutions and high net worth investors. We provide these customers with a diverse group of services such as investment advisory, investment banking, underwriting, asset management, arbitrage rebate, continuing disclosure and benefit plan services. Prior to December 31, 2008, our financial advisory services were offered primarily through Hester Capital and accounted for approximately 2% of our revenues on a consolidated basis as of December 31, 2008.
Pursuant to the Merger Agreement, each share of First Southwest common stock outstanding immediately before the merger automatically converted into the right to receive 2.82596085 shares of our Original Common Stock upon completion of the Merger. Further, each option to acquire First Southwest common stock outstanding and unexercised immediately before the merger was converted into a substitute stock option to acquire our Original Common Stock. Upon completion of the merger on December 31, 2008, we issued to former stockholders of First Southwest 5,092,677 shares of our Original Common Stock and substitute stock options to purchase 285,366 shares of our Original Common Stock and placed additional shares of our Original Common Stock into escrow to satisfy earnout provisions contained in the Merger Agreement, as described below. Additionally, pursuant to our acquisition of First Southwest Holdings, Inc., we agreed that in the event we determine to sell the properties or business of First Southwest or its subsidiaries prior to December 31, 2010 to someone other than one of our affiliates, and such sale does not constitute a change of control (as defined in the Merger Agreement), we will provide notice and allow the former First Southwest stockholders the opportunity to purchase such properties or business in accordance with the terms set forth in the Merger Agreement.
Pursuant to the earnout provisions in the Merger Agreement, we placed 1,697,430 shares of our Original Common Stock into escrow. The percentage of shares to be released from escrow and distributed to former First Southwest stockholders will be determined based upon the valuation of certain auction rate bonds held by First Southwest prior to the merger (or to be repurchased from investors following the closing of the merger) as of the last day of December 2012 or, if applicable, the aggregate sales price of such auction rate bonds prior to such date. The release of the escrowed shares will be further adjusted for certain specified losses, if any, during the earnout period and any excess dividend payments. If the value or aggregate sales price, as applicable, of the auction rate bonds is less than 80% of the face value of the auction rate bonds, no shares of our Original Common Stock will be distributed from escrow to former First Southwest stockholders. If the value or aggregate sales price of the auction rate bonds falls between 80% and 90% of face value, former First Southwest stockholders will receive an increasing portion of our shares held in escrow. If the value or aggregate sales price of the auction rate bonds equals or exceeds 90% of face value, former First Southwest stockholders will receive all of our shares held in escrow subject to certain specified losses, if any. Any shares issued out of the escrow will be accounted for as additional acquisition cost. The auction rate bonds held by First Southwest Holdings, Inc. prior to the merger were purchased by the Bank on December 31, 2008, at the closing of the acquisition.
First Southwest. First Southwest is a diversified investment banking firm and a registered broker-dealer with the SEC and FINRA. It provides financial advisory services, underwriting of municipal and other tax-exempt debt securities, asset management, arbitrage, rebate, continuing
92
Table of Contents
Index to Financial Statements
disclosure and benefit plan services to local governments and public agencies. First Southwest also provides advisory services to corporations, financial institutions, non-profit entities and high net worth investors. Although it is a diversified investment banking firm, First Southwest’s primary focus is on providing public finance services.
The operating subsidiary of First Southwest was founded in 1946 in Dallas, Texas and employs approximately 370 people and maintains 21 locations nationwide, 10 of which are in Texas. As of September 30, 2009, First Southwest maintained $67.7 million in equity capital and had more than 1,300 public sector clients. Additionally, as of September 30, 2009, it had consolidated assets of approximately $486.3 million.
First Southwest has five primary lines of business: (i) public finance, (ii) capital markets, (iii) correspondent clearing services, (iv) asset management, and (v) corporate finance.
Public finance. First Southwest’s public finance group represents its largest department. This group advises cities, counties, school districts, utility districts, tax increment zones, special districts, state agencies and other governmental entities nationwide. In addition, the group provides specialized advisory and investment banking services for airports, convention centers, healthcare institutions, institutions of higher education, housing, industrial development agencies, toll road authorities, and public power and utility providers.
Capital markets. Through its capital markets group, First Southwest trades and underwrites tax-exempt and taxable fixed income securities and trades equities on an agency basis on behalf of its retail and institutional clients. In addition, First Southwest provides asset and liability management advisory services to community banks.
Correspondent clearing services. The correspondent clearing services group offers omnibus and fully disclosed clearing services to FINRA member firms for trade executing, clearing and back office services. Services are provided to approximately 60 correspondent firms.
Asset management. First Southwest Asset Management is an investment advisor registered under the Investment Advisors Act of 1940 providing state and local governments with advice and assistance with respect to arbitrage rebate compliance, portfolio management and local government investment pool administration. Specifically, First Southwest Asset Management advises municipalities with respect to the emerging regulations relating to arbitrage rebates. Further, First Southwest Asset Management assists governmental entities with the complexities of investing public funds in the fixed income markets. As an investment adviser registered with the SEC, First Southwest Asset Management promotes cash management-based investment strategies that seek to adhere to the standards imposed by the fiduciary responsibilities of investment officers of public funds. As of September 30, 2009, First Southwest Asset Management served as administrator for local government investment pools totaling approximately $7.3 billion, investment manager of approximately $6.3 billion in short-term fixed income portfolios of municipal governments, and investment advisor for approximately $4.1 billion invested by municipal governments.
Corporate finance. First Southwest’s corporate finance group provides focused and tailored investment banking services to institutions and corporations. These services include capital raising, advisory services and corporate restructuring.
Hester Capital. We acquired a majority interest in Hester Capital in 2003. Hester Capital primarily serves clients in Austin, Dallas and Fort Worth and is an investment advisor registered
93
Table of Contents
Index to Financial Statements
under the Investment Advisors Act of 1940. It specializes in investment portfolio management services for private clients, including families, trusts and estates; endowments, foundations and other non-profit entities; retirement plans; businesses; and public funds. Hester Capital manages equity, fixed income and balanced portfolios using defined investment objectives and guidelines established with each client. The investment management services offered by Hester Capital involve managing and overseeing investment portfolios containing liquid assets of at least $1.0 million.
Competition
We face significant competition with respect to the business segments in which we operate and the geographic markets we serve. Our lending and mortgage origination competitors include commercial banks, savings banks, savings and loan associations, credit unions, finance companies, pension trusts, mutual funds, insurance companies, mortgage bankers and brokers, brokerage and investment banking firms, asset-based non-bank lenders, government agencies and certain other non-financial institutions. Competition for deposits and in providing lending and mortgage origination products and services to businesses in our market area is intense and pricing is important. Additionally, other factors encountered in competing for savings deposits are convenient office locations and rates offered. Direct competition for savings deposits also comes from other commercial bank and thrift institutions, money market mutual funds and corporate and government securities which may offer more attractive rates than insured depository institutions are willing to pay. Competition for loans includes such additional factors as interest rate, loan origination fees and the range of services offered by the provider. While the competition that we face for in our banking and mortgage origination segments is intense, the competition that we face varies based upon the market in which we operate. For example, our banking segment faces less competition in the Lubbock market than it does in the Dallas/Fort Worth metroplex.
We also face significant competition for financial advisory services on a number of factors such as price, perceived expertise, range of services, and local presence. Our financial advisory business competes directly with numerous other financial advisory and investment banking firms, broker-dealers and banks, including large national and major regional firms and smaller niche companies, some of whom are not broker dealers and, therefore, not subject to the broker dealer regulatory framework. Many of our competitors have substantially greater financial resources, lending limits and larger branch networks than we do, and offer a broader range of products and services.
Employees
As of September 30, 2009, we employed approximately 2,600 persons. None of our employees is represented by any collective bargaining unit or a party to any collective bargaining agreement.
Government supervision and regulation
General
PlainsCapital, the Bank, PrimeLending, First Southwest and many of our other non-banking subsidiaries are subject to extensive regulation under federal and state laws. The regulatory framework is intended primarily for the protection of customers and clients of our financial
94
Table of Contents
Index to Financial Statements
advisory services, depositors, the insurance funds of the FDIC and SIPC and the banking system as a whole, and not for the protection of the our shareholders or creditors. In many cases, the applicable regulatory authorities have broad enforcement power over bank holding companies and banks including the power to impose substantial fines and other penalties for violations of laws and regulations. The following discussion describes the material elements of the regulatory framework that applies to us and our subsidiaries. References in this prospectus to applicable statutes and regulations are brief summaries thereof, do not purport to be complete, and are qualified in their entirety by reference to such statutes and regulations.
Furthermore, new regulations and statutes are regularly proposed that contain wide-ranging proposals for altering the structures, regulations and competitive relationships of financial institutions operating and doing business in the U.S. For instance, on June 17, 2009, President Barack Obama laid out a comprehensive regulatory reform plan aiming to modernize and protect the integrity of the U.S. financial system. Among other things, President Obama’s plan contemplates increased supervision, consumer protection and higher capital requirements for financial institutions. We cannot predict whether or in what form any proposed regulation or statute will be adopted or the extent to which our business may be affected by any new regulation or statute.
PlainsCapital Corporation
PlainsCapital Corporation is a legal entity separate and distinct from the Bank and its other subsidiaries. PlainsCapital is a financial holding registered under the Bank Holding Company Act, as amended by the Gramm-Leach-Bliley Act. Accordingly, it is subject to supervision, regulation and examination by the Federal Reserve Board. The Gramm-Leach- Bliley Act, the Bank Holding Company Act and other federal laws subject financial and bank holding companies to particular restrictions on the types of activities in which they may engage, and to a range of supervisory requirements and activities, including regulatory enforcement actions for violations of laws and regulations.
Regulatory restrictions on dividends; source of strength. It is the policy of the Federal Reserve Board that bank holding companies should pay cash dividends on common stock only out of income available over the past year and only if prospective earnings retention is consistent with the organization’s expected future needs and financial condition. The policy provides that bank holding companies should not maintain a level of cash dividends that undermines the bank holding company’s ability to serve as a source of strength to its banking subsidiaries.
Under Federal Reserve Board policy, a bank holding company is expected to act as a source of financial strength to each of its banking subsidiaries and commit resources to their support. Such support may be required at times when, absent this Federal Reserve Board policy, a holding company may not be inclined to provide it. As discussed below, a bank holding company, in certain circumstances, could be required to guarantee the capital plan of an undercapitalized banking subsidiary.
Scope of permissible activities. Under the Bank Holding Company Act, PlainsCapital generally may not acquire a direct or indirect interest in or control of more than 5% of the voting shares of any company that is not a bank or bank holding company. Additionally, the Bank Holding Company Act may prohibit PlainsCapital from engaging in activities other than those of banking, managing or controlling banks or furnishing services to or performing services for its subsidiaries, except that it may engage in, directly or indirectly, certain activities that the Federal Reserve
95
Table of Contents
Index to Financial Statements
Board has determined to be closely related to banking or managing and controlling banks as to be a proper incident thereto. In approving acquisitions or the addition of activities, the Federal Reserve Board considers, among other things, whether the acquisition or the additional activities can reasonably be expected to produce benefits to the public, such as greater convenience, increased competition, or gains in efficiency, that outweigh such possible adverse effects as undue concentration of resources, decreased or unfair competition, conflicts of interest or unsound banking practices.
Notwithstanding the foregoing, the Gramm-Leach-Bliley Act, effective March 11, 2000, eliminated the barriers to affiliations among banks, securities firms, insurance companies and other financial service providers and permits bank holding companies to become financial holding companies and thereby affiliate with securities firms and insurance companies and engage in other activities that are financial in nature. The Gramm-Leach- Bliley Act defines “financial in nature” to include securities underwriting, dealing and market making; sponsoring mutual funds and investment companies; insurance underwriting and agency; merchant banking activities; and activities that the Federal Reserve Board has determined to be closely related to banking. No regulatory approval will be required for a financial holding company to acquire a company, other than a bank or savings association, engaged in activities that are financial in nature or incidental to activities that are financial in nature, as determined by the Federal Reserve Board.
Under the Gramm-Leach-Bliley Act, a bank holding company may become a financial holding company by filing a declaration with the Federal Reserve Board if each of its subsidiary banks is “well capitalized” under the Federal Deposit Insurance Corporation Improvement Act prompt corrective action provisions, is well managed, and has at least a satisfactory rating under the Community Reinvestment Act of 1977. PlainsCapital became a financial holding company on March 23, 2000.
While the Federal Reserve Board is the “umbrella” regulator for financial holding companies and has the power to examine banking organizations engaged in new activities, regulation and supervision of activities which are financial in nature or determined to be incidental to such financial activities will be handled along functional lines. Accordingly, activities of subsidiaries of a financial holding company will be regulated by the agency or authorities with the most experience regulating that activity as it is conducted in a financial holding company. First Southwest, for example, is primarily regulated by FINRA.
Safe and sound banking practices. Bank holding companies are not permitted to engage in unsafe and unsound banking practices. The Federal Reserve Board’s Regulation Y, for example, generally requires a holding company to give the Federal Reserve Board prior notice of any redemption or repurchase of its equity securities, if the consideration to be paid, together with the consideration paid for any repurchases or redemptions in the preceding year, is equal to 10% or more of the company’s consolidated net worth. In addition, bank holding companies are required to consult with the Federal Reserve Board prior to making any redemption or repurchase, even within the foregoing parameters. The Federal Reserve Board may oppose the transaction if it believes that the transaction would constitute an unsafe or unsound practice or would violate any law or regulation. Depending upon the circumstances, the Federal Reserve Board could take the position that paying a dividend would constitute an unsafe or unsound banking practice.
96
Table of Contents
Index to Financial Statements
The Federal Reserve Board has broad authority to prohibit activities of bank holding companies and their nonbanking subsidiaries that represent unsafe and unsound banking practices or that constitute violations of laws or regulations, and can assess civil money penalties for certain activities conducted on a knowing and reckless basis, if those activities caused a substantial loss to a depository institution. The penalties can be as high as $1.0 million for each day the activity continues.
Anti-tying restrictions. Subject to various exceptions, bank holding companies and their affiliates are generally prohibited from tying the provision of certain services, such as extensions of credit, to certain other services offered by a bank holding company or its affiliates.
Capital adequacy requirements. The Federal Reserve Board has adopted a system using risk-based capital guidelines to evaluate the capital adequacy of bank holding companies. Under the guidelines, a risk weight factor of 0% to 100% is assigned to each category of assets based generally on the perceived credit risk of the asset class. The risk weights are then multiplied by the corresponding asset balances to determine a “risk-weighted” asset base. At least half of the risk-based capital must consist of core (Tier 1) capital, which is comprised of:
| • | common shareholders’ equity (includes common stock and any related surplus, undivided profits, disclosed capital reserves that represent a segregation of undivided profits, and foreign currency translation adjustments, excluding changes in other comprehensive income (loss)); |
| • | certain noncumulative perpetual preferred stock and related surplus; and |
| • | minority interests in the equity capital accounts of consolidated subsidiaries (excludes goodwill and various intangible assets). |
The remainder, supplementary (Tier 2) capital, may consist of:
| • | allowance for loan losses, up to a maximum of 1.25% of risk-weighted assets; |
| • | certain perpetual preferred stock and related surplus; |
| • | hybrid capital instruments; |
| • | perpetual debt; |
| • | mandatory convertible debt securities; |
| • | term subordinated debt; |
| • | intermediate term preferred stock; and |
| • | certain unrealized holding gains on equity securities. |
“Total risk-based capital” is determined by combining core capital and supplementary capital. The guidelines require a minimum ratio of total capital to total risk-weighted assets of 8.0% (of which at least 4.0% is required to consist of Tier 1 capital elements). Total capital is the sum of Tier 1 and Tier 2 capital. As of September 30, 2009, our ratio of Tier 1 capital to total risk-weighted assets was 12% and its ratio of total capital to total risk-weighted assets was 13.6%.
In addition to the risk-based capital guidelines, the Federal Reserve Board uses a leverage ratio as an additional tool to evaluate the capital adequacy of bank holding companies. The leverage ratio is a company’s Tier 1 capital divided by its average total consolidated assets. We are required to maintain a leverage ratio of 4.0%, and, as of September 30, 2009, our leverage ratio was 10%.
The federal banking agencies’ risk-based and leverage ratios are minimum supervisory ratios generally applicable to banking organizations that meet certain specified criteria, assuming that
97
Table of Contents
Index to Financial Statements
they have the highest regulatory rating. Banking organizations not meeting these criteria are expected to operate with capital positions well above the minimum ratios. The federal bank regulatory agencies may set capital requirements for a particular banking organization that are higher than the minimum ratios when circumstances warrant. Federal Reserve Board guidelines also provide that banking organizations experiencing internal growth or making acquisitions will be expected to maintain strong capital positions substantially above the minimum supervisory levels, without significant reliance on intangible assets.
Imposition of liability for undercapitalized subsidiaries. Bank regulators are required to take “prompt corrective action” to resolve problems associated with insured depository institutions whose capital declines below certain levels. In the event an institution becomes “undercapitalized,” it must submit a capital restoration plan. The capital restoration plan will not be accepted by the regulators unless each company having control of the undercapitalized institution guarantees the subsidiary’s compliance with the capital restoration plan up to a certain specified amount. Any such guarantee from a depository institution’s holding company is entitled to a priority of payment in bankruptcy.
The aggregate liability of the holding company of an undercapitalized bank is limited to the lesser of 5% of the institution’s assets at the time it became undercapitalized or the amount necessary to cause the institution to be “adequately capitalized”. The bank regulators have greater power in situations where an institution becomes “significantly” or “critically” undercapitalized or fails to submit a capital restoration plan. For example, a bank holding company controlling such an institution can be required to obtain prior Federal Reserve Board approval of proposed dividends, or might be required to consent to a consolidation or to divest the troubled institution or other affiliates.
Acquisitions by bank holding companies. The Bank Holding Company Act requires every bank holding company to obtain the prior approval of the Federal Reserve Board before it may acquire all or substantially all of the assets of any bank, or ownership or control of any voting shares of any bank, if after such acquisition it would own or control, directly or indirectly, more than 5% of the voting shares of such bank. In approving bank acquisitions by bank holding companies, the Federal Reserve Board is required to consider, among other things, the financial and managerial resources and future prospects of the bank holding company and the banks concerned, the convenience and needs of the communities to be served, and various competitive factors.
Control acquisitions. The Change in Bank Control Act prohibits a person or group of persons from acquiring “control” of a bank holding company unless the Federal Reserve Board has been notified and has not objected to the transaction. Under a rebuttable presumption established by the Federal Reserve Board, the acquisition of 10% or more of a class of voting stock of a bank holding company with a class of securities registered under Section 12 of the Exchange Act would, under the circumstances set forth in the presumption, constitutes acquisition of control of such company.
In addition, an entity is required to obtain the approval of the Federal Reserve Board under the Bank Holding Company Act before acquiring 25% (5% in the case of an acquiror that is a bank holding company) or more of any class of our outstanding common stock, or otherwise obtaining control or a “controlling influence” over us.
Emergency Economic Stabilization Act of 2008. The U.S. Congress, the U.S. Treasury and the federal banking regulators have taken broad action since early September 2008 to address
98
Table of Contents
Index to Financial Statements
volatility in the U.S. banking system. The EESA authorizes the U.S. Treasury to purchase from financial institutions and their holding companies up to $700 billion in mortgage loans, mortgage-backed securities and certain other financial instruments, including debt and equity securities issued by financial institutions and their holding companies in TARP. The stated purpose of TARP is to restore confidence and stability to the U.S. banking system and to encourage financial institutions to increase their lending to customers and to each other. The U.S. Treasury has allocated $250 billion towards the TARP Capital Purchase Program. Under the TARP Capital Purchase Program, the U.S. Treasury will purchase debt or equity securities from eligible participating institutions. The TARP also will include direct purchases or guarantees of troubled assets of financial institutions. On December 19, 2008, we sold 87,631 shares of our Series A Preferred Stock and a warrant to purchase, upon net exercise, 4,382 shares of our Series B Preferred Stock to the U.S. Treasury for approximately $87.6 million pursuant to the TARP Capital Purchase Program. The U.S. Treasury immediately exercised its warrant on December 19, 2008, and we issued the underlying shares of Series B Preferred Stock to the U.S. Treasury. As a participant in the TARP Capital Purchase Program, we are subject to executive compensation limits and other restrictions and are encouraged to expand our lending and mortgage loan modifications. We intend to redeem our Series A Preferred Stock and Series B Preferred Stock from the proceeds of this offering, subject to required regulatory approval.
The EESA also temporarily increased FDIC deposit insurance on most accounts from $100,000 to $250,000. This increase was in place pursuant to EESA until December 31, 2009 and is not covered by deposit insurance premiums paid by the banking industry. However, as a result of the enactment on May 20, 2009 of the Helping Families Save Their Homes Act of 2009, the temporary increase in FDIC deposit insurance on most accounts was extended until December 31, 2013, subject to deposit insurance assessments to be developed by the FDIC.
Following a systemic risk determination, the FDIC established its TLGP in October 2008. Under the final rule for the TLGP, there are two parts to the program: the Debt Guarantee Program (“DGP”) and the TAGP. Eligible entities continue to participate unless they opted out on or before December 5, 2008. For the DGP, eligible entities are generally U.S. bank holding companies, savings and loan holding companies, and FDIC-insured institutions. Under the DGP, the FDIC guarantees senior unsecured debt, including mandatory convertible debt, of an eligible entity issued on or after October 14, 2008 and not later than October 31, 2009. The guarantee is effective through the earlier of the maturity date or June 30, 2012 for debt issued before April 1, 2009. The guarantee on debt issued on or after April 1, 2009, will expire on the earlier of the maturity date, the mandatory conversion date for mandatory convertible debt or December 31, 2012. The DGP coverage limit is generally 125% of the eligible entity’s eligible debt outstanding on September 30, 2008 and scheduled to mature on or before June 30, 2009. Assessments for participating in the DGP vary depending upon when the guaranteed debt is issued and whether the duration of the debt is more than one year and includes a surcharge for guaranteed debt with maturities of at least one year issued on or after April 1, 2009 and maturing on or before June 30, 2012. An insured depository institution can, with prior written notice to and no objection from the FDIC, increase its own senior unsecured indebtedness that is guaranteed by using part of its parent’s limit. In the event an insured depository institution were to do so, however, the debt guarantee limit of the holding company would be reduced by the amount of guaranteed debt that the subsidiary issued over its limit. PlainsCapital and the Bank have opted to participate in the DGP, but, as of September 30, 2009, have not issued any guaranteed debt.
99
Table of Contents
Index to Financial Statements
For the TAGP, eligible entities are FDIC-insured institutions. Under the TAGP, the FDIC provides unlimited deposit insurance coverage through June 30, 2010 for noninterest-bearing transaction accounts (typically business checking accounts) and certain funds swept into noninterest-bearing savings accounts, as well as negotiable order of withdrawal accounts with interest rates no higher than 0.5% and Interest on Lawyers Trust Accounts. Participating institutions pay an assessment on the balance of each covered account in excess of $250,000 during the period from November 13, 2008 through June 30, 2010. The original assessment rate is 10 basis points (annualized) through December 31, 2009, and when the FDIC extended the TAGP through June 30, 2010, it increased the assessment rate for the period from January 1, 2010 through June 30, 2010 to either 15 basis points, 20 basis points or 25 basis points, depending upon the risk category assigned to the institution under the FDIC’s risk-based premium system. Any institution currently participating in the original TAGP that wishes to opt-out of the TAGP extension through June 30, 2010 must submit its opt-out election to the FDIC on or before November 2, 2009. The Bank participates in the original TAGP and does not intend to opt out of the extension through June 30, 2010. The FDIC will notify the Bank concerning an assessment rate that we will be charged for the extension period.
American Recovery and Reinvestment Act of 2009. The ARRA was enacted on February 17, 2009. The ARRA includes a wide variety of programs intended to stimulate the U.S. economy and provide for extensive infrastructure, energy, health, and education needs. In addition, the ARRA imposes certain new executive compensation and corporate governance obligations on all current and future TARP recipients, including PlainsCapital, until the institution has redeemed the preferred stock issued to the U.S. Treasury, which TARP recipients are now permitted to do under the ARRA without regard to the three year holding period and without the need to raise new capital, subject to approval of its primary federal regulator. The executive compensation restrictions under the ARRA are more stringent than those currently in effect under the TARP Capital Purchase Program. For a detailed description of these restrictions, see the section entitled “Executive compensation—Compensation discussion and analysis—TARP Capital Purchase Program”.
The ARRA also sets forth additional corporate governance obligations for TARP recipients, including requirements for the Treasury Secretary to establish standards that provide for semi- annual meetings of compensation committees of the board of directors to discuss and evaluate employee compensation plans in light of an assessment of any risk posed from such compensation plans. TARP recipients are further required by the ARRA to have in place company-wide policies regarding excessive or luxury expenditures, permit non-binding shareholder “say-on-pay” proposals to be included in proxy materials, and to provide written certifications by the chief executive officer and chief financial officer with respect to compliance with the foregoing.
Office of the Special Master for TARP Executive Compensation. On June 15, 2009, the U.S. Treasury adopted and made effective an Interim Rule, which implemented and further expanded the limitations and restrictions imposed on executive compensation and corporate governance by the TARP Capital Purchase Program and EESA, as amended by the ARRA. Pursuant to the Interim Rule, the U.S. Treasury established the Office of the Special Master for TARP Executive Compensation. The Interim Rule grants broad power to the Special Master to review the compensation structures and payments of, and to independently issue advisory opinions to, those banks that have participated in the TARP Capital Purchase Program with respect to compensation
100
Table of Contents
Index to Financial Statements
structures and payments made by those banks during the period that the bank received financial assistance under TARP. If the Special Master finds that a TARP recipient’s compensation structure or payments that it has made to its employees are inconsistent with the purposes of the EESA or TARP, or otherwise contrary to the public interest, the Special Master may negotiate with the TARP recipient and the subject employee for appropriate reimbursements to the TARP recipient or the federal government.
Governmental monetary policies. Our earnings are affected by domestic economic conditions and the monetary and fiscal policies of the U.S. government and its agencies. The monetary policies of the Federal Reserve Board have had, and are likely to continue to have, an important impact on the operating results of commercial banks through its power to implement national monetary policy in order, among other things, to curb inflation or combat a recession. The monetary policies of the Federal Reserve Board affect the levels of bank loans, investments and deposits through its influence over the issuance of U.S. government securities, its regulation of the discount rate applicable to member banks and its influence over reserve requirements to which member banks are subject. We cannot predict the nature or impact of future changes in monetary and fiscal policies.
PlainsCapital Bank
The Bank is subject to various requirements and restrictions under the laws of the U.S., and to regulation, supervision and regular examination by the Texas Department of Banking. The Bank, as a state member bank is also subject to regulation and examination by the Federal Reserve Board. The Bank is also an insured depository institution and, therefore, subject to regulation by the FDIC, although the Federal Reserve Board is the Bank’s primary federal regulator. The Federal Reserve Board, the Texas Department of Banking and the FDIC have the power to enforce compliance with applicable banking statutes and regulations. Such requirements and restrictions include requirements to maintain reserves against deposits, restrictions on the nature and amount of loans that may be made and the interest that may be charged thereon and restrictions relating to investments and other activities of the Bank.
Restrictions on transactions with affiliates. Transactions between the Bank and its nonbanking affiliates, including PlainsCapital, are subject to Section 23A of the Federal Reserve Act. In general, Section 23A imposes limits on the amount of such transactions, and also requires certain levels of collateral for loans to affiliated parties. It also limits the amount of advances to third parties that are collateralized by the securities or obligations of PlainsCapital or its subsidiaries.
Affiliate transactions are also subject to Section 23B of the Federal Reserve Act which generally requires that certain transactions between the Bank and its affiliates be on terms substantially the same, or at least as favorable to the Bank, as those prevailing at the time for comparable transactions with or involving other nonaffiliated persons. The Federal Reserve has also issued Regulation W which codifies prior regulations under Sections 23A and 23B of the Federal Reserve Act and interpretive guidance with respect to affiliate transactions.
Loans to insiders. The restrictions on loans to directors, executive officers, principal shareholders and their related interests (collectively referred to herein as “insiders”) contained in the Federal Reserve Act and Regulation O apply to all insured institutions and their subsidiaries and holding companies. These restrictions include limits on loans to one borrower and conditions that must be met before such a loan can be made. There is also an aggregate limitation on all loans to insiders and their related interests. These loans cannot exceed the institution’s total unimpaired
101
Table of Contents
Index to Financial Statements
capital and surplus, and the Federal Reserve Board may determine that a lesser amount is appropriate. Insiders are subject to enforcement actions for knowingly accepting loans in violation of applicable restrictions.
Restrictions on distribution of subsidiary bank dividends and assets. Dividends paid by the Bank have provided a substantial part of PlainsCapital’s operating funds and for the foreseeable future it is anticipated that dividends paid by the Bank to PlainsCapital will continue to be PlainsCapital’s principal source of operating funds. Capital adequacy requirements serve to limit the amount of dividends that may be paid by the Bank. Pursuant to the Texas Finance Code, a Texas banking association may not pay a dividend that would reduce its outstanding capital and surplus unless it obtains the prior approval of the Texas Banking Commissioner. Additionally, the FDIC and the Federal Reserve Board have the authority to prohibit Texas state banks from paying a dividend when they determine the dividend would be an unsafe or unsound banking practice. As a member of the Federal Reserve System, the Bank must also comply with the dividend restrictions with which a national bank would be required to comply. Those provisions are generally similar to those imposed by the state of Texas. Among other things, the federal restrictions require that if losses have at any time been sustained by a bank equal to or exceeding its undivided profits then on hand, no dividend may be paid.
In the event of a liquidation or other resolution of an insured depository institution, the claims of depositors and other general or subordinated creditors are entitled to a priority of payment over the claims of holders of any obligation of the institution to its shareholders, including any depository institution holding company (such as PlainsCapital) or any shareholder or creditor thereof.
Branching. The establishment of a branch must be approved by the Texas Department of Banking and the Federal Reserve Board, which consider a number of factors, including financial history, capital adequacy, earnings prospects, character of management, needs of the community and consistency with corporate powers.
Interstate branching. Effective June 1, 1997, the Riegle-Neal Interstate Banking and Branching Efficiency Act of 1994 amended the Federal Deposit Insurance Act and certain other statutes to permit state and national banks with different home states to merge across state lines, with approval of the appropriate federal banking agency, unless the home state of a participating bank had passed legislation prior to May 31, 1997 expressly prohibiting interstate mergers. Under the Riegle-Neal Act amendments, once a state or national bank has established branches in a state, that bank may establish and acquire additional branches at any location in the state at which any bank involved in the interstate merger transaction could have established or acquired branches under applicable federal or state law. If a state opted out of interstate branching within the specified time period, no bank in any other state may establish a branch in the state which has opted out, whether through an acquisition or de novo.
Prompt corrective action. The Federal Deposit Insurance Corporation Improvement Act of 1991 establishes a system of prompt corrective action to resolve the problems of undercapitalized financial institutions. Under this system, the federal banking regulators have established five capital categories (“well capitalized,” “adequately capitalized,” “undercapitalized,” “significantly undercapitalized” and “critically undercapitalized”) in which all institutions are placed. Federal banking regulators are required to take various mandatory supervisory actions and are authorized to take other discretionary actions with respect to institutions in the three undercapitalized categories. The severity of the action depends upon the capital category in
102
Table of Contents
Index to Financial Statements
which the institution is placed. Generally, subject to a narrow exception, the banking regulator must appoint a receiver or conservator for an institution that is critically undercapitalized. The federal banking agencies have specified by regulation the relevant capital level for each category.
An institution that is categorized as undercapitalized, significantly undercapitalized or critically undercapitalized is required to submit an acceptable capital restoration plan to its appropriate federal banking agency. A bank holding company must guarantee that a subsidiary depository institution meets its capital restoration plan, subject to various limitations. The controlling holding company’s obligation to fund a capital restoration plan is limited to the lesser of 5% of an undercapitalized subsidiary’s assets at the time it became undercapitalized or the amount required to meet regulatory capital requirements. An undercapitalized institution is also generally prohibited from increasing its average total assets, making acquisitions, establishing any branches or engaging in any new line of business, except under an accepted capital restoration plan or with FDIC approval. The regulations also establish procedures for downgrading an institution to a lower capital category based on supervisory factors other than capital.
FDIC insurance assessments. The FDIC has adopted a risk-based assessment system for insured depository institutions that takes into account the risks attributable to different categories and concentrations of assets and liabilities. The system assigns an institution to one of three capital categories: (1) “well capitalized;” (2) “adequately capitalized;” and (3) “undercapitalized”. These three categories are substantially similar to the prompt corrective action categories described above, with the “undercapitalized” category including institutions that are undercapitalized, significantly undercapitalized and critically undercapitalized for prompt corrective action purposes. The FDIC also assigns an institution to one of three supervisory subgroups based on a supervisory evaluation that the institution’s primary federal regulator provides to the FDIC and information that the FDIC determines to be relevant to the institution’s financial condition and the risk posed to the deposit insurance funds. The FDIC may terminate its insurance of deposits if it finds that the institution has engaged in unsafe and unsound practices, is in an unsafe or unsound condition to continue operations, or has violated any applicable law, regulation, rule, order or condition imposed by the FDIC.
On May 22, 2009, the FDIC announced that it will levy a special assessment on insured institutions as part of its effort to rebuild the FDIC deposit insurance fund. The special assessment equaled five basis points on each FDIC-insured depository institution’s assets, minus its Tier 1 capital, as of June 30, 2009, resulting in a special assessment to us of approximately $1.8 million. The special assessment was collected September 30, 2009. On September 29, 2009, the Board of Directors of the FDIC adopted a Notice of Proposed Rulemaking that would require FDIC-insured institutions, such as the Bank, to prepay on December 30, 2009 their estimated quarterly risk-based assessments for the fourth quarter of 2009 and for all of 2010, 2011 and 2012. The FDIC also voted to adopt a uniform three-basis point increase in assessment rates effective on January 1, 2011, which increase would be reflected in our prepaid assessments.
Community Reinvestment Act. The Community Reinvestment Act requires, in connection with examinations of financial institutions, that federal banking regulators (in the Bank’s case, the Federal Reserve Board) evaluate the record of each financial institution in meeting the credit needs of its local community, including low and moderate-income neighborhoods. These facts are also considered in evaluating mergers, acquisitions and applications to open a branch or facility. Failure to adequately meet these criteria could impose additional requirements and
103
Table of Contents
Index to Financial Statements
limitations on the Bank. Additionally, the Bank must publicly disclose the terms of various Community Reinvestment Act-related agreements. The Bank received “satisfactory” CRA ratings from the Federal Reserve Board at its last completed examination in October 2006.
The Bank’s 2008 compliance exam initiated by the Federal Reserve is not yet completed. An adverse finding by the Federal Reserve Board regarding compliance with consumer protection laws and regulations, including but not limited to, fair lending laws, flood insurance laws or any other matters associated with a compliance exam of the Bank, could result in a referral of the matter to the U.S. Department of Justice for further investigation, the imposition of civil money penalties, restitution, punitive damages, a reduced CRA rating for the Bank and/or damage to our reputation. A CRA rating of less than “satisfactory” could adversely affect the Bank’s ability to establish new branches or acquire other financial institutions and could adversely affect our ability as a financial holding company to commence new activities, or acquire companies engaged in certain activities, otherwise permitted by financial holding companies having a “satisfactory” or better CRA rating.
Privacy. Under the Gramm-Leach-Bliley Act, financial institutions are required to disclose their policies for collecting and protecting confidential information. Customers generally may prevent financial institutions from sharing nonpublic personal financial information with nonaffiliated third parties except under narrow circumstances, such as the processing of transactions requested by the consumer or when the financial institution is jointly sponsoring a product or service with a nonaffiliated third party. Additionally, financial institutions generally may not disclose consumer account numbers to any nonaffiliated third party for use in telemarketing, direct mail marketing or other marketing to consumers. The Bank and all of its subsidiaries have established policies and procedures to assure compliance with all privacy provisions of the Gramm-Leach-Bliley Act.
Other regulations. Interest and other charges collected or contracted for by the Bank are subject to state usury laws and federal laws concerning interest rates.
Federal laws applicable to credit transactions. The loan operations of the Bank are also subject to federal laws applicable to credit transactions, such as the:
| • | Truth-In-Lending Act, governing disclosures of credit terms to consumer borrowers; |
| • | Home Mortgage Disclosure Act of 1975, requiring financial institutions to provide information to enable the public and public officials to determine whether a financial institution is fulfilling its obligation to help meet the housing needs of the community it serves; |
| • | Equal Credit Opportunity Act, prohibiting discrimination on the basis of race, creed or other prohibited factors in extending credit; |
| • | Fair Credit Reporting Act of 1978, governing the use and provision of information to credit reporting agencies and preventing identity theft; |
| • | Fair Debt Collection Act, governing the manner in which consumer debts may be collected by collection agencies; |
| • | Service Members Civil Relief Act, which amended the Soldiers’ and Sailors’ Civil Relief Act of 1940, governing the repayment terms of, and property rights underlying, secured obligations of persons in military service; and |
| • | the rules and regulations of the various federal agencies charged with the responsibility of implementing these federal laws. |
104
Table of Contents
Index to Financial Statements
Federal laws applicable to deposit operations. The deposit operations of the Bank are subject to:
| • | Right to Financial Privacy Act, which imposes a duty to maintain confidentiality of consumer financial records and prescribes procedures for complying with administrative subpoenas of financial records; and |
| • | Electronic Funds Transfer Act and Regulation E issued by the Federal Reserve Board to implement that act, which govern automatic deposits to and withdrawals from deposit accounts and customers’ rights and liabilities arising from the use of automated teller machines and other electronic banking services. |
Capital requirements. The Federal Reserve Board and the Texas Department of Banking monitor the capital adequacy of the Bank by using a combination of risk-based guidelines and leverage ratios. The agencies consider the Bank’s capital levels when taking action on various types of applications and when conducting supervisory activities related to the safety and soundness of individual banks and the banking system.
Under the regulatory capital guidelines, the Bank must maintain a total risk-based capital to risk-weighted assets ratio of at least 8.0%, a Tier 1 capital to risk-weighted assets ratio of at least 4.0%, and a Tier 1 capital to adjusted total assets ratio of at least 4.0% (3.0% for banks receiving the highest examination rating) to be considered “adequately capitalized”. See the discussion below under “The FDIC Improvement Act”.
FIRREA. The Financial Institutions Reform, Recovery and Enforcement Act of 1989, or FIRREA, includes various provisions that affect or may affect the Bank. Among other matters, FIRREA generally permits bank holding companies to acquire healthy thrifts as well as failed or failing thrifts. FIRREA removed certain cross marketing prohibitions previously applicable to thrift and bank subsidiaries of a common holding company. Furthermore, a multi-bank holding company may now be required to indemnify the federal deposit insurance fund against losses it incurs with respect to such company’s affiliated banks, which in effect makes a bank holding company’s equity investments in healthy bank subsidiaries available to the FDIC to assist such company’s failing or failed bank subsidiaries.
In addition, pursuant to FIRREA, any depository institution that has been chartered less than two years, is not in compliance with the minimum capital requirements of its primary federal banking regulator, or is otherwise in a troubled condition must notify its primary federal banking regulator of the proposed addition of any person to its board of directors or the employment of any person as a senior executive officer of the institution at least 30 days before such addition or employment becomes effective. During such 30 day period, the applicable federal banking regulatory agency may disapprove of the addition of or employment of such director or officer. The Bank is not subject to any such requirements.
FIRREA also expanded and increased civil and criminal penalties available for use by the appropriate regulatory agency against certain “institution affiliated parties” primarily including: (i) management, employees and agents of a financial institution; (ii) independent contractors such as attorneys and accountants and others who participate in the conduct of the financial institution’s affairs and who caused or are likely to cause more than minimum financial loss to or a significant adverse affect on the institution, who knowingly or recklessly violate a law or regulation, breach a fiduciary duty or engage in unsafe or unsound practices. Such practices can include the failure of an institution to timely file required reports or the submission of inaccurate
105
Table of Contents
Index to Financial Statements
reports. Furthermore, FIRREA authorizes the appropriate banking agency to issue cease and desist orders that may, among other things, require affirmative action to correct any harm resulting from a violation or practice, including restitution, reimbursement, indemnifications or guarantees against loss. A financial institution may also be ordered to restrict its growth, dispose of certain assets or take other action as determined by the ordering agency to be appropriate.
The FDIC Improvement Act. The Federal Deposit Insurance Corporation Improvement Act of 1991, or FDICIA, made a number of reforms addressing the safety and soundness of the deposit insurance system, supervision of domestic and foreign depository institutions, and improvement of accounting standards. This statute also limited deposit insurance coverage, implemented changes in consumer protection laws and provided for least-cost resolution and prompt regulatory action with regard to troubled institutions.
FDICIA requires every bank with total assets in excess of $500 million to have an annual independent audit made of the bank’s financial statements by a certified public accountant to verify that the financial statements of the bank are presented in accordance with generally accepted accounting principles and comply with such other disclosure requirements as prescribed by the FDIC.
FDICIA also places certain restrictions on activities of banks depending on their level of capital. FDICIA divides banks into five different categories, depending on their level of capital. Under regulations adopted by the FDIC, a bank is deemed to be “well capitalized” if it has a total Risk-Based Capital Ratio of 10.0% or more, a Tier 1 Capital Ratio of 6.0% or more, a Leverage Ratio of 5.0% or more, and the bank is not subject to an order or capital directive to meet and maintain a certain capital level. Under such regulations, a bank is deemed to be “adequately capitalized” if it has a total Risk-Based Capital Ratio of 8.0% or more, a Tier 1 Capital Ratio of 4.0% or more and a Leverage Ratio of 4.0% or more (unless it receives the highest composite rating at its most recent examination and is not experiencing or anticipating significant growth, in which instance it must maintain a Leverage Ratio of 3.0% or more). Under such regulations, a bank is deemed to be “undercapitalized” if it has a total Risk-Based Capital Ratio of less than 8.0%, a Tier 1 Capital Ratio of less than 4.0% or a Leverage Ratio of less than 4.0%. Under such regulations, a bank is deemed to be “significantly undercapitalized” if it has a Risk-Based Capital Ratio of less than 6.0%, a Tier 1 Capital Ratio of less than 3.0% and a Leverage Ratio of less than 3.0%. Under such regulations, a bank is deemed to be “critically undercapitalized” if it has a Leverage Ratio of less than or equal to 2.0%. In addition, the FDIC has the ability to downgrade a bank’s classification (but not to “critically undercapitalized”) based on other considerations even if the bank meets the capital guidelines. According to these guidelines, the Bank was classified as “well capitalized” as of September 30, 2009.
In addition, if a bank is classified as “undercapitalized,” the bank is required to submit a capital restoration plan to the federal banking regulators. Pursuant to FDICIA, an “undercapitalized” bank is prohibited from increasing its assets, engaging in a new line of business, acquiring any interest in any company or insured depository institution, or opening or acquiring a new branch office, except under certain circumstances, including the acceptance by the federal banking regulators of a capital restoration plan for the bank.
Furthermore, if a bank is classified as “undercapitalized,” the federal banking regulators may take certain actions to correct the capital position of the bank; if a bank is classified as “significantly undercapitalized” or “critically undercapitalized,” the federal banking regulators would be required to take one or more prompt corrective actions. These actions would include,
106
Table of Contents
Index to Financial Statements
among other things, requiring: sales of new securities to bolster capital, improvements in management, limits on interest rates paid, prohibitions on transactions with affiliates, termination of certain risky activities and restrictions on compensation paid to executive officers. If a bank is classified as “critically undercapitalized,” FDICIA requires the bank to be placed into conservatorship or receivership within 90 days, unless the federal banking regulators determines that other action would better achieve the purposes of FDICIA regarding prompt corrective action with respect to undercapitalized banks.
The capital classification of a bank affects the frequency of examinations of the bank and impacts the ability of the bank to engage in certain activities and affects the deposit insurance premiums paid by such bank. Under FDICIA, the federal banking regulators are required to conduct a full-scope, on-site examination of every bank at least once every 12 months. An exception to this rule is made, however, that provides that banks (i) with assets of less than $100 million, (ii) that are categorized as “well capitalized,” (iii) that were found to be well managed and composite rating was outstanding and (iv) have not been subject to a change in control during the last 12 months, need only be examined once every 18 months.
Brokered deposits. Under FDICIA, banks may be restricted in their ability to accept brokered deposits, depending on their capital classification. “Well capitalized” banks are permitted to accept brokered deposits, but all banks that are not “well capitalized” are not permitted to accept such deposits. The FDIC may, on a case-by-case basis, permit banks that are “adequately capitalized” to accept brokered deposits if the FDIC determines that acceptance of such deposits would not constitute an unsafe or unsound banking practice with respect to the bank. As of September 30, 2009, the Bank was “well capitalized” and therefore not subject to any limitations with respect to its brokered deposits.
Federal limitations on activities and investments. The equity investments and activities, as a principle of FDIC-insured state-chartered banks, are generally limited to those that are permissible for national banks. Under regulations dealing with equity investments, an insured state bank generally may not directly or indirectly acquire or retain any equity investment of a type, or in an amount, that is not permissible for a national bank.
Check Clearing for the 21st Century Act. The Check Clearing for the 21st Century Act, also known as Check 21, gives “substitute checks,” such as a digital image of a check and copies made from that image, the same legal standing as the original paper check.
Federal Home Loan Bank System. The Federal Home Loan Bank, or FHLB, system, of which the Bank is a member, consists of 12 regional FHLBs governed and regulated by the Federal Housing Finance Board, or FHFB. The FHLBs serve as reserve or credit facilities for member institutions within their assigned regions. The reserves are funded primarily from proceeds derived from the sale of consolidated obligations of the FHLB system. The FHLBs make loans (i.e., advances) to members in accordance with policies and procedures established by the FHLB and the Boards of directors of each regional FHLB.
As a system member, according to currently existing policies and procedures, the Bank is entitled to borrow from the FHLB of their respective region and is required to own a certain amount of capital stock in the FHLB. The Bank is in compliance with the stock ownership rules with respect to such advances, commitments and letters of credit and home mortgage loans and similar obligations. All loans, advances and other extensions of credit made by the FHLB to the Bank are secured by a portion of the respective mortgage loan portfolio, certain other investments and the capital stock of the FHLB held by the Bank.
107
Table of Contents
Index to Financial Statements
Anti-terrorism and money laundering legislation. The Bank is subject to the Uniting and Strengthening America by Providing Appropriate Tools Required to Intercept and Obstruct Terrorism of 2001 (the “USA PATRIOT Act”), the Bank Secrecy Act and rules and regulations of the Office of Foreign Assets Control. These statutes and related rules and regulations impose requirements and limitations on specific financial transactions and account relationships intended to guard against money laundering and terrorism financing. The Bank has established a customer identification program pursuant to Section 326 of the USA PATRIOT Act and the Bank Secrecy Act, and otherwise has implemented policies and procedures intended to comply with the foregoing rules.
SAFE Act—mortgage loan originator registration. The federal financial institution regulatory agencies recently issued for public comment proposed rules to implement the registration requirements of the Secure and Fair Enforcement for Mortgage Licensing Act of 2008, or SAFE Act. The SAFE Act requires mortgage loan originators who are employees of regulated institutions (including banks and certain of their subsidiaries) to be registered with the Nationwide Mortgage Licensing System and Registry (the “Registry”), a database established by the Conference of State Bank Supervisors and the American Association of Residential Mortgage Regulators to support the licensing of mortgage loan originators by each state. As part of this registration process, mortgage loan originators must furnish the Registry with background information and fingerprints for a background check. The SAFE Act generally prohibits employees of a regulated financial institution from originating residential mortgage loans without first registering with the Registry. Financial institutions must also adopt policies and procedures to ensure compliance with the SAFE Act.
PrimeLending
PrimeLending and the Bank are subject to the rules and regulations of FHA, VA, the Federal National Mortgage Association, the Federal Home Loan Mortgage Corporation and Government National Mortgage Association with respect to originating, processing, selling and servicing mortgage loans and the issuance and sale of mortgage-backed securities. Those rules and regulations, among other things, prohibit discrimination and establish underwriting guidelines which include provisions for inspections and appraisals, require credit reports on prospective borrowers and fix maximum loan amounts, and, with respect to VA loans, fix maximum interest rates. Mortgage origination activities are subject to, among others, the Equal Credit Opportunity Act, Federal Truth-in-Lending Act and the Real Estate Settlement Procedures Act and the regulations promulgated thereunder which, among other things, prohibit discrimination and require the disclosure of certain basic information to borrowers concerning credit terms and settlement costs. PrimeLending and the Bank are also subject to regulation by the Texas Department of Banking with respect to, among other things, the establishment of maximum origination fees on certain types of mortgage loan products.
First Southwest
First Southwest is a broker-dealer registered with the SEC, FINRA, all 50 U.S. states, the District of Columbia and Puerto Rico. Much of the regulation of broker-dealers, however, has been delegated to self-regulatory organizations, principally FINRA, the Municipal Securities Rulemaking Board and national securities exchanges. These self-regulatory organizations adopt rules (which are subject to approval by the SEC) for governing the industry and securities
108
Table of Contents
Index to Financial Statements
commissions in the states in which they conduct business. First Southwest is a member of, and is primarily subject to regulation, supervision and regular examination by, FINRA.
The regulations to which broker-dealers are subject cover all aspects of the securities business, including sales methods, trade practices among broker-dealers, capital structure, record keeping and the conduct of directors, officers and employees. Broker-dealers are also subject to the privacy and anti-money laundering laws and regulations discussed above. Additional legislation, changes in rules promulgated by the SEC and by self-regulatory organizations or changes in the interpretation or enforcement of existing laws and rules often directly affect the method of operation and profitability of broker-dealers. The SEC and the self-regulatory organizations may conduct administrative proceedings that can result in censure, fine, suspension or expulsion of a broker-dealer, its officers or employees. The principal purpose of regulation and discipline of broker-dealers is the protection of clients and the securities markets rather than protection of creditors and stockholders of broker-dealers.
Limitation on businesses. The businesses that First Southwest may conduct are limited by its agreements with, and its oversight by, FINRA. Participation in new business lines, including trading of new products or participation on new exchanges or in new countries often requires governmental and/or exchange approvals, which may take significant time and resources. In addition, First Southwest is an operating subsidiary of the Bank, which means its activities are further limited by those that are permissible for the Bank. As a result, First Southwest may be prevented from entering new businesses that may be profitable in a timely manner, if at all.
Net capital requirements. The SEC, FINRA and various other regulatory agencies have stringent rules and regulations with respect to the maintenance of specific levels of net capital by regulated entities. Rule 15c3-1 of the Exchange Act (the “Net Capital Rule”) requires that a broker-dealer maintain minimum net capital. Generally, a broker-dealer’s net capital is net worth plus qualified subordinated debt less deductions for non-allowable (or non-liquid) assets and other operational charges.
The SEC and FINRA impose rules that require notification when net capital falls below certain predefined criteria. These rules also dictate the ratio of debt-to-equity in the regulatory capital composition of a broker-dealer, and constrain the ability of a broker-dealer to expand its business under certain circumstances. If a firm fails to maintain the required net capital, it may be subject to suspension or revocation of registration by the applicable regulatory agency, and suspension or expulsion by these regulators could ultimately lead to the firm’s liquidation. Additionally, the Net Capital Rule and certain FINRA rules impose requirements that may have the effect of prohibiting a broker-dealer from distributing or withdrawing capital and requiring prior notice to and approval from the SEC and FINRA for certain capital withdrawals.
Securities Investor Protection Corporation. First Southwest is required by federal law to belong to the SIPC, whose primary function is to provide financial protection for the customers of failing brokerage firms. SIPC provides protection for clients up to $500,000, of which a maximum of $100,000 may be in cash.
Changing regulatory environment. The regulatory environment in which First Southwest operates is subject to frequent change. Its business, financial condition and operating results may be adversely affected as a result of new or revised legislation or regulations imposed by the U.S. Congress, the SEC or other U.S. and state governmental regulatory authorities, or FINRA. First Southwest’s business, financial condition and operating results also may be adversely affected by
109
Table of Contents
Index to Financial Statements
changes in the interpretation and enforcement of existing laws and rules by these governmental authorities. In the current era of heightened regulation of financial institutions, First Southwest can expect to incur increasing compliance costs, along with the industry as a whole.
Properties
As of September 30, 2009, our banking segment conducted business at 36 locations, including a location in the Cayman Islands, and two operations centers. Our principal executive offices are located at 2323 Victory Avenue, Suite 1400, Dallas, Texas, in space leased by the company. In addition to our principal office, we operate the following banking locations:
| Owned | Leased | Total | ||||
| Locations in Lubbock market |
9 | 6 | 15 | |||
| Locations in Dallas/Fort Worth market |
0 | 13 | 13 | |||
| Locations in Austin market |
0 | 5 | 5 | |||
| Locations in San Antonio market |
0 | 2 | 2 | |||
| Location in Cayman Islands |
0 | 1 | 1 | |||
| Total |
9 | 27 | 36 | |||
We have options to renew leases at most locations.
As of September 30, 2009, our mortgage origination segment conducted business at 154 locations in 32 states, a majority of which are in Texas. Each of these locations is leased by PrimeLending.
As of September 30, 2009, our financial advisory segment conducted business at 23 locations in Alaska, Arkansas, California, Connecticut, Florida, Massachusetts, New York, North Carolina, Rhode Island and Texas. Each of these offices is leased by First Southwest, one of its subsidiaries, or Hester Capital.
Legal proceedings
In November 2006, First Southwest received subpoenas from the SEC and the DOJ in connection with an investigation of possible antitrust and securities law violations, including bid-rigging, in the procurement of guaranteed investment contracts and other investment products for the reinvestment of bond proceeds by municipalities. The investigation is industry-wide and includes approximately 30 or more firms, including some of the largest U.S. investment firms. To the extent that its participation is requested, First Southwest will continue to cooperate with these investigations.
As a result of these SEC and DOJ investigations into industry-wide practices, First Southwest was named as a co-defendant in a series of civil lawsuits filed during 2008 in several different federal courts by various state and local governmental entities suing on behalf of themselves and a purported class of similarly situated governmental entities. A similar set of lawsuits were filed in California state courts by various local governmental entities suing only on behalf of themselves and not on behalf of a putative class. The California state court suits were removed to federal court, and all of the cases have been transferred to federal court in New York. On April 29, 2009, the federal court judge dismissed all claims asserted against First Southwest and nearly all other defendants from the consolidated putative class action case and granted the lead class plaintiffs
110
Table of Contents
Index to Financial Statements
until June 18, 2009 to file an amended complaint citing specific instances of alleged anti-competitive behavior by specific individuals at specific defendants. On June 18, 2009, the lead class plaintiffs filed a second consolidated amended class action complaint. This amended complaint did not name First Southwest as a defendant and did not make any specific allegations of misconduct against First Southwest or any of its employees. As a result, First Southwest is no longer a party to the putative class action case. However, First Southwest is identified in this consolidated amended class action complaint as an alleged co-conspirator with the named defendants. With respect to putative class actions filed in federal court by California plaintiffs that opted not to join in the consolidated class action case, the federal court judge granted those plaintiffs until September 15, 2009 to file an amended complaint. These California putative class plaintiffs also did not name First Southwest as a defendant and did not make any specific allegations of misconduct against First Southwest or any of its employees. As a result, First Southwest is no longer a party to these California putative class actions. However, First Southwest is identified in this complaint as an alleged co-conspirator with the named defendants. With respect to the removed California suits that do not seek class action status, the federal court judge gave the plaintiffs until September 15, 2009 to file an amended complaint. These California plaintiffs filed amended complaints continuing to identify First Southwest as a named defendant. The few allegations against First Southwest are limited in scope. Under the current scheduling order, the defendants in the removed California individual suits have until 45 days after the California plaintiffs inform defendants that all defendants in the California suits have been served to file dispositive motions.
As part of an industry-wide inquiry by FINRA into sales practices related to auction rate bonds, First Southwest executed a term sheet in 2008 in which it agreed to pay a fine and to buy back $41.6 million of auction rate bonds at par from a defined class of customers. The fine was paid in 2008, and the auction rate bonds were purchased from these customers in February 2009. First Southwest recorded a liability of $3.8 million as of December 31, 2008 representing the loss relating to this settlement. In addition, for a 60-day period commencing June 16, 2009, First Southwest agreed to use its best efforts to provide liquidity to certain other customers not otherwise part of the defined class referenced above. This 60-day period expired on August 14, 2009, and on September 11, 2009, First Southwest certified to FINRA the results of its best efforts obligation.
Like other financial institutions, we are subject to various federal, state and local laws and regulations relating to environmental matters. Under these laws and regulations we could be held liable for costs relating to environmental contamination at or from our current or former properties as well as, under certain circumstances, at or from properties that secure our loan portfolio. With respect to our borrower’s properties, the potential liabilities may far exceed the original amount of the loan made by us and secured by the property. Currently, we are not a defendant in any environmental legal proceeding.
111
Table of Contents
Index to Financial Statements
Executive officers and directors
Our directors are elected by our shareholders at our annual meeting, which is generally held in April of each year. The current members of our board hold office for one year or until their successors are chosen and qualify. Beginning with our 2010 annual meeting of shareholders, our board will be classified into three classes of directors, with the members of one class to be elected each year. One class of directors will hold office initially for a term expiring at the annual meeting of shareholders to be held in 2011, another class will hold office initially for a term expiring at the annual meeting of shareholders to be held in 2012, and another class will hold office initially for a term expiring at the annual meeting of shareholders to be held in 2013. At each annual meeting following this initial classification and election, the successors to the class of directors whose terms expire at that meeting will be elected for a term of office to expire at the third succeeding annual meeting after their election and until their successors have been duly elected and qualified. Our executive officers are appointed by the board of directors and hold office until their successors are chosen and qualify. The following table sets forth information concerning our executive officers and directors as of September 30, 2009:
| Name | Age | Positions | ||
| Alan White |
60 | Director, Chairman, President and Chief Executive Officer | ||
| Hill Feinberg |
62 | Director, Chief Executive Officer of First Southwest | ||
| Allen Custard |
47 | Executive Vice President and Chief Financial Officer | ||
| Jeff Isom |
52 | Executive Vice President of Finance and Accounting | ||
| Roseanna McGill |
59 | Chief Executive Officer of PrimeLending | ||
| Jerry Schaffner |
51 | Senior Executive Vice President of Lending; President of PlainsCapital Bank | ||
| Charlotte Jones Anderson |
43 | Director | ||
| Tracy Bolt |
45 | Director | ||
| Lee Lewis |
57 | Director | ||
| Andrew Littlefair |
48 | Director | ||
| Michael McGuire |
45 | Director | ||
| Haag Sherman |
43 | Director | ||
| Robert Taylor, Jr. |
61 | Director | ||
Alan B. White. Mr. White is one of our founders and has served as Chairman, President and Chief Executive Officer of PlainsCapital since 1987. Mr. White received his Bachelors of Business Administration in Finance at Texas Tech University. Mr. White’s current charitable and civic service includes serving as a member of the Cotton Bowl Athletic Association Board of Directors, the MD Anderson Cancer Center Living Legend Committee, the Super Bowl XLV Host Committee and Board of Directors, and the Dallas Citizens Council. He was also the founding chairman of the
112
Table of Contents
Index to Financial Statements
Texas Tech School of Business Chief Executive’s Roundtable; the former chairman of the Texas Tech Board of Regents, the Covenant Health System Board of Trustees, and the Methodist Hospital System Board of Trustees; and a member of the Texas Tech University President’s Council and the Texas Hospital Association Board.
Hill Feinberg. Mr. Feinberg has served as Chairman and Chief Executive Officer of First Southwest since 1991 and was appointed to serve as one of our directors on December 31, 2008 in conjunction with our acquisition of First Southwest. The Merger Agreement requires us to take all necessary action so that Mr. Feinberg is elected or appointed to serve as a member of our board of directors for three consecutive one year terms. Prior to joining First Southwest, Mr. Feinberg was a senior managing director at Bear Stearns & Co. Mr. Feinberg is a past chairman of the Municipal Securities Rulemaking Board, the self-regulatory organization with responsibility for authoring the rules that govern the municipal securities activities of registered brokers. Mr. Feinberg also is a member of the board of directors of Energy XXI (Bermuda) Limited, a public company.
W. Allen Custard, III. Mr. Custard has served as Executive Vice President and Chief Financial Officer of PlainsCapital since July 2009. He also serves as a director of the Bank, PrimeLending and various other subsidiaries. Prior to joining PlainsCapital, Mr. Custard served as a managing director of First Southwest Company. Mr. Custard joined First Southwest as head of its Corporate Finance Group in 2002 and served in that capacity until June 30, 2009. Prior to joining First Southwest, Mr. Custard was an investment banker with Merrill Lynch and Chase Securities in New York. Mr. Custard holds a Bachelor of Arts in History from Duke University and a Master of Business Administration from the Harvard University Graduate School of Business. Mr. Custard is a Registered Representative of the Financial Industry Regulatory Authority, licensed as a General Securities Principal (Series 24), a Uniform Securities Agent (Series 63), and a General Securities Representative (Series 7).
Jeff Isom. Mr. Isom joined PlainsCapital in 1989 and has held various positions with PlainsCapital. Mr. Isom has served as Executive Vice President of Finance and Accounting since July 2009. He previously served as Chief Financial Officer from 1998 until June 2009. Mr. Isom served as a non-voting advisory director of PlainsCapital from 1991 until March 2009. He currently serves as a director of the Bank and PrimeLending. Mr. Isom is a certified public accountant with 25 years of experience in the banking industry. He received his Bachelor of Business Administration in Accounting from Texas Tech University and is a member of the Texas Society of Certified Public Accountants, the American Institute of Certified Public Accountants, and the Financial Managers Society.
Roseanna McGill. Ms. McGill is the Chief Executive Officer of PrimeLending, a position she has held since founding the company in 1986. She also serves as a director of PrimeLending and served as a director of PlainsCapital and the Bank from 2000 until March 2009. Ms. McGill received a Bachelor of Business Administration and a Master of Business Administration from North Texas University. Prior to founding PrimeLending, Ms. McGill was a Certified Public Accountant and founder of McGill & Mundlin, an accounting firm. She is also a former director of the Mortgage Brokers Association.
Jerry Schaffner. Mr. Schaffner serves as the Senior Executive Vice President of Lending for PlainsCapital and the President of the Bank. He currently serves as a director of the Bank, PrimeLending, First Southwest and various other subsidiaries, and previously served as a director of PlainsCapital from 1993 until March 2009. Mr. Shaffner has over 25 years of banking
113
Table of Contents
Index to Financial Statements
experience and joined PlainsCapital in 1988 as part of its original management group. He received his Bachelor of Business Administration in Finance from Texas Tech University. Mr. Schaffner is a licensed Texas real estate broker and currently serves as a member of the Texas Tech University Chancellors Council.
Charlotte Jones Anderson. Ms. Anderson has served as a director of PlainsCapital since September 2009. She currently serves as Executive Vice President Brand Management and President of Charities for the Dallas Cowboys Football Club, Ltd., a National Football League team. She has worked in various capacities for the Dallas Cowboys organization since 1990. A native of Little Rock, Arkansas, Ms. Anderson is a graduate of Stanford University where she earned a Bachelor of Science degree in human biology. Ms. Anderson is actively involved with a number of charitable and philanthropic organizations, including The Boys and Girls Clubs of America (regional trustee), the Salvation Army (board of directors), The Rise School (board of directors), the Southwest Medical Foundation (board of directors), the Dallas Symphony (board of directors), and the President’s Advisory Counsel for The Dallas Center for Performing Arts Foundation.
Tracy A. Bolt. Mr. Bolt has served as a director of PlainsCapital since September 2009. Mr. Bolt co-founded in 1994 Hartman Leito & Bolt, LLP, an accounting and consulting firm based in Fort Worth, Texas, where he serves as a partner and is a member of that firm’s executive and compensation committee. Mr. Bolt holds a Bachelor of Science and Master of Science from the University of North Texas, and he is a certified public accountant. He currently serves as a board member and member of the executive committee for Community In School, is currently a board member of the University of North Texas Accounting Advisory Board and is currently a member of both the American Institute of Certified Public Accountants and the Texas Society of Certified Public Accountants.
Lee Lewis. Mr. Lewis has served as a director of PlainsCapital since 1989. In 1976, he founded, and currently serves as the Chief Executive Officer of, Lee Lewis Construction, Inc., a construction firm based in Lubbock. Mr. Lewis graduated from Texas Tech University and is a member of the American General Contractors Association, West Texas Chapter, the Chancellors Council for the Texas Tech University System, and the Red Raider Club.
Andrew J. Littlefair. Mr. Littlefair has served as a director of PlainsCapital since September 2009. Mr. Littlefair co-founded Clean Energy Fuels Corp., a provider of compressed and liquefied natural gas in the United States and Canada that is publicly traded on the NASDAQ Global Select Market, and has served as that company’s President, Chief Executive Officer and a director since 2001. From 1996 to 2001, Mr. Littlefair served as President of Pickens Fuel Corp., and from 1987 to 1996, he served in various management positions at Mesa, Inc., an energy company. From 1983 to 1987, Mr. Littlefair served in the Reagan Administration as a Staff Assistant to the President. Mr. Littlefair serves on the board of directors of Westport Innovations Inc., a Canadian company publicly traded on the NASDAQ Global Market, and he is currently Chairman of NGV America, the leading U.S. advocacy group for natural gas vehicles. He earned a B.A. in Political Science from the University of Southern California.
Michael T. McGuire. Mr. McGuire has served as a director of PlainsCapital since September 2009. Mr. McGuire currently serves as Executive Vice President of Marketing, Brand Management, and Information Technology at Andrews Distributing Company, a beverage distribution company, and has served on that company’s leadership team since July 2002. Mr. McGuire previously worked at EMC Corporation, a Fortune 500 technology company. Mr. McGuire earned his undergraduate degree in Marketing from Boston College’s Carroll School of Management, and
114
Table of Contents
Index to Financial Statements
graduated with highest honors from Southern Methodist University’s Executive MBA Program at the Cox School of Business in 2005 with a concentration in finance. He is a member of the national MBA honors association Beta Gamma Sigma.
A. Haag Sherman. Mr. Sherman has served as a director of PlainsCapital since September 2009. Mr. Sherman co-founded and currently serves as Managing Partner and Chief Investment Officer of Salient Partners, L.P., an investment firm based in Houston, Texas. Mr. Sherman has served in various executive capacities with Salient Partners since 2002. Mr. Sherman is an honors graduate of the University of Texas School of Law and a cum laude graduate of Baylor University. He is a certified public accountant and a member of the State Bar of Texas.
Robert Taylor, Jr. Mr. Taylor has served as a director of PlainsCapital since 1997. He has been engaged in the wholesale distribution business in Lubbock, Texas since 1971. Since 2007, Mr. Taylor has served as the Vice President of Logistics for United Supermarkets, LLC, a retail grocery business in Texas since 1915. From 2002 to 2007, Mr. Taylor was the President of R.C. Taylor Distributing, Inc., a business engaged in the business of general merchandise, candy and tobacco to retail outlets in West Texas and Eastern New Mexico. Mr. Taylor is a 1971 graduate of Texas Tech University. He is chairman of the Lubbock Downtown Tax Increment Finance Redevelopment Committee and serves on the Texas Tech Chancellors Advisory Board.
Board committees
Our board of directors has the authority to appoint committees to perform certain management and administration functions, and our board of directors has established the Audit Committee, the Compensation Committee and the Nominating and Corporate Governance Committee. The Chairperson of the Audit Committee is Robert Taylor. The members of each committee are appointed by the board of directors and serve until their successors are elected and qualified, unless they are earlier removed or resign.
Audit Committee
We have an Audit Committee consisting of Mr. Bolt, Chairman, and Messrs. McGuire, Sherman and Taylor. The Audit Committee has responsibility for, among other things:
| • | overseeing management’s maintenance of the reliability and integrity of our accounting policies and financial reporting processes, our disclosure practices and the audits of our financial statements; |
| • | overseeing management’s establishment and maintenance of processes to assure that an adequate system of internal control is functioning; |
| • | overseeing management’s establishment and maintenance of processes to assure our compliance with all applicable laws, regulations and corporate policy; |
| • | investigating any matter brought to its attention within the scope of its duties and engaging independent counsel and other advisers as the audit committee deems necessary; |
| • | reviewing our annual and quarterly financial statements prior to their filing and prior to the release of earnings; |
| • | reviewing and assessing the adequacy of a formal written charter on an annual basis; |
| • | preparing the audit committee report required by SEC rules to be included in our annual report; |
115
Table of Contents
Index to Financial Statements
| • | reviewing and approving all related person transactions for potential conflict of interest situations on an ongoing basis; |
| • | determining compensation of, and reviewing the performance of, the independent accountants, appointing or terminating the independent accountants and considering and approving, in advance, any services proposed to be performed by the independent accountants; and |
| • | handling such other matters that are specifically delegated to the audit committee by our board of directors from time to time. |
Rule 10A-3 promulgated by the SEC under the Exchange Act and Section 303A.06 of the NYSE Listed Company Manual require our Audit Committee to be composed entirely of independent directors upon the effective date of our registration statement. Our board of directors has affirmatively determined that Messrs. Bolt, McGuire, Sherman and Taylor meet the definition of “independent directors” under Section 303A of the NYSE Listed Company Manual and for purposes of serving on an audit committee under applicable SEC rules.
Compensation Committee
We have a Compensation Committee consisting of Mr. Sherman, Chairman, and Messrs. Bolt and Littlefair. The Compensation Committee has the responsibility for, among other things:
| • | recommending to our board of directors for consideration, the compensation and benefits of our executive officers and key employees; |
| • | monitoring and reviewing our compensation and benefit plans to ensure that they meet corporate objectives; |
| • | administering our stock and other incentive compensation plans and programs and preparing recommendations and periodic reports to the board of directors concerning these matters; |
| • | preparing the compensation committee report required by SEC rules to be included in our annual report; |
| • | preparing recommendations and periodic reports to the board of directors concerning these matters; and |
| • | handling such other matters that are specifically delegated to the compensation committee by our board of directors from time to time. |
Our board of directors has evaluated the independence of the members of our Compensation Committee and affirmatively determined that each of the members of our Compensation Committee is “independent” under Section 303A.02 of the NYSE Listed Company Manual.
Nominating and Corporate Governance Committee
We have a Nominating and Corporate Governance Committee consisting of Mr. Taylor, Chairman, Ms. Anderson and Messrs. Littlefair and McGuire. The Nominating and Corporate Governance Committee has responsibility for, among other things:
| • | recommending persons to be selected by our board of directors as nominees for election as directors and to fill any vacancies on the board; |
116
Table of Contents
Index to Financial Statements
| • | considering and recommending to our board of directors qualifications for the position of director and policies concerning the term of office of directors and the composition of the board; |
| • | monitoring our performance in meeting our obligations of fairness in internal and external matters and our principles of corporate governance; |
| • | considering and recommending to our board of directors other actions relating to corporate governance; and |
| • | handling such other matters that are specifically delegated to the nominating and corporate governance committee by our board of directors from time to time. |
In selecting director nominees for recommendation to the board of directors, the Nominating and Corporate Governance Committee will consider the following factors:
| • | the appropriate size and diversity of our board of directors; |
| • | our needs with respect to the particular talents and experience of directors; |
| • | the knowledge, skills and experience of nominees, including experience in technology, business, finance, administration and sales, in light of the prevailing business conditions and the knowledge, skills and experience already possessed by other members of the board of directors; |
| • | experience with accounting rules and practices, and whether such a person qualifies as an “audit committee financial expert” pursuant to SEC rules; and |
| • | balancing continuity of our board of directors with periodic injection of fresh perspectives provided by new board members. |
In identifying director nominees, the Nominating and corporate Governance Committee will first evaluate the current members of the board of directors willing to continue in service. Current members of the board of directors with skills and experience that are relevant to our business and who are willing to continue in service will be considered for re-nomination. If any member of the board of directors does not wish to continue in service or if the committee or the board of directors decides not to re-nominate a member for re-election, the committee will identify the desired skills and experience of a new nominee in light of the criteria above. Generally, the committee will strive to assemble a board of directors that brings to us a variety of perspectives and skills derived from business and professional experience. In doing so, the committee will also consider candidates with appropriate non-business backgrounds. Other than the foregoing, there are no specific, minimum qualifications that the committee believes that a recommended nominee must possess, although the committee may also consider such other factors as it may deem are in our and our shareholders’ best interests.
Code of ethics
We have adopted a code of business conduct and ethics that applies to all of our employees and directors, our subsidiaries and certain persons performing services for us. The code of ethics addresses, among other things, competition and fair dealing, conflicts of interest, financial matters and external reporting, company funds and assets, confidentiality and corporate opportunity requirements and the process for reporting violations of the code of ethics, employee misconduct, improper conflicts of interest or other violations.
117
Table of Contents
Index to Financial Statements
If a potential conflict of interest would constitute a “related party transaction,” then the terms of the proposed transaction must be reported in writing to our President and Chief Executive Officer, Executive Vice President – Chief Compliance Officer, or General Counsel, who must then refer, if necessary, the matter to our Audit Committee for approval. Generally, a related party transaction is a transaction that includes a director or executive officer, directly or indirectly, and us that exceeds $120,000 in amount, exclusive of employee compensation and directors’ fees.
118
Table of Contents
Index to Financial Statements
Compensation discussion and analysis
The following Compensation discussion and analysis should be read in conjunction with the “Summary compensation table” and related tables that are presented elsewhere in this prospectus.
Introduction and summary
The purpose of this Compensation discussion and analysis is to provide information about each material element of compensation that we pay or award to, or that is earned by: (i) the person who served as our principal executive officer during fiscal 2008; (ii) the person who served as our principal financial officer during fiscal 2008; and (iii) our three most highly compensated executive officers, other than the principal executive officer or principal financial officer, who were serving as executive officers, as determined in accordance with the rules and regulations promulgated by the SEC, as of December 31, 2008 with compensation during fiscal 2008 of $100,000 or more (the “Named Executive Officers”), and to explain the numerical and related information contained in the tables located below. For our 2008 fiscal year, our Named Executive Officers were:
| • | Alan White, Chairman, President and Chief Executive Officer; |
| • | Jeff Isom, Executive Vice President and Chief Financial Officer during 2008, and currently Executive Vice President of Finance and Accounting; |
| • | Hill Feinberg, Director and Chief Executive Officer of First Southwest; |
| • | Roseanna McGill, Chief Executive Officer of PrimeLending; and |
| • | Jerry Schaffner, Senior Executive Vice President of Lending; President of PlainsCapital Bank. |
Role of executive officers in determining compensation
The Compensation Committee acts on behalf of our board of directors to establish the company’s general compensation policies for our executive officers. The board of directors determines whether the Compensation Committee will make determinations as a committee or will make recommendations to the board of directors. In fiscal 2008, the Compensation Committee determined the compensation of our executive officers and delegated to senior executive officers compensation determinations for employees in their respective divisions.
Compensation philosophy and objectives
We have developed a compensation program for executives and other employees designed to meet the following goals:
| • | align the interest of executives and employees with those of our shareholders; |
| • | reward performance and further the long-term interests of our shareholders; |
| • | attract, motivate and retain executives and employees with competitive compensation for our industry and the labor markets in which we operate; |
119
Table of Contents
Index to Financial Statements
| • | build and encourage ownership by our employees of our shares; and |
| • | balance our short-term and long-term strategic goals. |
Compensation program structure and elements
To the extent permitted by law, including the EESA as amended by the ARRA, our management compensation program is comprised of four elements: base salary, cash bonus, equity-based compensation, and other benefits.
| • | Base salary. We pay base salary in order to recognize each Named Executive Officer’s unique value and historical contributions to our success in light of salary norms in the industry and the general marketplace; to match competitors for executive talent; to provide Named Executive Officers with sufficient, regularly paid income; and to reflect position and responsibility. |
In setting competitive salary levels, the Compensation Committee is advised by Corporate Human Resources, which regularly evaluates current salary levels by surveying similar institutions in the U.S. For example, in determining compensation for fiscal 2008 and 2009, the Compensation Committee was advised that Corporate Human Resources reviewed (i) Towers Perrin Financial Services Executive Database 2007/2008 U.S. Commercial Bank Report with appropriately aged data; and (ii) the Watson Wyatt 2008/2009 Survey Report on Financial Institution Compensation: General Executive Positions. In addition, Corporate Human Resources may from time to time obtain comparative data from independent third party consultants.
The Compensation Committee did not benchmark against any of these sources of information, but it did consider these sources of information in order to determine whether the compensation packages being offered by us were competitive. Based upon this information, the Compensation Committee has determined that the compensation packages being offered are competitive.
| • | Cash bonus. Until passage of the ARRA, we included an annual discretionary cash bonus as part of our management compensation program for all of our management team, including the Named Executive Officers, because we believe this element of compensation (i) helps focus management on, and motivate management to achieve, key annual corporate objectives by rewarding the achievement of these objectives and (ii) is necessary to be competitive from a total remuneration standpoint. On March 18, 2009, our Compensation Committee adopted a resolution proscribing the payment of any bonuses to our five most highly-compensated employees unless permitted under Section 111(b)(3)(D) of the EESA, as amended by the ARRA. Therefore, we anticipate that our Named Executive Officers will not receive a discretionary bonus during such time that we have any obligation arising from financial assistance provided under the TARP outstanding; unless they are in the form of long-term restricted stock that complies with Section 111(b)(3)(D) of the EESA, as amended by the ARRA and the regulations promulgated thereunder. |
Annual cash bonuses are an integral component of compensation that link and reinforce executive decision-making and performance with our annual objectives. Prior to the action of our Compensation Committee to limit discretionary bonuses in accordance with the ARRA, our Compensation Committee exercised its discretion in awarding cash bonuses on an annual basis. The Compensation Committee’s determination of whether to award a discretionary bonus for fiscal 2008 to each of the Named Executive Officers other than Mr. Feinberg, was based on a review by the Compensation Committee of both objective and subjective criteria but was not
120
Table of Contents
Index to Financial Statements
based upon any formal established objective criteria. Some of the objective criteria that were considered include (i) loan growth, (ii) deposit growth, (iii) general and administrative expense control, (iv) profitability and (v) other income growth. Throughout 2008, our board of directors, which included Mr. White, our President and Chief Executive Officer, Mr. Isom, our former Chief Financial Officer, Mr. Schaffner, President of the Bank, Ms. McGill, Chief Executive Officer of PrimeLending, and the members of the Compensation Committee, met periodically to evaluate our budget and overall performance, including the aforementioned criteria. In February 2009, the Compensation Committee determined the bonuses paid to the Named Executive Officers other than Mr. Feinberg, based on individual performance reviews, our budget and the Compensation Committee’s examination of our results for 2008. Ms. McGill’s bonus was also based on a review by the Compensation Committee of PrimeLending of both objective and subjective criteria, but was not based upon any formal established objective performance criteria. Mr. Feinberg will not receive a discretionary bonus for 2009.
| • | Equity-based compensation. Our equity-based compensation program is the primary vehicle for (i) aligning Named Executive Officers’ and other employees’ interests with the interests of our shareholders, (ii) offering long-term incentives and rewards to the Named Executive Officers and other employees, (iii) providing an incentive for retention of Named Executive Officers and employees and (iv) providing a competitive total compensation package. |
Equity-based compensation is awarded pursuant to four incentive stock option plans that were established in 2001, 2003, 2005 and 2007 (the “Stock Option Plans”). The Stock Option Plans provide for the granting of stock options to our officers and key employees. Each of the 2001, 2003 and 2005 Stock Option Plans provide for option grants that could result in the issuance of up to 150,000 shares of our common stock, subject to increase or decrease in the event of a stock dividend or stock split. Our 2007 Stock Option Plan provides for option grants that could result in the issuance of up to 450,000 shares of our common stock, subject to increase or decrease in the event of a stock dividend or stock split. At September 30, 2009, a total of 76,428 shares were available for grant under the Stock Option Plans. The Compensation Committee administers the Stock Option Plans. Subject to the terms of each Stock Option Plan, the Compensation Committee determines the persons who are to receive awards, the number of shares subject to each such award and the terms, types and conditions of such awards. Awards under the Stock Option Plans are based upon a review of both objective and subjective criteria and are not made upon any formal established objective goals. Since adoption of the resolution of our Compensation Committee on March 18, 2009, our Named Executive Officers will only be permitted to receive discretionary equity-based compensation in the form of long-term restricted stock that complies with Section 111(b)(3)(D) of the EESA and the regulations promulgated thereunder.
Effective as of the date that the U.S. Treasury’s preferred stock investment in us has been redeemed, the PlainsCapital Corporation 2009 Long-Term Incentive Plan (the “2009 Plan”) will replace each of our existing Stock Option Plans. The 2009 Plan is intended to enable us to remain competitive and innovative in our ability to attract, motivate, reward, and retain the services of key employees and outside directors. The 2009 Plan allows for the granting of incentive stock options, non-qualified stock options, stock appreciation rights, restricted stock, restricted stock units, performance awards, dividend equivalent rights, and other awards which may be granted singly, in combination, or in tandem. The 2009 Plan is expected to provide flexibility to our compensation methods in order to adapt the compensation of key employees and outside directors to a changing business environment (after giving due consideration to
121
Table of Contents
Index to Financial Statements
competitive conditions and the impact of accounting rules and federal tax laws). Subject to certain adjustments, the maximum number of shares of our common stock that may be delivered pursuant to awards under the 2009 Plan is 4,000,000 shares.
| • | Other benefits. Our Named Executive Officers also either participate in or are eligible to participate in our other benefit plans and programs on the same terms as other employees, including the PlainsCapital Corporation 401(k) Plan (the “401(k) Plan”), the PlainsCapital Corporation Employees’ Stock Ownership Plan (the “ESOP”), medical, dental and vision insurance, term life insurance, short-term disability insurance, and long-term disability insurance. Additionally, Mr. White, Mr. Isom and Mr. Schaffner participate in the PlainsCapital Bank Supplemental Executive Pension Plan (the “SEPP”). These benefits enable us to match competitors and retain talent. |
The 401(k) Plan is a qualified 401(k) savings and retirement plan. All of our employees, including the Named Executive Officers, are generally eligible to participate in the 401(k) Plan. To encourage retirement savings under the 401(k) Plan, we provide a discretionary employer matching contribution equal to a percentage of the participants’ elective deferrals. Under the terms of the 401(k) Plan for 2008, eligible employees were permitted to defer up to $15,500 of their eligible pay, and we made a matching contribution of 50% of the first 5% of eligible pay deferred by each eligible employee under the 401(k) Plan.
The ESOP was established in 2004 as a non-contributory qualified plan and provides for the granting of our common stock to eligible employees who have remained with us through the end of each year. The ESOP Committee administers the ESOP and makes recommendations to the Compensation Committee with respect to the annual discretionary contribution. On an annual basis, we make a discretionary contribution to the ESOP, which goes toward a release of shares to be allocated to participant accounts, including those of the Named Executive Officers. In fiscal year 2008, we contributed $1.4 million and released 46,203 shares into the ESOP on behalf of eligible participants. Stock is allocated to the account of each eligible participant in the ESOP annually based upon eligible compensation paid to each eligible participant. Qualified plans, such as the ESOP, are required to report account values on an annual basis under the Employer Retirement Income Security Act. Solely for this purpose, the ESOP trustee obtained an independent appraisal of the shares of our common stock held in the ESOP. As of December 31, 2008, the value of the shares of common stock held in the ESOP was determined to be $12.67 per share. Because there is no established public trading market for shares of our common stock, this value obtained for ESOP purposes may not reflect the actual market value of a share of our common stock.
More information on the terms of our SEPP is provided under the section entitled “Pension Benefits” below.
In addition to the foregoing, our compensation program takes into account a variety of factors unique to our organizational structure and business. Our senior management team manages an enterprise significantly more complex than a traditional bank holding company. Each of our three distinct business lines has a different area of focus and competes in different industries. In particular, we permit a decentralized approach to compensation, giving senior management the necessary discretion within their business lines to compensate professionals and staff consistent with industry norms for that business segment. In addition, each of these business lines is regulated by different regulators (in some cases, multiple regulators), and has different capital requirements and different compensation structures. This means that professionals within the
122
Table of Contents
Index to Financial Statements
First Southwest business segment will be compensated differently than those of the Bank, given the differences in the industries in which First Southwest and the Bank compete. Senior management of the Company must have an understanding of each of these industries, make capital allocation decisions among them and manage them as an overall whole, while also assisting the senior management of each business segment to fulfill its managerial responsibilities to its respective business segment. Accordingly, while banking comparables are helpful in providing guidance to the Compensation Committee, the Compensation Committee will also consider the compensation structure and inputs relating to other industries, including investment banking, mortgage banking and diversified financial service companies that cover banking and other financial services.
Tax code considerations
Section 162(m) of the Internal Revenue Code of 1986, as amended (the “Code”) disallows a corporate income tax deduction for executive compensation paid to its principal executive officer or any of its three other highest compensated officers (other than the principal executive officer and the principal financial officer) in excess of $1 million per year unless it is performance-based and is paid under a plan satisfying the requirements of Section 162(m). As a condition to our participation in the TARP Capital Purchase Program, we agreed not to claim any deduction for remuneration for federal income tax purposes in excess of $500,000 for our Named Executive Officers that would not be deductible if Section 162(m)(5) of the Code were applied to us. Our Compensation Committee believes that the compensation arrangements with certain of our Named Executive Officers will exceed the limits on deductibility during the current fiscal year.
TARP Capital Purchase Program
On December 19, 2008, we sold shares of our Series A and Series B Preferred Stock to the U.S. Treasury for approximately $87.6 million pursuant to the TARP Capital Purchase Program promulgated under the EESA. As a participant in the TARP Capital Purchase Program, we are subject to executive compensation limits and other restrictions until we redeem the Series A and Series B Preferred Stock. We intend to redeem the Series A and Series B Preferred Stock with the proceeds of this offering, subject to regulatory approval. Specifically, Section 111(b) of the EESA requires that that we: (i) ensure that our incentive compensation does not encourage our Named Executive Officers to take unnecessary and excessive risks; (ii) obtain the return of any bonus or incentive paid to our Named Executive Officers based on materially inaccurate earnings statements or similar criteria; (iii) agree to prohibit any golden parachute payments to our Named Executive Officers; and (iv) agree not to deduct more than $500,000 of the remuneration paid to our Named Executive Officers.
The ARRA was enacted on February 17, 2009. The ARRA includes a wide variety of programs intended to stimulate the U.S. economy and imposes certain new executive compensation and corporate governance obligations on all current and future TARP Capital Purchase Program participants, including us, until the institution has redeemed the preferred stock sold to the U.S. Treasury. The executive compensation restrictions under the ARRA (described below) are more stringent than those currently in effect under the TARP Capital Purchase Program.
Pursuant to authority granted to the Secretary of the Treasury under the ARRA, on June 15, 2009, the Treasury adopted and made effective the Interim Rule, which implemented and further expanded the limitations and restrictions imposed on TARP recipients (including us) concerning
123
Table of Contents
Index to Financial Statements
executive compensation and corporate governance by the TARP Capital Purchase Program and the EESA, as amended by the ARRA. The Interim Rule establishes standards including, but not limited to: (1) prohibitions on making golden parachute payments to senior executive officers and the next five most highly-compensated employees during such time as any obligation arising from financial assistance provided under the TARP remains outstanding (the “Restricted Period”); (2) prohibitions on paying or accruing bonuses or other incentive awards for certain senior executive officers and employees, except for awards of long-term restricted stock with a value equal to no greater than 1/3 of the subject employee’s annual compensation that do not fully vest during the Restricted Period or unless such compensation is pursuant to a valid written employment contract prior to February 11, 2009; (3) requirements that TARP Capital Purchase Program participants provide for the recovery of any bonus or incentive compensation paid to senior executive officers and the next 20 most highly-compensated employees based on statements of earnings, revenues, gains or other criteria later found to be materially inaccurate, with the Secretary having authority to negotiate for reimbursement; and (4) the establishment of the Special Master to review the compensation structures and payments of, and to independently issue advisory opinions to, those banks that have participated in the TARP Capital Purchase Program with respect to compensation structures and payments made by those banks during the Restricted Period. If the Special Master finds that a TARP recipient’s compensation structure or payments that it has made to its employees are inconsistent with the purposes of the EESA or TARP, or otherwise contrary to the public interest, the Special Master may negotiate with the TARP recipient and the subject employee for appropriate reimbursements to the TARP recipient or the federal government.
The Interim Rule and the ARRA also set forth additional corporate governance obligations for TARP recipients, including requirements for semi-annual meetings of compensation committees of the board of directors to discuss and evaluate employee compensation plans in light of an assessment of any risk posed from such compensation plans. TARP recipients are further required by the ARRA and the Interim Rule to have in place company-wide policies regarding excessive or luxury expenditures, permit non-binding shareholder “say-on-pay” proposals to be included in proxy materials, as well as require written certifications by the chief executive officer and chief financial officer with respect to compliance.
124
Table of Contents
Index to Financial Statements
Summary compensation table
The following table sets forth information regarding the total compensation received by or earned by our Named Executive Officers during 2008. This table and the accompanying narrative should be read in conjunction with the Compensation discussion and analysis, which sets forth the objectives and other information regarding our executive compensation program.
| Name and principal position |
Year | Salary ($) |
Bonus ($) |
Stock ($)(1) |
Option ($) |
Non-equity incentive plan compensation |
Change in ($)(2) |
All other ($)(3) |
Total ($) | |||||||||
| Alan White |
2008 | $1,350,000 | $500,000 | — | — | — | $348,237 | $894,141 | $3,092,378 | |||||||||
| (Chairman, President and Chief Executive Officer) |
||||||||||||||||||
| Jeff Isom (4) |
2008 | $ 240,000 | $ 70,000 | — | — | — | $ 31,980 | $157,664 | $ 499,644 | |||||||||
| Hill Feinberg |
2008 | $ 240,000 | $635,000 | — | — | — | — | $214,335 | $1,089,335 | |||||||||
| (Chief Executive Officer of First Southwest) |
||||||||||||||||||
| Roseanna McGill |
2008 | $ 375,000 | — | — | — | — | — | $ 24,302 | $ 399,302 | |||||||||
| (Chief Executive Officer of PrimeLending) |
||||||||||||||||||
| Jerry Schaffner |
2008 | $ 420,000 | $225,000 | — | — | — | $ 54,091 | $261,277 | $ 960,368 | |||||||||
| (President of PlainsCapital Bank) |
||||||||||||||||||
| (1) | We granted Messrs. White, Isom and Schaffner 150,000, 30,000, and 45,000 shares of our restricted stock on December 17, 2008, and Mr. Feinberg 36,000 shares of our restricted stock on December 31, 2008. Subject to certain exceptions, the shares of restricted stock vest ratably over a seven-year period. The grants are subject to the provisions of FAS 123R, and we expect to recognize the cost of these grants as compensation expense over the seven-year vesting period. |
| (2) | For each Named Executive Officer participating in the SEPP, includes the aggregate change in the actuarial present value of the Named Executive Officer’s accumulated benefit under the SEPP. |
| (3) | The following table is a breakdown of all other compensation included in the “Summary compensation table” for the Named Executive Officers. |
| (4) | During 2008 and until June 30, 2009, Mr. Isom served as our Executive Vice President and Chief Financial Officer. On July 1, 2009, Mr. Isom was appointed Executive Vice President of Finance and Accounting. |
125
Table of Contents
Index to Financial Statements
All other compensation
| Name | Year | Perquisites and other personal benefits(1) |
Gross-ups or other amounts reimbursed for the payment of taxes(2) |
Company contributions to defined contribution plans(3) |
Life insurance policies(4) |
Director fees(5) |
Total all other sation | |||||||
| Alan White |
2008 | $83,540 | $800,000 | $15,295 | $5,016 | $5,400 | $909,251 | |||||||
| Jeff Isom |
2008 | — | $135,000 | $15,295 | $1,969 | $5,400 | $157,664 | |||||||
| Hill Feinberg |
2008 | — | $205,073 | $ 7,750 | $1,512 | — | $214,335 | |||||||
| Roseanna McGill |
2008 | $12,161 | — | $ 5,750 | $1,591 | $4,800 | $ 24,302 | |||||||
| Jerry Schaffner |
2008 | $35,913 | $202,500 | $15,295 | $2,169 | $5,400 | $261,277 | |||||||
| (1) | For Mr. White, includes a car allowance of $36,000, $40,678 in club expenses, the personal use of PlainsCapital automobiles, and the personal use of PlainsCapital aircraft; for Ms. McGill, includes club expenses of $9,600 and $2,561 for the personal use of a PlainsCapital automobile; and, for Mr. Schaffner, includes a car allowance of $24,000, $10,391 in club expenses, the personal use of PlainsCapital automobiles and home alarm monitoring services. For each Named Executive Officer, excludes medical insurance premiums paid that are generally available to all employees of PlainsCapital on the same terms. |
| (2) | Represents gross-ups paid to each of Messrs. White, Isom, Feinberg and Schaffner, respectively, on shares of restricted stock granted to them in 2008. |
| (3) | For each of Messrs. White, Isom and Schaffner, includes PlainsCapital’s matching contribution on the 401(k) Plan in the amount of $5,750 and PlainsCapital’s contribution to the ESOP in the amount of $9,545 in each of their names. For Mr. Feinberg, represents PlainsCapital’s matching contribution on the 401(k) Plan of $7,750. For Ms. McGill, represents PlainsCapital’s matching contribution on the 401(k) Plan in the amount of $5,750. |
| (4) | For each of Ms. McGill and Messrs. White, Isom and Schaffner, includes $334 paid for basic life insurance and $483 paid for long-term disability insurance. For Mr. White, includes $3,425 paid for Bank Owned Life Insurance (BOLI) and $774 paid for group term life insurance. For Mr. Isom, includes $738 paid for BOLI and $414 paid for group term life insurance. For Mr. Feinberg, includes $1,512 paid for life insurance. For Mr. Schaffner, includes $938 paid for BOLI and $414 paid for group term life insurance. For Ms. McGill, includes $774 paid for group term life insurance. |
| (5) | During 2008, each of Ms. McGill and Messrs. White, Isom, and Schaffner were directors of PlainsCapital and were paid $600 for each regularly scheduled board of directors meeting such director attended and $1,200 for attending the board of directors meeting held in December. |
Grants of plan-based awards
The following table summarizes the 2008 grants of equity and non-equity plan-based awards.
| Name | All other stock awards: number of shares of stock (#)(1) |
All other options awarded: number of securities underlying options(#) |
Exercise price of base price of option awards($) |
Grant date fair value of stock and option awards ($)(2) | ||||
| Alan White |
970.2981 | — | — | $10,997 | ||||
| Jeff Isom |
959.5476 | — | — | $10,875 | ||||
| Hill Feinberg |
— | — | — | — | ||||
| Roseanna McGill |
— | — | — | — | ||||
| Jerry Schaffner |
970.2972 | — | — | $10,997 | ||||
| (1) | Represents shares of our common stock allocated to the account of each Named Executive Officer during 2008 under the ESOP based upon eligible compensation paid to such Named Executive Officer and from existing cash in each Named Executive Officer’s account. |
| (2) | The value of stock awarded is based upon the value of the stock imputed in the Merger Agreement in accordance with FAS 123R, which was $11.33 per share. |
126
Table of Contents
Index to Financial Statements
Narrative disclosure regarding Summary compensation table and Grants of plan-based awards table
Prior to January 1, 2009, we had employment agreements with each of Messrs. White, Schaffner, and Isom, and Mr. Feinberg had an employment agreement with First Southwest. The compensation reported in the Summary compensation table reflects amounts paid to each of Messrs. White, Schaffner, Isom and Feinberg in accordance with their employment agreements in effect during 2008. We entered into new employment agreements with each of Messrs. White, Schaffner, and Isom effective as of January 1, 2009, and these new employment agreements succeeded the prior agreements between us and each of these individuals. The new employment agreements of Messrs. White, Schaffner and Isom generally follow the terms of their respective employment agreements that were in effect during 2008, except that each of the agreements in effect in 2009 differs to the extent necessary to comply with the EESA and the ARRA and to conform to Section 409A of the Code. Additionally, Mr. White’s base salary for 2008 of $1,350,000 has been reduced to $1,000,000 for 2009. We have also entered into an employment agreement with Mr. Feinberg effective January 1, 2009, and this employment agreement succeeded the prior agreement between First Southwest and Mr. Feinberg. Mr. Feinberg’s employment agreement in effect during 2008 was entered into with First Southwest before our merger with First Southwest. As such, the terms of Mr. Feinberg’s employment agreement in effect during 2008 were negotiated by First Southwest and were not subject to our compensation and benefits policies.
We have entered into employment agreements with four of the Named Executive Officers: Alan White, Jerry Schaffner, Hill Feinberg, and Jeff Isom. The current employment agreements of Messrs. White and Schaffner are effective for three years, from January 1, 2009 until December 31, 2011. The employment agreement of Mr. Feinberg is effective for two years, from December 31, 2008 to December 31, 2010. The employment agreement of Mr. Isom is effective for two years, from January 1, 2009 until December 31, 2010. These employment agreements automatically renew, unless we or the Named Executive Officer elects not to renew the agreement. For Messrs. White and Schaffner, such renewal period is three years. For Messrs. Feinberg and Isom, such renewal period is one year. The employment agreements between us and our Named Executive Officers provide for the following benefits:
| • | Base salary. Messrs. White, Isom, Feinberg and Schaffner are entitled to an annual base salary, which is reviewed and adjusted at least annually. Such base salary may not be reduced except as mandated by the executive compensation restrictions of the EESA or the ARRA. In 2009, Messrs. White, Isom, Feinberg and Schaffner are entitled to an annual base salary of $1,000,000, $260,000, $240,000, and $420,000, respectively. |
| • | Bonus. Subject to the executive compensation restrictions of the EESA and the ARRA, Messrs. White, Isom, Feinberg and Schaffner are each eligible to receive a discretionary annual bonus as determined in the sole discretion of the board of directors. However, the annual bonus cannot be less than the average annual bonus paid to the Named Executive Officer over the three prior calendar years. The average annual bonus paid to Messrs. White, Isom, Feinberg and Schaffner over the three prior calendar years are approximately $477,000, $68,000, $1,032,000, and $220,000, respectively. |
| • | Restricted stock. Upon the execution of the employment agreements, Messrs. White, Isom, Feinberg and Schaffner were granted shares of restricted common stock. Such grants are subject to the terms and conditions of the restricted stock award agreement between us and |
127
Table of Contents
Index to Financial Statements
| the Named Executive Officer. Messrs. White, Isom, Feinberg and Schaffner were granted 150,000 shares, 30,000 shares, 36,000 shares and 45,000 shares, respectively. Each grant vests ratably over a seven-year period, with such vesting accelerated in full in the event of a “change in control” or “initial public listing,” each as defined in the restricted stock award agreement. |
| • | Reimbursement of expenses. We are required to reimburse Messrs. White, Isom, Feinberg and Schaffner for all out-of-pocket expenses incurred by the Named Executive Officer in the course of his duties, in accordance with our reimbursement policy. |
| • | Executive benefits. Messrs. White, Isom, Feinberg and Schaffner are entitled to participate in the employee benefit plans generally available to our employees and to all normal perquisites provided to our similarly situated employees. |
| • | Supplemental pension benefits. Messrs. White, Isom and Schaffner are entitled to participate in our SEPP, and the SEPP cannot be amended in a manner adverse to Messrs. White, Isom or Schaffner without their prior written consent. |
| • | BOLI agreement. We are required to maintain and pay insurance premiums on the bank owned life insurance policies with respect to Messrs. White, Isom and Schaffner. |
| • | Club membership. We are required to provide Messrs. White and Schaffner with country club membership benefits. Following their termination of employment, Messrs. White and Schaffner are entitled to purchase the country club membership from us for the fair market value of the membership interest. We are also required to provide Mr. Feinberg with reasonable access to a club for business use, as approved by our President and Chief Executive Officer, and to provide Mr. Isom with reasonable access to a country club or luncheon club for business use. |
| • | Automobile allowance. We are required to provide Messrs. White, Isom and Schaffner with a monthly automobile allowance to cover the monthly costs associated with the leasing or purchasing of an automobile. Messrs. White, Isom and Schaffner are entitled to a monthly automobile allowance of $3,000, $500 and $2,000, respectively. |
| • | Use of employer’s aircraft. Messrs. White and Schaffner are entitled to use our corporate aircraft, under terms and conditions consistent with our past practices. |
Equity-based compensation is also awarded to the Named Executive Officers pursuant to the Stock Option Plans. Each of Messrs. White, Isom and Schaffner also participates in the ESOP. Shares of our common stock are annually allocated to the account of each Named Executive Officer participating in the ESOP based upon eligible compensation paid to each Named Executive Officer.
128
Table of Contents
Index to Financial Statements
Outstanding equity awards at fiscal year end
The following table summarizes the total outstanding equity awards as of December 31, 2008 for each Named Executive Officer.
| Option awards | Stock awards | |||||||||||||||||||
| Name | Number of securities (#) exercisable |
Number of (#) unexercisable |
Equity (#) |
Option ($) |
Option expiration date |
Number (#) |
Market ($)(1) |
Equity (#) |
Equity ($) | |||||||||||
| Alan White |
12,960 |
(2) |
— | — | $6.6937 |
2/20/2012 |
150,000 | (3) | 1,700,000 | — | — | |||||||||
| 7,200 | (4) | $10.8806 | 4/1/2015 | |||||||||||||||||
| Jeff Isom |
7,776 | (2) | — | — | $6.6937 |
2/20/2012 |
30,000 | (3) | 340,000 | — | — | |||||||||
| 3,600 | (4) | $10.8806 | 4/1/2015 | |||||||||||||||||
| Hill Feinberg |
56,508 |
(5) |
— | — | $4.9133 |
10/31/2011 |
36,000 | (6) | 408,000 | — | — | |||||||||
| 70,650 | (5) | $3.0567 | 1/31/2010 | |||||||||||||||||
| Roseanna McGill |
— | — | — | — | — | — | — | — | — | |||||||||||
| Jerry Schaffner |
5,832 |
(2) |
— | — | $6.6937 |
2/20/2012 |
45,000 | (3) | 510,000 | — | — | |||||||||
| 7,200 | (4) | $10.8806 | 4/1/2015 | |||||||||||||||||
| (1) | The market value of each share of stock is calculated based upon the value of the stock imputed in the Merger Agreement, resulting in a value of $11.33 per share. |
| (2) | Options were granted on February 20, 2002, and all options vested six months following the date of grant. |
| (3) | Represents shares of our restricted stock awarded on December 17, 2008. These shares vest in equal installments, rounded down to the nearest whole number to avoid the issuance of any fractional shares, over a seven-year period, beginning with the first anniversary of the date of grant, December 17, 2009, and continuing each 17th day of December until December 17, 2015. Vesting of these shares accelerates upon a “change in control” or “initial public listing” of our common stock. |
| (4) | Options were granted on April 1, 2005, and all options vested six months following the date of grant. |
| (5) | Options were granted on December 31, 2008 pursuant to our acquisition of First Southwest, and all options were vested on the date of grant. 14,127 of Mr. Feinberg’s options expiring on October 31, 2011, and 17,661 of Mr. Feinberg’s options expiring on January 31, 2010 (the “Feinberg Earnout Options”), are subject to the earnout provisions of the Merger Agreement. The Feinberg Earnout Options are currently exercisable, but Mr. Feinberg may not receive the shares underlying the Feinberg Earnout Options until January 31, 2013, and the number of shares that he will receive upon exercise of the Feinberg Earnout Options, if any, is subject to reduction in accordance with the terms of the Merger Agreement. |
| (6) | Represents shares of our restricted stock awarded on December 31, 2008. These shares vest in equal installments, rounded down to the nearest whole number to avoid the issuance of any fractional shares, over a seven-year period, beginning with the first anniversary of the date of grant, December 31, 2009, and continuing each 31st day of December until December 31, 2015. Vesting of these shares accelerates upon a “change in control” or “initial public listing” of our common stock. |
Option exercises and stock vested in 2008
None of the Named Executive Officers acquired any shares of our stock upon the exercise of stock options or held any shares of our stock that vested in 2008.
129
Table of Contents
Index to Financial Statements
Pension benefits
| Name | Plan name | Number (#) |
Present value of ($) |
Payments ($) | ||||
| Alan White |
PlainsCapital Bank Supplemental Executive Pension Plan | 16 | $2,745,821 | — | ||||
| Jeff Isom |
PlainsCapital Bank Supplemental Executive Pension Plan | 8 | $ 176,539 | — | ||||
| Hill Feinberg |
PlainsCapital Bank Supplemental Executive Pension Plan | — | — | — | ||||
| Roseanna McGill |
PlainsCapital Bank Supplemental Executive Pension Plan | — | — | — | ||||
| Jerry Schaffner |
PlainsCapital Bank Supplemental Executive Pension Plan | 8 | $ 290,455 | — | ||||
We offer a noncontributory, nonqualified supplemental executive retirement plan, the SEPP, to 10 executives and senior officers, including several of the Named Executive Officers. The SEPP is intended to assist us in attracting and retaining key executive talent by supplementing the retirement benefits available under our qualified retirement plans. Retirement benefits payable under the SEPP are based on the participant’s average annual compensation and years of service. For participants who began participating in the SEPP on or after January 1, 2001, the normal retirement benefit is calculated as two percent (2%) of the participant’s average annual compensation multiplied by the participant’s number of full years of participation in the SEPP (rounded up in some circumstances to account for half-years), up to a maximum of 15 years. For participants who began participating in the SEPP prior to January 1, 2001, the normal retirement benefit is calculated as the greater of: (i) the formula set forth in the preceding sentence or (ii) sixty percent (60%) of the participant’s average annual compensation offset by amounts attributable to employer contributions to the Company’s qualified plans and benefits payable under Social Security and multiplied by a fraction representing the participant’s number of full years of participation in the SEPP (rounded up in some circumstances to account for half-years) over 15 (or if less, the maximum number of years the participant could have completed if he remained in the SEPP until age 65). Average annual compensation for purposes of the SEPP means the average base salary, excluding bonuses, paid to the participant over the participant’s highest paid three-year period occurring within the nine years before the participant’s termination of employment.
Participants are entitled to payment of benefits under the SEPP in the event of a termination of employment, including terminations due to death or disability; however, a participant’s benefits will be forfeited if the participant’s employment is terminated by us for “cause” as defined in the SEPP. In the event of death, payment will only be made to the participant’s spouse, if any, and will be limited to 50% of the accrued benefit. Participants who were under age 60 on December 31, 2009 will be entitled to receive their benefits in installments following termination of employment, and unpaid installments remain subject to forfeiture in the event of a violation of restrictive covenants related to confidentiality, competition, and solicitation of employees. Participants who have attained age 60 on or before December 31, 2009 will receive their benefits in a lump sum payment. A participant’s benefits are assumed to begin at the participant’s normal retirement age of 65. If a participant terminates with us, other than by death or disability, at an earlier date, his or her benefits will be adjusted to reflect the early or late retirement, as the case may be.
130
Table of Contents
Index to Financial Statements
We amended the SEPP in December 2008 and again in February 2009 to comply with Section 409A of the Code, which governs non-qualified deferred compensation, and the requirements of the Treasury’s TARP Capital Purchase Program.
Potential payments upon termination or change in control
Employment agreements between us and our Named Executive Officers generally provide that each Named Executive Officer may be terminated at any time, without severance, by the Named Executive Officer voluntarily or by us with Cause (as defined below). Ms. McGill does not have an employment agreement with us, and therefore, the following discussion of benefits payable upon a termination of employment or change in control does not apply to Ms. McGill.
Notwithstanding anything described herein, if a Named Executive Officer is considered a “specified employee” for purposes of Section 409A of the Code at the time of his or her termination of employment, other than in the case of a termination of employment due to the Named Executive Officer’s death, the payments and benefits provided upon such termination of employment may be subject to a six month delay to the extent such payments and benefits are subject to Section 409A of the Code.
Termination by us with Cause
In the event that a Named Executive Officer’s employment is terminated by us with Cause, or by the Named Executive Officer’s voluntary termination of employment with us (in the case of Messrs. White and Schaffner only, without Good Reason (as defined below)), then, subject to the executive compensation restrictions of the EESA and the ARRA, upon such termination of employment, the Named Executive Officer would be entitled to:
| • | the Named Executive Officer’s base salary through the effective date of such termination of employment at the annual rate in effect at the time notice of termination is given, payable within 10 business days after the effective date of such termination of employment; |
| • | any annual bonus earned as defined in the bonus plan but unpaid as of the effective date of such termination of employment for any previously completed fiscal year, payable within 10 business days after the effective date of such termination of employment; |
| • | all earned and unpaid and/or vested, nonforfeitable amounts owing or accrued at the effective date of such termination of employment under any of our compensation and benefit plans, programs, and arrangements in which the Named Executive Officer participated, payable in accordance with the terms and conditions of the plans, programs, and arrangements (and agreements and documents thereunder) pursuant to which such compensation and benefits were granted or accrued; and |
| • | reimbursement for any unreimbursed business expenses properly incurred by the Named Executive Officer in accordance with our policy prior to the effective date of such termination of employment. |
Termination by us without Cause
In the event that a Named Executive Officer’s employment is terminated by (a) us without Cause (other than pursuant to a Change in Control), or (b) us giving the Named Executive Officer notice
131
Table of Contents
Index to Financial Statements
of our intention to not renew his employment agreement and terminating the Named Executive Officer without Cause within 90 days after termination of the employment agreement, or (c) in the case of Messrs. White and Schaffner only, the Named Executive Officer’s termination of employment with us with Good Reason (other than pursuant to a Change in Control), then, subject to the executive compensation restrictions of the EESA and the ARRA, upon such termination of employment and conditioned upon the Named Executive Officer executing a release of claims, the Named Executive Officer would be entitled to:
| • | the amounts payable upon a termination by us for Cause as described above; and |
| • | a cash amount equal to a multiple of the sum of (i) the annual base salary rate of the Named Executive Officer immediately prior to the effective date of such termination of employment, and (ii) the average bonus paid to the Named Executive Officer in respect of the three calendar years immediately preceding the year of termination of employment. For Messrs. White and Schaffner, such severance multiple is equal to three (3) and the amount would be payable in 36 equal monthly installments (without interest) beginning on the first day of the month following the effective date of such termination of employment. For Messrs. Isom and Feinberg, such severance multiple is equal to one (1) and the amount would be payable in a lump-sum payment within 60 days following the effective date of such termination of employment. |
Messrs. White and Schaffner also would be entitled to the following benefits:
| • | a cash lump sum amount equal to (A) the Named Executive Officer’s annual bonus paid or payable with respect to the calendar year prior to the calendar year in which the effective date of such termination of employment occurs or, if higher, the average annual bonus paid or payable to the Named Executive Officer for the three calendar years preceding the calendar year in which the effective date of such termination of employment occurs, multiplied by (B) a fraction, the numerator of which equals the number of days the Named Executive Officer was employed by us during the year in which the effective date of such termination of employment occurs, and the denominator of which equals 365, payable within 10 business days after the effective date of such termination of employment; |
| • | continued participation for the Named Executive Officer and his dependents in our medical, dental, group life and long term disability plans, at our expense, for a period of two years following the termination of employment, or, if earlier, the date the Named Executive Officer becomes eligible to participate in comparable welfare plans maintained by a subsequent employer; or if continued participation is not permitted under the terms of the plans, equivalent coverage or a cash payment that, after all income and employment taxes on that amount, would be equal to the cost to the Named Executive Officer of obtaining such medical, dental, group life and long term disability benefit coverage; and |
| • | full vesting of all outstanding stock options then held by the Named Executive Officer, with the option to receive a cash payment equal to the then difference between the option price and the current fair market value of the stock as of the effective date of such termination of employment in lieu of the right to exercise such options. |
132
Table of Contents
Index to Financial Statements
Termination because of death or disability
In the event that a Named Executive Officer’s employment is terminated due to his death or disability, then, subject to the executive compensation restrictions of the EESA and the ARRA, the Named Executive Officer (or his estate) would be entitled to:
| • | the amounts payable upon a termination by us for Cause as described above. |
Messrs. White and Schaffner also would be entitled to the benefits to the following benefits:
| • | a cash lump sum amount equal to (A) the Named Executive Officer’s annual bonus paid or payable with respect to the calendar year prior to the calendar year in which the effective date of such termination of employment occurs or, if higher, the average annual bonus paid or payable to the Named Executive Officer for the three (3) calendar years preceding the calendar year in which the effective date of such termination of employment occurs, multiplied by (B) a fraction, the numerator of which equals the number of days the Named Executive Officer was employed by us during the year in which the effective date of such termination of employment occurs, and the denominator of which equals 365, payable within 10 business days after the effective date of such termination of employment. |
Termination upon change in control
In the event that a Named Executive Officer’s employment is terminated by (a) us without Cause within the 24 months immediately following, or the six months immediately preceding, a Change in Control, (b) the Named Executive Officer’s termination of employment for Good Reason within the 24 months immediately following, or the six months immediately preceding, a Change in Control, or (c), in the case of Messrs. White and Schaffner only, the Named Executive Officer’s voluntary termination of employment with us for any reason other than Good Reason within the six months immediately following a Change in Control, then, subject to the executive compensation restrictions of the EESA and the ARRA, upon such termination of employment, and conditioned upon the Named Executive Officer’s execution of a release of claims, the Named Executive Officer would be entitled to:
| • | the amounts payable upon a termination by us for Cause; |
| • | a cash lump sum amount equal to three times the sum of the Named Executive Officer’s (A) annual rate of salary in effect immediately prior to the effective date of such termination of employment or, if higher, the annual rate in effect immediately prior to the Change in Control and (B) annual bonus paid or payable with respect to the calendar year prior to the calendar year in which the effective date of such termination of employment occurs or, if higher, the average annual bonus paid or payable to the Named Executive Officer for the three calendar years preceding the calendar year in which the effective date of such termination of employment occurs, payable within 10 business days (or, in the case of Messrs. Isom and Feinberg, 60 business days) after the effective date of such termination of employment (or, if later, the effective date of the Change in Control); |
| • | continued participation for the Named Executive Officer and his dependents in our medical, dental, group life and long term disability plans, at our expense, for a period of two years following the termination of employment, or, if earlier, the date the Named Executive Officer becomes eligible to participate in comparable welfare plans maintained by a subsequent employer; |
133
Table of Contents
Index to Financial Statements
| • | continuation of the average auto allowance received by the Named Executive Officer during the 12 month period preceding the effective date of such termination of employment for a period of two years following the termination of employment, or, if earlier, the date the Named Executive Officer receives an auto allowance from a subsequent employer; and |
| • | full vesting of all outstanding stock options then held by the Named Executive Officer, with the option to receive a cash payment equal to the then difference between the option price and the current fair market value of the stock as of the effective date of such termination of employment in lieu of the right to exercise such options. |
With respect to Messrs. Isom and Feinberg only, in the event that any of the benefits payable upon a termination of employment in connection with a Change in Control would constitute “excess parachute payments,” such benefits would be reduced to the level necessary such that no excise tax will be due.
Messrs. White and Schaffner also would be entitled to the following benefits:
| • | a cash lump sum amount equal to (A) the Named Executive Officer’s annual bonus paid or payable with respect to the calendar year prior to the calendar year in which the effective date of such termination of employment occurs or, if higher, the average annual bonus paid or payable to the Named Executive Officer for the three calendar years preceding the calendar year in which the effective date of such termination of employment occurs, multiplied by (B) a fraction, the numerator of which shall equal the number of days the Named Executive Officer was employed by us during the year in which the effective date of such termination of employment occurs, and the denominator of which shall equal 365, payable within 10 business days after the effective date of such termination of employment; |
| • | if continued participation is not permitted under the terms of our medical, dental, group life and long term disability plans, equivalent coverage or a cash payment that, after all income and employment taxes on that amount, shall be equal to the cost to the Named Executive Officer of obtaining such medical, dental, group life and long term disability benefit coverage; and |
| • | a full gross-up payment in the event that the Named Executive Officer receives any payments from us (including pursuant to any stock option or equity awards) or its affiliates that are subject to tax under Section 4999 of the Code governing golden parachute payments. |
Change in control
Each of the Named Executive Officers, other than Ms. McGill, is a party to a Restricted Stock Award Agreement, under which, subject to the executive compensation restrictions of the EESA and the ARRA, any unvested shares of restricted stock will vest in full upon the occurrence of a change in control.
Definitions
“Cause” is generally defined to mean the following:
| • | the executive’s commission of an intentional act of fraud, embezzlement or theft in connection with the executive’s duties or in the course of his employment; |
| • | the executive’s commission of intentional wrongful damage to our property; |
134
Table of Contents
Index to Financial Statements
| • | the executive’s intentional wrongful disclosure of our trade secrets or our confidential information; |
| • | the executive’s intentional violation of any law, rule or regulation (other than traffic violations or similar offenses) or a final cease and desist order; |
| • | the executive’s intentional breach of fiduciary duty involving personal profit; or |
| • | the intentional action or inaction by the executive that causes material economic harm to us. |
“Good Reason” is generally defined to mean the following:
| • | without the executive’s express written consent, the assignment to the executive of any duties materially inconsistent with his positions, duties, responsibilities and status with us as of the beginning of the current term of his employment agreement or a significant material diminishment in his titles or offices as in effect at the beginning of the current term, or any removal of the executive from or any failures to re-elect the executive to any of such positions, except in connection with the termination of his employment for “cause” or as a result of his disability (within the meaning of our disability policy in effect at the time of the disability) or death, or termination by the executive other than for “good reason”; |
| • | a significant and material adverse diminishment in the nature or scope of the authorities, powers, functions or duties attached to the position with which the executive had immediately prior to the “change in control” or a reduction in the executive’s aggregate base salary, bonus and benefits from us without the prior written consent of the executive; |
| • | We relocate our principal executive offices or require the executive to have as his principal location of work any location which is in excess of 50 miles from the location thereof immediately prior to a “change in control”; or |
| • | any substantial and material breach of the executive’s employment agreement by us. |
“Change in Control” is generally defined to mean the following:
| • | We are merged or consolidated or reorganized into or with another corporation or other legal person and as a result of such merger, consolidation or reorganization less than 51 percent of the combined voting power of the then-outstanding securities of such corporation or person immediately after such transaction are held in the aggregate by the holders of our voting securities immediately prior to such transaction; |
| • | We sell all or substantially all of our assets to any other corporation or other legal person, with the exception that it will not be deemed to be a Change in Control if we sell assets to an entity that, immediately prior to such sale, held 51 percent of the combined voting power of the then-outstanding voting securities in common with us; |
| • | during any period of two consecutive years, individuals who at the beginning of any such period constitute our directors cease for any reason to constitute at least a majority thereof unless the election or the nomination for election by our shareholders of each of the directors first elected during such period was approved by a vote of at least two-thirds (2/3) of the our directors then still in office who were our directors at the beginning of any such period; or |
| • | any “person” or “group” (as defined in Sections 13(d)(3) and 14(d)(2) of the Exchange Act) is or becomes the beneficial owner, directly or indirectly, of more than 50 percent of the total voting power of our voting stock (or any entity which controls us), including by way of merger, consolidation, tender or exchange offer or otherwise. |
135
Table of Contents
Index to Financial Statements
We amended our employment agreements in December 2008 to comply with Section 409A of the Code, relating to nonqualified deferred compensation.
Set forth below are the amounts that the Named Executive Officers would have received, in addition to the accrued benefits payable upon a termination for Cause as described above, if the specified events had occurred on December 31, 2008. These amounts are based upon a stock price of $11.33 per share, the value of our stock imputed in the Merger Agreement. These amounts do not reflect the limitations that would be imposed upon the payment of benefits upon termination of employment of the Named Executive Officers due to our participation in the TARP Capital Purchase Program.
| Alan White | Termination without cause or after non-renewal of employment |
Termination due to death |
Termination due to disability |
Termination upon change in control |
||||||||||
| Cash Severance(1) |
$ | 5,650,000 | (9) | N/A | N/A | $ | 5,650,000 | (9) | ||||||
| Accrued Bonus(2) |
$ | 533,333 | $ | 533,333 | $ | 533,333 | $ | 533,333 | ||||||
| Welfare Benefits(3) |
$ | 21,406 | N/A | N/A | $ | 21,406 | ||||||||
| Auto Allowance(4) |
N/A | N/A | N/A | $ | 72,000 | |||||||||
| Stock Options(5) |
$ | 63,390 | N/A | N/A | $ | 63,390 | ||||||||
| Supp. Pension(6) |
$ | 2,745,821 | $ | 1,372,911 | $ | 3,674,527 | $ | 2,745,821 | ||||||
| Life/AD&D Benefits(7) |
N/A | $ | 1,648,841 | N/A | N/A | |||||||||
| Tax Gross-Up(8) |
N/A | N/A | N/A | $ | 2,461,018 | |||||||||
| Total |
$ | 9,013,950 | $ | 3,555,085 | $ | 4,207,860 | $ | 11,546,968 | ||||||
| (1) | Cash Severance calculation based on three times the sum of (i) the base salary on December 31, 2008 and (ii) the average bonus paid with respect to 2005, 2006, and 2007 unless the termination of employment is in connection with a Change in Control, in which case the Cash Severance calculation based on three times the sum of (i) the base salary on December 31, 2008 and (ii) the bonus paid for 2007, or, if higher, the average bonus paid with respect to 2005, 2006, and 2007. |
| (2) | Accrued Bonus calculation based on the bonus paid for 2007, or, if higher, the average bonus paid with respect to 2005, 2006, and 2007. |
| (3) | Welfare Benefits calculation based on the cost of continuing coverage under the medical, dental, group life, and long-term disability plans for two years. |
| (4) | Auto Allowance calculation based on $3,000 monthly automobile allowance continued for two years. |
| (5) | Stock Option calculation based on options outstanding as of December 31, 2008, which include 12,960 options at an exercise price of $6.6937 and 7,200 options at an exercise price of $10.8806. |
| (6) | Supplemental Pension Benefits calculation based on accrued benefit as of December 31, 2008. |
| (7) | Includes life insurance and accidental death and dismemberment insurance policies in the amount of $200,000 per policy and $1,248,841 of a bank owned life insurance policy that may be payable to the estate of Mr. White. |
| (8) | Tax Gross-Up calculation based on whether benefits payable in connection with a change in control exceed three times the Named Executive Officer’s average W-2 compensation for the five-year period (2003, 2004, 2005, 2006, and 2007). |
| (9) | Reflects the amount payable to Mr. White pursuant to his previous employment agreement that was terminated on December 31, 2008. As discussed above under the section entitled “Narrative disclosure regarding Summary compensation table and Grants of plan-based awards table,” Mr. White’s salary under his current employment agreement was reduced to $1,000,000 from $1,350,000 under his previous employment agreement. |
136
Table of Contents
Index to Financial Statements
| Jerry Schaffner | Termination without cause or after non-renewal of employment agreement or for good reason |
Termination due to death |
Termination due to disability |
Termination upon change in control | ||||||||
| Cash Severance(1) |
$ | 1,855,000 | N/A | N/A | $ | 1,935,000 | ||||||
| Accrued Bonus(2) |
$ | 225,000 | $ | 225,000 | $ | 225,000 | $ | 225,000 | ||||
| Welfare Benefits(3) |
$ | 35,203 | N/A | N/A | $ | 35,203 | ||||||
| Auto Allowance(4) |
N/A | N/A | N/A | $ | 48,000 | |||||||
| Stock Options(5) |
$ | 30,318 | N/A | N/A | $ | 30,318 | ||||||
| Supp. Pension(6) |
$ | 290,455 | $ | 145,228 | $ | 656,690 | $ | 471,993 | ||||
| Life/AD&D Benefits(7) |
N/A | $ | 1,085,804 | N/A | N/A | |||||||
| Tax Gross-Up(8) |
N/A | N/A | N/A | $ | 929,674 | |||||||
| Total |
$ | 2,435,976 | $ | 1,456,032 | $ | 881,690 | $ | 3,675,188 | ||||
| (1) | Cash Severance calculation based on three times the sum of (i) the base salary on December 31, 2008 and (ii) the average bonus paid with respect to 2005, 2006, and 2007 unless the termination of employment is in connection with a Change in Control, in which case the Cash Severance calculation based on three times the sum of (i) the base salary on December 31, 2008 and (ii) the bonus paid for 2007, or, if higher, the average bonus paid with respect to 2005, 2006, and 2007. |
| (2) | Accrued Bonus calculation based on the bonus paid for 2007, or, if higher, the average bonus paid with respect to 2005, 2006, and 2007. |
| (3) | Welfare Benefits calculation based on the cost of continuing coverage under the medical, dental, group life, and long-term disability plans for two years. |
| (4) | Auto Allowance calculation based on $2,000 monthly automobile allowance continued for two years. |
| (5) | Stock Option calculation based on options outstanding as of December 31, 2008, which include 5,832 options at an exercise price of $6.6937 and 7,200 options at an exercise price of $10.8806. |
| (6) | Supplemental Pension Benefits calculation based on accrued benefit as of December 31, 2008. |
| (7) | Includes life insurance and accidental death and dismemberment insurance policies in the amount of $200,000 per policy and $685,804 of a bank owned life insurance policy that may be payable to the estate of Mr. Schaffner. |
| (8) | Tax Gross-Up calculation based on whether benefits payable in connection with a change in control exceed three times the Named Executive Officer’s average W-2 compensation for the five-year period (2003, 2004, 2005, 2006, and 2007). |
| Hill Feinberg | Termination without cause or after non-renewal of employment agreement |
Termination due to death |
Termination due to disability |
Termination upon change in control | ||||||||
| Cash Severance(1) |
$ | 1,480,000 | N/A | N/A | $ | 4,800,000 | ||||||
| Accrued Bonus |
N/A | N/A | N/A | N/A | ||||||||
| Welfare Benefits(2) |
N/A | N/A | N/A | $ | 20,403 | |||||||
| Auto Allowance |
N/A | N/A | N/A | N/A | ||||||||
| Stock Options(3) |
N/A | N/A | N/A | $ | 947,528 | |||||||
| Life/AD&D Benefits |
N/A | $ | 700,000 | N/A | N/A | |||||||
| Total |
$ | 1,480,000 | $ | 700,000 | $ | 0 | $ | 5,767,931 | ||||
| (1) | Cash Severance calculation based on one (1) times the sum of (i) the base salary on December 31, 2008 and (ii) the average bonus paid with respect to 2005, 2006, and 2007 unless the termination of employment is in connection with a Change in Control, in which case the Cash Severance calculation based on three times the sum of (i) the base salary on December 31, 2008 and (ii) the bonus paid for 2007, or, if higher, the average bonus paid with respect to 2005, 2006, and 2007. |
| (2) | Welfare Benefits calculation based on the cost of continuing coverage under the medical, dental, group life, and long-term disability plans for two years. |
| (3) | Stock Option calculation based on options outstanding as of December 31, 2008, which include 56,508 options at an exercise price of $4.9133 and 70,650 options at an exercise price of $3.0567. |
137
Table of Contents
Index to Financial Statements
| Jeff Isom | Termination without cause or after non-renewal of employment agreement |
Termination due to death |
Termination due to disability |
Termination upon change in control | ||||||||
| Cash Severance(1) |
$ | 306,667 | N/A | N/A | $ | 930,000 | ||||||
| Accrued Bonus |
N/A | N/A | N/A | N/A | ||||||||
| Welfare Benefits(2) |
N/A | N/A | N/A | $ | 35,203 | |||||||
| Auto Allowance(3) |
N/A | N/A | N/A | $ | 12,000 | |||||||
| Stock Options(4) |
N/A | N/A | N/A | $ | 37,708 | |||||||
| Supp. Pension(5) |
$ | 176,539 | $ | 88,270 | $ | 376,545 | $ | 286,872 | ||||
| Life/AD&D Benefits(6) |
N/A | $ | 912,241 | N/A | N/A | |||||||
| Total |
$ | 483,206 | $ | 1,000,511 | $ | 376,545 | $ | 1,301,783 | ||||
| (1) | Cash Severance calculation based on one (1) times the sum of (i) the base salary on December 31, 2008 and (ii) the average bonus paid with respect to 2005, 2006, and 2007 unless the termination of employment is in connection with a Change in Control, in which case the Cash Severance calculation based on three times the sum of (i) the base salary on December 31, 2008 and (ii) the bonus paid for 2007, or, if higher, the average bonus paid with respect to 2005, 2006, and 2007. |
| (2) | Welfare Benefits calculation based on the cost of continuing coverage under the medical, dental, group life, and long-term disability plans for two years. |
| (3) | Auto Allowance calculation based on $500 monthly automobile allowance continued for two years. |
| (4) | Stock Option calculation based on options outstanding as of December 31, 2008, which include 7,776 options at an exercise price of $6.6937 and 3,600 options at an exercise price of $10.8806. |
| (5) | Supplemental Pension Benefits calculation based on accrued benefit as of December 31, 2008. |
| (6) | Includes life insurance and accidental death and dismemberment insurance policies in the amount of $200,000 per policy and $512,241 of a bank owned life insurance policy that may be payable to the estate of Mr. Isom. |
| Roseanna McGill | Termination without cause or after non-renewal of employment agreement |
Termination due to death |
Termination due to disability |
Termination upon change in control | |||||
| Cash Severance |
N/A | N/A | N/A | N/A | |||||
| Accrued Bonus |
N/A | N/A | N/A | N/A | |||||
| Welfare Benefits |
N/A | N/A | N/A | N/A | |||||
| Auto Allowance |
N/A | N/A | N/A | N/A | |||||
| Stock Options |
N/A | N/A | N/A | N/A | |||||
| Supp. Pension |
N/A | N/A | N/A | N/A | |||||
| Life/AD&D Benefits(1) |
N/A | $ | 400,000 | N/A | N/A | ||||
| Total |
N/A | $ | 400,000 | N/A | N/A | ||||
| (1) | Includes life insurance and accidental death and dismemberment insurance policies in the amount of $200,000 per policy in name Ms. McGill. |
Recent developments
Effective as of July 1, 2009, we appointed Allen Custard to serve as our Executive Vice President and Chief Financial Officer. Mr. Custard is a party to an employment agreement with us, pursuant to which he served as a Managing Director of First Southwest, and such agreement, as amended, remains in effect (the “Custard Employment Agreement”). The Custard Employment Agreement has an initial term expiring on December 31, 2010, and automatically renews for subsequent one year terms. Pursuant to the Custard Employment Agreement, Mr. Custard is entitled to an annual base salary of $175,000 and benefits generally available to our other
138
Table of Contents
Index to Financial Statements
employees. Because we have added to the duties of Mr. Custard through his appointment, effective as of July 1, 2009, we increased Mr. Custard’s annual base salary to $300,000 and, subject to applicable law, will pay Mr. Custard a bonus of $100,000. Subject to restrictions in the EESA, as amended, and the rules and regulations promulgated thereunder, Mr. Custard is also entitled to receive bonuses at the end of each calendar year in an amount not less than the average annual bonus paid to Mr. Custard by us over the prior three years. The Custard Employment Agreement may be terminated at any time, without severance, by Mr. Custard voluntarily or by us with “Cause”. If Mr. Custard’s employment is terminated by us without “Cause,” then he will be entitled to severance pay equal to one year’s base salary and the average bonus paid to him by us over the prior three years. If Mr. Custard’s employment is terminated within the six months preceding or the twenty-four months following a “Change of Control,” Mr. Custard may be entitled to receive additional severance payments.
Director compensation
The following table summarizes the compensation paid by us to directors who are not Named Executive Officers for the fiscal year ended December 31, 2008.
| Name | Fees paid in cash ($) |
Stock awards ($) |
Option awards ($) |
Non-Equity incentive plan compensation ($) |
Change in pension value and nonqualified deferred compensation earnings ($) |
All other compensation ($) |
Total ($) | |||||||
| Norton Baker |
$10,800 | — | — | — | — | — | $10,800 | |||||||
| George S. Bayoud, Jr. |
$10,800 | — | — | — | — | — | $10,800 | |||||||
| Pryor Blackwell |
$ 4,800 | — | — | — | — | — | $ 4,800 | |||||||
| R. Crawford Brock |
$10,800 | — | — | — | — | — | $10,800 | |||||||
| Hon. Giles Dalby |
$ 8,400 | — | — | — | — | — | $ 8,400 | |||||||
| Mark Griffin |
$ 9,600 | — | — | — | — | — | $ 9,600 | |||||||
| Craig Hester |
$ 4,800 | — | — | — | — | — | $ 4,800 | |||||||
| James Huffines |
$ 5,400 | — | — | — | — | — | $ 5,400 | |||||||
| Robert R. King, M.D. |
$ 9,600 | — | — | — | — | — | $ 9,600 | |||||||
| Lee Lewis |
$10,800 | — | — | — | — | — | $10,800 | |||||||
| Matthew Malouf |
$10,800 | — | — | — | — | — | $10,800 | |||||||
| George H. McCleskey |
$ 5,400 | — | — | — | — | — | $ 5,400 | |||||||
| John C. Owens |
$ 5,400 | — | — | — | — | — | $ 5,400 | |||||||
| DeWayne (De) Pierce |
$ 5,400 | — | — | — | — | — | $ 5,400 | |||||||
| Wayne Pope |
$10,800 | — | — | — | — | — | $10,800 | |||||||
| Robert L. Pou, III |
$ 9,600 | — | — | — | — | — | $ 9,600 | |||||||
| Ted Rushing |
$10,800 | — | — | — | — | — | $10,800 | |||||||
| Michael A. Seger, M.D. |
$ 6,000 | — | — | — | — | — | $ 6,000 | |||||||
| Robert Taylor, Jr. |
$10,800 | — | — | — | — | — | $10,800 | |||||||
Narrative disclosure regarding director compensation table
Prior to March 18, 2009, we had 22 members of our board of directors. On March 18, 2009, our board of directors was reduced to nine members. We pay members of our board of directors based on the directors’ participation in board meetings held throughout the year. During 2008, we paid each non-employee director $1,200 for each regularly scheduled board of directors meeting that such director attended and $2,400 for attending the board of directors meeting held in December,
139
Table of Contents
Index to Financial Statements
and we paid each employee director $600 for each regularly scheduled board of directors meeting such director attended and $1,200 for attending the board of directors meeting held in December. We also reimbursed our directors for reasonable travel expenses. During 2009, our non-employee directors received $2,500 for each board of directors’ meeting that they attended during the year and a $4,000 retainer. Additionally, our employee directors have received $1,250 for each board of directors’ meeting that they attend during the year. All payments for directors’ fees have been made in cash.
On September 17, 2009, our board of directors amended our directors’ compensation. Beginning September 17, 2009, each of our directors has received $2,500 for each board of directors’ meeting attended. In addition, our non-employee directors each receive an annual cash retainer of $15,000 and are entitled to receive an annual grant of restricted shares of our common stock having a value of $15,000 on the date of grant. The chairman of our Audit Committee receives an additional $5,000 annual retainer.
140
Table of Contents
Index to Financial Statements
Certain relationships and related transactions
The Bank has had, and may be expected to have in the future, lending relationships in the ordinary course of business with our directors and executive officers, members of their immediate families and affiliated companies in which they are employed or in which they are principal equity holders. In our management’s opinion, the lending relationships with these persons were made in the ordinary course of business and on substantially the same terms, including interest rates, collateral and repayment terms, as those prevailing at the time for comparable transactions with persons not related to us and do not involve more than normal collection risk or present other unfavorable features.
The Bank is party to two capital lease agreements with entities controlled by Pryor Blackwell, a former member of our board of directors, pursuant to which the Bank leases a facility in Weatherford, Texas and a facility in Dallas, Texas for its banking operations. The aggregate amount of the lease payments under the capital lease agreements in the first nine months of 2009 and in the years 2008, 2007 and 2006 were $0.5 million, $0.7 million, $0.4 million and $0.1 million, respectively. During the first nine months of 2009 and in the years 2008, 2007 and 2006, we paid Lee Lewis Construction, Inc., a construction company owned and operated by Lee Lewis, one of our directors, $0.1 million, $0.3 million, $0.8 million and $0.9 million, respectively, for certain construction services during such years.
During 2006, 2007 and 2008 and until March 18, 2009, each of Messrs. Craig Hester, James Huffines, George McCleskey, John Owens, and DeWayne Pierce served as both a director and our employee. Additionally, Dawn Robinson, the daughter of Roseanna McGill, one of our Named Executive Officers, served as one of our employees. Pursuant to our employment arrangements with these individuals, we paid an aggregate of approximately $2.2 million, $3.5 million, $2.8 million and $2.5 million, respectively, as compensation for their services as employees during the first nine months of 2009 and in the years 2008, 2007 and 2006.
In 2007, the Bank contracted with Cowboys Stadium, L.P., a company affiliated with the employer of Ms. Anderson, for the 20-year lease of a suite at Cowboys Stadium beginning in 2009. Pursuant to the lease agreement, the Bank has agreed to pay Cowboys Stadium, L.P. annual payments of $500,000, subject to possible annual escalations, not to exceed 3% per year, beginning with the tenth year of the lease.
We have adopted a code of business conduct and ethics that applies to all of our employees and directors, our subsidiaries and certain persons performing services for us. The code of ethics addresses, among other things, competition and fair dealing, conflicts of interest, financial matters and external reporting, company funds and assets, confidentiality and corporate opportunity requirements and the process for reporting violations of the code of ethics, employee misconduct, improper conflicts of interest or other violations.
If a potential conflict of interest would constitute a “related party transaction,” then the terms of the proposed transaction must be reported in writing to our President and Chief Executive Officer, Executive Vice President—Chief Compliance Officer, or General Counsel, who must then refer, if necessary, the matter to our Audit Committee for approval. Generally, a related party transaction is a transaction that includes a director or executive officer, directly or indirectly, and us that exceeds $120,000 in amount, exclusive of employee compensation and directors’ fees.
Our board of directors has evaluated the independence of the members of our board of directors based upon the rules of the NYSE. Based upon this standard, our board of directors has affirmatively determined that the following members of our board of directors are independent: Charlotte Jones
141
Table of Contents
Index to Financial Statements
Anderson, Tracy Bolt, Andrew Littlefair, Michael McGuire, Haag Sherman and Robert Taylor, Jr.
Additionally, each of these directors meets the categorical standards for independence established by our board of directors, as set forth in our Categorical Standards of Director Independence. A copy of our Categorical Standards of Director Independence will be available on our website upon the consummation of this offering. Our website and the information contained therein or connected thereto shall not be deemed to be incorporated into this prospectus or the registration statement of which it forms a part.
Five of these directors, Ms. Anderson and Messrs. Bolt, Littlefair, McGuire and Taylor, have, or a member of their immediate family or an affiliated company in which they are employed or in which they are a principal equity holder has, received loans from the Bank in the ordinary course of business which our board of directors did not view as compensation. These loans were made on substantially the same terms, including interest rates and collateral, as those prevailing at the time for comparable transactions with other unaffiliated persons and do not involve more than normal risk of collectibility.
142
Table of Contents
Index to Financial Statements
Principal and selling security holders
The following table and accompanying footnotes set forth as of September 30, 2009, certain information regarding the beneficial ownership of the shares of our common stock by: (i) each person who is known by us to own beneficially more than 5% of such shares; (ii) each member of our board of directors and each of our named executive officers; (iii) all of our directors and executive officers as a group (13 persons); and (iv) each of the selling shareholders. Alan White, our Chairman, President and Chief Executive Officer; Allen Custard, our Executive Vice President and Chief Financial Officer; Jeff Isom, our Executive Vice President of Finance and Accounting; Hill Feinberg, Chief Executive Officer of First Southwest; Roseanna McGill, Chief Executive Officer of PrimeLending; and Jerry Schaffner, Senior Executive Vice President of Lending and President of the Bank, are currently the only executive officers of PlainsCapital. Except as otherwise indicated, the beneficial owners listed in the table below have sole voting and investment powers with respect to the shares indicated, and the address for each beneficial owner is 2323 Victory Avenue, Suite 1400, Dallas, Texas 75219. The applicable percentage ownership is based on 33,813,813 shares of our common stock issued as of September 30, 2009, plus, on an individual basis, the right of that individual to obtain common stock upon exercise of stock options within 60 days of September 30, 2009. The aggregate amount of shares of our common stock issued includes 1,697,430 shares of common stock that are held in escrow by an escrow agent on behalf of the former stockholders of First Southwest that may be released to such stockholders upon the satisfaction of the earnout provisions contained in the Merger Agreement. The former stockholders of First Southwest are entitled to vote these earnout shares prior to their cancellation or release from escrow.
| Original Common Stock beneficially owned before this offering(1) |
Common Stock and Original Common Stock, as a single class, beneficially owned after this offering(2) |
Common Stock and Original Common Stock, as a single class, beneficially owned after this offering assuming full exercise of the option to purchase additional shares(2) | |||||||||||||
| Name | Number | Percentage | Shares of Common Stock offered(3) |
Number | Percentage | Number | Percentage | ||||||||
| Directors and Officers |
|||||||||||||||
| Charlotte Jones Anderson |
— | — | — | — | — | — | — | ||||||||
| Tracy Bolt |
— | — | — | — | — | — | — | ||||||||
| Allen Custard(4) |
130,863 | * | — | 130,863 | * | 130,863 | * | ||||||||
| Hill A. Feinberg(5) |
2,165,145 | 6.4% | 120,000 | 2,045,145 | 4.6% | 2,045,145 | 4.4% | ||||||||
| Jeff Isom(6) |
106,470 | * | — | 106,470 | * | 106,470 | * | ||||||||
| Lee Lewis(7) |
777,600 | 2.3% | 77,700 | (8) | 699,900 | 1.6% | 699,900 | 1.5% | |||||||
| Andrew Littlefair |
— | — | — | — | — | — | — | ||||||||
| Michael McGuire |
— | — | — | — | — | — | — | ||||||||
| Roseanna McGill(9) |
39,876 | * | — | 39,876 | * | 39,876 | * | ||||||||
| Jerry Schaffner(10) |
223,476 | * | — | 223,476 | * | 223,476 | * | ||||||||
| Haag Sherman |
— | — | — | — | — | — | — | ||||||||
| Robert Taylor, Jr. |
32,877 | * | — | 32,877 | * | 32,877 | * | ||||||||
| Alan B. White(11) |
2,805,189 | 8.3% | 250,000 | (12) | 2,555,189 | 5.6% | 2,555,189 | 5.5% | |||||||
| PlainsCapital Officers and Directors as a Group (13 persons) |
6,259,736 | 18.4% | 447,700 | 5,812,036 | 13.1% | 5,812,036 | 12.5% | ||||||||
| 5% Shareholders |
|||||||||||||||
| PlainsCapital Corporation ESOP(13) |
1,721,118 | 5.1% | — | 1,721,118 | 3.9% | 1,721,118 | 3.7% | ||||||||
143
Table of Contents
Index to Financial Statements
| Original Common Stock beneficially owned before this offering(1) |
Common Stock and Original Common Stock, as a single class, beneficially owned after this offering(2) |
Common Stock and Original Common Stock, as a single class, beneficially owned after this offering assuming full exercise of the option to purchase additional shares(2) | |||||||||||||
| Name | Number | Percentage | Shares of Common Stock offered(3) |
Number | Percentage | Number | Percentage | ||||||||
| Other Selling Shareholders |
|||||||||||||||
| Kerry Adair(14) |
21,165 | * | 21,165 | (14) | — | — | — | — | |||||||
| Clinton Powell Adams(15) |
30,453 | * | 30,453 | — | — | — | — | ||||||||
| Jack E. Addams |
76,296 | * | 3,000 | 73,296 | * | 73,296 | * | ||||||||
| IM Alison I Ash Trust(16) |
209,280 | * | 209,280 | — | — | — | — | ||||||||
| Alison Igo Ash 1995 GS Trust(17) |
28,539 | * | 28,539 | — | — | — | — | ||||||||
| Bar None, Ltd.(18) |
97,491 | * | 49,200 | 48,291 | — | 48,291 | — | ||||||||
| Paul M. Bass, Jr.(19) |
124,338 | * | 23,275 | (20) | 101,063 | * | 101,063 | * | |||||||
| Ronald C. Berg(21) |
30,456 | * | 2,300 | 28,156 | * | 28,156 | * | ||||||||
| Harold Edward Bergman Jr.(22) |
26,077 | * | 1,600 | 24,477 | * | 24,477 | * | ||||||||
| Kara Lieske Bergstein Irrevocable Trust #1 PlainsCapital Bank Trustee(23) |
6,564 | * | 5,900 | 664 | * | 664 | * | ||||||||
| Saskia Katrin Bergstein Irrevocable Trust #1 PlainsCapital Bank Trustee(24) |
6,564 | * | 5,900 | 664 | * | 664 | * | ||||||||
| Petra Adriana Bergstein Irrevocable Trust #1 PlainsCapital Bank Trustee(25) |
6,564 | * | 5,900 | 664 | * | 664 | * | ||||||||
| Julie Black |
14,259 | * | 9,900 | 4,359 | * | 4,359 | * | ||||||||
| Carrol Blackwell |
37,695 | * | 15,000 | 22,695 | * | 22,695 | * | ||||||||
| Bob Jordan Amusement Co., Inc.(26) |
25,920 | * | 7,300 | 18,620 | * | 18,620 | * | ||||||||
| Carol Suzanne Ratliff Bryant(27) |
198,132 | * | 19,000 | 179,132 | * | 179,132 | * | ||||||||
| Jason Paladin Burchard Irrevocable Trust #1 PlainsCapital Bank Trustee(28) |
10,668 | * | 9,600 | 1,068 | * | 1,068 | * | ||||||||
| Jeremy Ray Burchard Irrevocable Trust #1 PlainsCapital Bank Trustee(29) |
10,668 | * | 9,600 | 1,068 | * | 1,068 | * | ||||||||
| Cindy Burgess |
52,110 | * | 45,000 | 7,110 | * | 7,110 | * | ||||||||
| Fernando M. Bustos, as Receiver for Benny L. Judah and Excel Lease Fund, Inc., Civil Action No. 5-09CV0087-C, In the United States District Court for the Northern District of Texas, Lubbock Division(30) |
137,772 | * | 137,772 | — | — | — | — | ||||||||
| BV Investments, LP(31) |
70,998 | * | 70,998 | — | — | — | — | ||||||||
| Richard H. Byrne |
8,280 | * | 4,000 | 4,280 | * | 4,280 | * | ||||||||
144
Table of Contents
Index to Financial Statements
| Original Common Stock beneficially owned before this offering(1) |
Common Stock and Original Common Stock, as a single class, beneficially owned after this offering(2) |
Common Stock and Original Common Stock, as a single class, beneficially owned after this offering assuming full exercise of the option to purchase additional shares(2) | |||||||||||||
| Name | Number | Percentage | Shares of Common Stock offered(3) |
Number | Percentage | Number | Percentage | ||||||||
| James Everard Byrne, Jr. |
8,280 | * | 7,900 | 380 | * | 380 | * | ||||||||
| Joseph H. Byrne III |
85,617 | * | 14,300 | 71,317 | * | 71,317 | * | ||||||||
| John N. Cardinal |
17,280 | * | 6,000 | 11,280 | * | 11,280 | * | ||||||||
| Emory L. Cassell |
71,778 | * | 10,300 | 61,478 | * | 61,478 | * | ||||||||
| CDS Stock Venture(32) |
107,031 | * | 107,031 | — | — | — | — | ||||||||
| Gary Cocanougher |
37,269 | * | 7,000 | 30,269 | * | 30,269 | * | ||||||||
| Sharon and Larry Combest(33) |
16,230 | * | 16,230 | (33) | — | — | — | — | |||||||
| Charles E. Cox(34) |
3,600 | * | 3,600 | — | — | — | — | ||||||||
| Giles Wilson Dalby(35) |
135,417 | * | 33,800 | 101,617 | * | 101,617 | * | ||||||||
| David Weaver Inc.(36) |
32,841 | * | 8,600 | 24,241 | * | 24,241 | * | ||||||||
| Mike A. Davis |
25,920 | * | 18,000 | 7,920 | * | 7,920 | * | ||||||||
| DCJ Partners Ltd.(37) |
69,918 | * | 7,500 | 62,418 | * | 62,418 | * | ||||||||
| Richard A. DeLong(38) |
73,473 | * | 5,500 | 67,973 | * | 67,973 | * | ||||||||
| Robbie B. Durham, Revocable Trust(39) |
83,580 | * | 36,000 | 47,580 | * | 47,580 | * | ||||||||
| Cynthia F. Easley(40) |
36,901 | * | 7,300 | (41) | 29,601 | * | 29,601 | * | |||||||
| Theresa Byrne Edwards |
61,944 | * | 61,944 | — | — | — | — | ||||||||
| David Ellis(42) |
6,219 | * | 6,219 | — | — | — | — | ||||||||
| Encore Bank, N.A. as trustee of the Peter B. Durham Marital Trust(43) |
82,110 | * | 40,000 | 42,110 | * | 42,110 | * | ||||||||
| F & J Sitton Investments(44) |
253,140 | * | 25,000 | 228,140 | * | 228,140 | * | ||||||||
| F4 Portfolio, Ltd.(45) |
37,002 | * | 37,002 | — | — | — | — | ||||||||
| Glenda Sue Wages Faulkner(46) |
9,705 | * | 9,705 | (46) | — | — | — | — | |||||||
| Pat Fletcher(47) |
10,443 | * | 3,000 | 7,443 | * | 7,443 | * | ||||||||
| Stacy Lin Foster(48) |
21,822 | * | 3,300 | 18,522 | * | 18,522 | * | ||||||||
| Richard A. Fox(49) |
166,053 | * | 10,000 | 156,053 | * | 156,053 | * | ||||||||
| Sham S. Gandhi M.D. |
41,472 | * | 41,472 | — | — | — | — | ||||||||
| Lloyd Marshall Garland, M.D. |
82,110 | * | 82,110 | — | — | — | — | ||||||||
| James R. Garrison(50) |
16,419 | * | 16,419 | — | — | — | — | ||||||||
| Georgia Whittenburg Hawks Trust #2(51) |
18,660 | * | 18,660 | — | — | — | — | ||||||||
| Ghan-Fam, Ltd.(52) |
41,052 | * | 30,000 | 11,052 | * | 11,052 | * | ||||||||
| Jame O. Gilbreath, Jr.(53) |
22,923 | * | 11,500 | 11,423 | * | 11,423 | * | ||||||||
| Barry Anne Byrne Goswick |
61,944 | * | 30,000 | 31,944 | * | 31,944 | * | ||||||||
| Gerald J. Gray, II(54) |
2,700 | * | 2,700 | — | — | — | — | ||||||||
| Linda Kaye Grimes(55) |
9,384 | * | 9,384 | (55) | — | — | — | — | |||||||
| William E. Haley |
15,552 | * | 5,184 | 10,368 | * | 10,368 | * | ||||||||
| Owen Hamilton(56) |
10,467 | * | 5,200 | (57) | 5,267 | * | 5,267 | * | |||||||
| Joseph Carl Harriger |
3,600 | * | 1,400 | 2,200 | * | 2,200 | * | ||||||||
145
Table of Contents
Index to Financial Statements
| Original Common Stock beneficially owned before this offering(1) |
Common Stock and Original Common Stock, as a single class, beneficially owned after this offering(2) |
Common Stock and Original Common Stock, as a single class, beneficially owned after this offering assuming full exercise of the option to purchase additional shares(2) | |||||||||||||
| Name | Number | Percentage | Shares of Common Stock offered(3) |
Number | Percentage | Number | Percentage | ||||||||
| Rebecca A. Harriger Family Trust(58) |
963 | * | 963 | — | — | — | — | ||||||||
| Jami Wright Hatfield |
1,095 | * | 1,095 | — | — | — | — | ||||||||
| Arden and Joyce Hawkins |
41,490 | * | 15,500 | 25,990 | * | 25,990 | * | ||||||||
| Brian Heflin(59) |
86,990 | * | 1,400 | 85,590 | * | 85,590 | * | ||||||||
| D.C. and Margie Herring Revocable Trust(60) |
330,285 | * | 30,000 | 300,285 | * | 300,285 | * | ||||||||
| Ronda Hill |
14,259 | * | 7,100 | 7,159 | * | 7,159 | * | ||||||||
| Lucy Beth Hinkle |
31,500 | * | 17,300 | 14,200 | * | 14,200 | * | ||||||||
| Barbara B. Holladay |
8,280 | * | 5,000 | 3,280 | * | 3,280 | * | ||||||||
| Rip Horkey or Nancy C. Horkey |
12,441 | * | 12,441 | — | — | — | — | ||||||||
| Ann Horkey |
12,171 | * | 12,171 | — | — | — | — | ||||||||
| Kathryn Horkey(61) |
7,437 | * | 7,437 | — | — | — | — | ||||||||
| Joe. R. Horkey, Jr.(62) |
6,162 | * | 6,162 | — | — | — | — | ||||||||
| Joe R. Horkey |
78,183 | * | 78,183 | — | — | — | — | ||||||||
| Greg Houlette(63) |
13,683 | * | 13,683 | — | — | — | — | ||||||||
| The Odie Wylene Howard Estate Trust(64) |
61,800 | * | 61,800 | — | — | — | — | ||||||||
| Robert Burl Huffman |
4,974 | * | 1,500 | 3,474 | * | 3,474 | * | ||||||||
| Linda Kay Hurd(65) |
109,203 | * | 6,200 | 103,003 | * | 103,003 | * | ||||||||
| Deborah L. Hurt(66) |
11,601 | * | 11,601 | — | — | — | — | ||||||||
| Janes Family, Ltd.(67) |
32,841 | * | 32,841 | — | — | — | — | ||||||||
| Wildon Robert Johnson III(68) |
62,169 | * | 11,500 | 50,666 | * | 50,666 | * | ||||||||
| The Paul & Marcia Johnson Trust For Andrew Kincaid Johnson(69) |
84,390 | * | 21,000 | 63,390 | * | 63,390 | * | ||||||||
| The Paul & Marcia Johnson Trust For Mary Francis Johnson Leonard(70) |
84,387 | * | 30,000 | 54,387 | * | 54,387 | * | ||||||||
| Donald Richard Jones |
20,412 | * | 20,412 | — | — | — | — | ||||||||
| Paul C. Keplinger |
2,700 | * | 1,400 | 1,300 | * | 1,300 | * | ||||||||
| Robert Randolph King M.D.(71) |
698,247 | 2.1% | 174,500 | 523,747 | 1.2% | 523,747 | 1.2% | ||||||||
| Robert William Lawless |
60,000 | * | 18,000 | 42,000 | * | 42,000 | * | ||||||||
| Sandra Lehman(72) |
21,345 | * | 4,500 | 16,845 | * | 16,845 | * | ||||||||
| J. Robert and Shelah G. Lile |
13,683 | * | 7,200 | 6,483 | * | 6,483 | * | ||||||||
| Patsy R. Lokey(73) |
26,256 | * | 2,000 | 24,256 | * | 24,256 | * | ||||||||
| William Boyd London Jr.(74) |
282,588 | * | 15,000 | 231,375 | * | 231,375 | * | ||||||||
| Carlos Lopez(75) |
8,532 | * | 800 | (76) | 7,732 | * | 7,732 | * | |||||||
| Lubbock Commercial Buildings, Inc.(77) |
671,118 | 2.0% | 167,779 | 503,339 | 1.1% | 503,339 | 1.1% | ||||||||
| Mia Diekemper Maddoux |
8,208 | * | 8,208 | — | — | — | — | ||||||||
146
Table of Contents
Index to Financial Statements
| Original Common Stock beneficially owned before this offering(1) |
Common Stock and Original Common Stock, as a single class, beneficially owned after this offering(2) |
Common Stock and Original Common Stock, as a single class, beneficially owned after this offering assuming full exercise of the option to purchase additional shares(2) | |||||||||||||
| Name | Number | Percentage | Shares of Common Stock offered(3) |
Number | Percentage | Number | Percentage | ||||||||
| Robert Malina(78) |
82,725 | * | 82,725 | — | — | — | — | ||||||||
| Michael J. Marz(79) |
469,689 | 1.4% | 17,000 | (80) | 452,689 | 1.0% | 452,689 | 1.0% | |||||||
| James T. Mathis(81) |
16,953 | * | 16,953 | — | — | — | — | ||||||||
| Claire B. Mattox(82) |
8,691 | * | 8,691 | — | — | — | — | ||||||||
| Joe D. and Debby May(83) |
60,723 | * | 6,000 | 54,723 | * | 54,723 | * | ||||||||
| George H. McCleskey(84) |
61,685 | * | 5,000 | (85) | 56,685 | * | 56,685 | * | |||||||
| Gary Newton McCoy(86) |
31,248 | * | 7,500 | 23,748 | * | 23,748 | * | ||||||||
| Lucas Dale McLaughlin |
45,654 | * | 35,000 | 10,654 | * | 10,654 | * | ||||||||
| Kevin G. McMahon |
6,000 | * | 3,000 | 3,000 | * | 3,000 | * | ||||||||
| Farahnaz J. Mehdiabadi |
1,305 | * | 500 | 805 | * | 805 | * | ||||||||
| Natasha Mehdiabadi |
2,343 | * | 1,000 | 1,343 | * | 1,343 | * | ||||||||
| Shahnaz Mehdiabadi |
786 | * | 400 | 386 | * | 386 | * | ||||||||
| Kimberly Dawn Miller(87) |
5,969 | * | 2,500 | 3,469 | * | 3,469 | * | ||||||||
| John S. Miller |
13,908 | * | 13,908 | — | — | — | — | ||||||||
| MPD II Development, LP(88) |
50,439 | * | 7,600 | 42,839 | * | 42,839 | * | ||||||||
| Nancy R. Neal |
135,324 | * | 65,000 | 70,324 | * | 70,324 | * | ||||||||
| Nevill Manning Partnership(89) |
149,547 | * | 24,500 | 125,047 | * | 125,047 | * | ||||||||
| Carl Odom(90) |
12,432 | * | 12,432 | — | — | — | — | ||||||||
| Sheila Sue O’Hair |
11,793 | * | 11,793 | — | — | — | — | ||||||||
| John C. and Cynthia M. Owens(91) |
359,715 | 1.1% | 35,900 | (92) | 323,815 | * | 323,815 | * | |||||||
| Susan Ferreira |
3,882 | * | 3,801 | 81 | * | 81 | * | ||||||||
| Charles Terrell Palmer(94) |
35,320 | * | 5,000 | 16,192 | * | 16,192 | * | ||||||||
| James Ray Partin(95) |
68,472 | * | 34,200 | 34,272 | * | 34,272 | * | ||||||||
| Linda C. Paxton |
5,703 | * | 5,703 | — | — | — | — | ||||||||
| DeWayne V. Pierce(96) |
212,034 | * | 10,100 | (97) | 201,934 | * | 201,934 | * | |||||||
| Dick Pollard |
91,443 | * | 91,443 | — | — | — | — | ||||||||
| Joe E. Price(98) |
9,780 | * | 9,780 | — | — | — | — | ||||||||
| Kathie S. Ralston |
11,577 | * | 11,577 | — | — | — | — | ||||||||
| Rachel Elizabeth Ratliff |
28,755 | * | 14,300 | 14,455 | * | 14,455 | * | ||||||||
| Eric Ratliff(99) |
28,755 | * | 10,000 | 18,755 | * | 18,755 | * | ||||||||
| Ratliff Family No 3 Limited Partnership(100) |
421,836 | 1.2% | 42,000 | 379,836 | * | 379,836 | * | ||||||||
| Annette Rosen(101) |
12,126 | * | 6,000 | 6,126 | * | 6,126 | * | ||||||||
| Arthur W. Rousseau |
8,091 | * | 8,091 | — | — | — | — | ||||||||
| Robert J. Salem |
73,317 | * | 23,000 | 50,317 | * | 50,317 | * | ||||||||
| Sandra F. Sitton Enterprises, Ltd(102) |
21,114 | * | 10,000 | 11,114 | * | 11,114 | * | ||||||||
| Larry Lynn Schoenboun |
100,464 | * | 30,000 | 70,464 | * | 70,464 | * | ||||||||
| Jay Schuminsky |
662,010 | 2.0% | 662,010 | — | — | — | — | ||||||||
147
Table of Contents
Index to Financial Statements
| Original Common Stock beneficially owned before this offering(1) |
Common Stock and Original Common Stock, as a single class, beneficially owned after this offering(2) |
Common Stock and Original Common Stock, as a single class, beneficially owned after this offering assuming full exercise of the option to purchase additional shares(2) | |||||||||||||
| Name | Number | Percentage | Shares of Common Stock offered(3) |
Number | Percentage | Number | Percentage | ||||||||
| Michael A. and Christine G. Seger(103) |
325,038 | * | 66,419 | (104) | 258,619 | * | 258,619 | * | |||||||
| Andrew R. Seger 1990 Trust(105) |
6,480 | * | 6,480 | — | — | — | — | ||||||||
| Michael V. Seger 1990 Trust(106) |
6,480 | * | 6,480 | — | — | — | — | ||||||||
| Michael Seger Childrens Trust(107) |
55,728 | * | 7,500 | 48,228 | * | 48,228 | * | ||||||||
| Hilary C. Seger 1990 Trust(108) |
6,480 | * | 6,480 | — | — | — | — | ||||||||
| Sharon Shavor |
15,696 | * | 10,000 | 5,696 | * | 5,696 | * | ||||||||
| Harve B. Shavor |
31,620 | * | 15,000 | 16,620 | * | 16,620 | * | ||||||||
| Richard Cox Sitton |
10,287 | * | 5,000 | 5,287 | * | 5,287 | * | ||||||||
| Michael P. Sitton |
10,287 | * | 5,000 | 5,287 | * | 5,287 | * | ||||||||
| Kenneth Steinhart(109) |
6,330 | * | 6,330 | — | — | — | — | ||||||||
| Jack F. Strong Jr.(110) |
14,319 | * | 3,500 | 10,819 | * | 10,819 | * | ||||||||
| Zelda Strong(111) |
2,184 | * | 600 | 1,584 | * | 1,584 | * | ||||||||
| George Tate, Jr. IRA(112) |
21,603 | * | 5,400 | 16,203 | * | 16,203 | * | ||||||||
| Harvey Grant Taylor Jr. |
10,056 | * | 4,500 | 5,556 | * | 5,556 | * | ||||||||
| Thomas W. and Wanda L. Taylor |
45,498 | * | 8,300 | 37,198 | * | 37,198 | * | ||||||||
| Nicholas Scott Taylor |
7,542 | * | 700 | 6,842 | * | 6,842 | * | ||||||||
| Michael W. Taylor |
4,095 | * | 800 | 3,295 | * | 3,295 | * | ||||||||
| Kathy Byrne Terrill(113) |
59,055 | * | 59,055 | — | — | — | — | ||||||||
| Bernie J. Thiel, Jr. |
20,736 | * | 10,000 | 10,736 | * | 10,736 | * | ||||||||
| Thomas F. Neal, M.D., PA Profit Sharing Plan(114) |
66,060 | * | 33,000 | 33,060 | * | 33,060 | * | ||||||||
| Perry M. Tipton(115) |
27,739 | * | 3,200 | (116) | 24,539 | * | 24,539 | * | |||||||
| The Trinity Company(117) |
1,047,168 | 3.1% | 100,000 | 947,168 | 2.1% | 947,168 | 2.0% | ||||||||
| Ronald Lee Tullis |
68,916 | * | 10,000 | 58,916 | * | 58,916 | * | ||||||||
| Fred Arch Underwood(118) |
34,590 | * | 3,000 | 31,590 | * | 31,590 | * | ||||||||
| Pedro Villarreal(119) |
28,809 | * | 1,000 | 27,809 | * | 27,809 | * | ||||||||
| William J. McGinty Trust For Mary Jordanne McGinty(120) |
26,199 | * | 5,000 | 21,199 | * | 21,199 | * | ||||||||
| Tracy Wallace(121) |
13,218 | * | 13,218 | — | — | — | — | ||||||||
| Tim L. West(122) |
13,953 | * | 10,000 | 3,953 | * | 3,953 | * | ||||||||
| Dusti Ann White |
10,287 | * | 5,200 | 5,087 | * | 5,087 | * | ||||||||
| J. Mack White |
6,219 | * | 3,000 | 3,219 | * | 3,219 | * | ||||||||
| Elizabeth White(123) |
119,955 | * | 11,995 | 107,960 | * | 107,960 | * | ||||||||
| Karen Wilson(124) |
7,305 | * | 700 | 6,605 | * | 6,605 | * | ||||||||
| Christopher Robert Wolfe |
9,315 | * | 4,000 | 5,315 | * | 5,315 | * | ||||||||
| IM Janet Woolwine Trust(125) |
209,280 | * | 209,280 | — | — | — | — | ||||||||
148
Table of Contents
Index to Financial Statements
| Original Common Stock beneficially owned before this offering(1) |
Common Stock and Original Common Stock, as a single class, beneficially owned after this offering(2) |
Common Stock and Original Common Stock, as a single class, beneficially owned after this offering assuming full exercise of the option to purchase additional shares(2) | ||||||||||||
| Name | Number | Percentage | Shares of Common Stock offered(3) |
Number | Percentage | Number | Percentage | |||||||
| Janet Igo Woolwine 1995 GS Trust(126) |
28,539 | * | 28,539 | — | — | — | — | |||||||
| Robert H. Wright(127) |
11,016 | * | 2,700 | 8,316 | * | 8,316 | * | |||||||
| * | Less than 1%. |
| (1) | No shares of our Common Stock were issued or outstanding as of September 30, 2009. |
| (2) | Beneficial ownership does not include any shares of Common Stock that may be purchased in this offering, including in the directed share program. See “Underwriting.” Represents beneficial ownership of our Common Stock and Original Common Stock as a single class. See the section entitled “Description of capital stock—Common Stock—Conversion for a description of the convertibility of our Original Common Stock into shares of our Common Stock. |
| (3) | If the underwriters exercise their option to purchase additional shares of our Common Stock, all of the additional shares will be sold by PlainsCapital. Immediately prior to this offering, each share of Original Common Stock to be sold in this offering will be converted into a share of Common Stock. |
| (4) | Includes 28,965 shares of common stock (the “Custard Earnout Shares”) currently held in escrow for the benefit of Mr. Custard. The Custard Earnout Shares are subject to the earnout provisions of the Merger Agreement. Mr. Custard may not receive the Custard Earnout Shares until January 31, 2013, and the number of shares that he will receive, if any, is subject to reduction in accordance with the terms of the Merger Agreement. Mr. Custard has the right to vote the Custard Earnout Shares prior to their cancellation or release from escrow and may be deemed the beneficial owner thereof. Also includes 15,000 shares of restricted stock granted to Mr. Custard. Pursuant to the terms of Mr. Custard’s restricted stock grant, he has the right to vote such shares and may be deemed the beneficial owner thereof. |
| (5) | Includes 500,496 shares of common stock (the “Feinberg Earnout Shares”) currently held in escrow for the benefit of Mr. Feinberg. The Feinberg Earnout Shares are subject to the earnout provisions of the Merger Agreement. Mr. Feinberg may not receive the Feinberg Earnout Shares until January 31, 2013, and the number of shares that he will receive, if any, is subject to reduction in accordance with the terms of the Merger Agreement. Mr. Feinberg has the right to vote the Feinberg Earnout Shares prior to their cancellation or release from escrow and may be deemed the beneficial owner thereof. Also includes 127,158 shares of common stock issuable to Mr. Feinberg upon exercise of stock options. 31,788 shares of common stock underlying certain of these options (the “Feinberg Earnout Option Shares”) remain subject to the earnout provisions of the Merger Agreement. The Feinberg Earnout Option Shares are currently exercisable, but Mr. Feinberg may not receive the Feinberg Earnout Option Shares until January 31, 2013, and the number of shares that he will receive upon exercise of the related stock options, if any, is subject to reduction in accordance with the terms of the Merger Agreement. Mr. Feinberg would have the right to vote any Feinberg Earnout Option Shares prior to their cancellation or release from escrow and may be deemed the beneficial owner thereof. Also includes 36,000 shares of restricted stock granted to Mr. Feinberg. Pursuant to the terms of Mr. Feinberg’s restricted stock grant, he has the right to vote such shares and may be deemed the beneficial owner thereof. 435,000 of the shares held by Mr. Feinberg are pledged as security on a loan from an unaffiliated party. |
| (6) | Includes 11,376 shares of common stock issuable to Mr. Isom upon exercise of stock options issued under the Stock Option Plans. Also includes 30,000 shares of restricted stock granted to Mr. Isom. Pursuant to the terms of Mr. Isom’s restricted stock grant, he has the right to vote such shares and may be deemed the beneficial owner thereof. Also includes 31,515 shares of common stock allocated to the account of Mr. Isom pursuant to the PlainsCapital Corporation Employees’ Stock Ownership Plan (the “ESOP”). Each ESOP participant has the right to direct the ESOP Trustee to vote the shares allocated to his or her account on all matters requiring the vote of our shareholders and as such, Mr. Isom may be deemed the beneficial owner of such shares. |
| (7) | Comprised of shares of common stock held by Lee Lewis Construction. Mr. Lewis is the sole owner of Lee Lewis Construction and may be deemed to have voting and/or investment power with respect to the shares owned by Lee Lewis Construction. Mr. Lewis has a revolving line of credit with the Bank. |
| (8) | Comprised of shares held by Lee Lewis Construction. |
| (9) | Includes 105 shares of common stock allocated to the account of Ms. McGill pursuant to the ESOP. Each ESOP participant has the right to direct the ESOP Trustee to vote the shares allocated to his or her account on all matters requiring the vote of our shareholders and as such, Ms. McGill may be deemed the beneficial owner of such shares. |
| (10) | Includes 13,032 shares of common stock issuable to Mr. Schaffner upon the exercise of stock options issued under the Stock Option Plans. Also includes 15,426 shares of common stock held by Mr. Schaffner in an individual retirement account and |
149
Table of Contents
Index to Financial Statements
| 1,881 shares held by Susan Schaffner, the spouse of Mr. Schaffner, in an individual retirement account. Also includes 45,000 shares of restricted stock granted to Mr. Schaffner. Pursuant to the terms of Mr. Schaffner’s restricted stock grant, he has the right to vote such shares and may be deemed the beneficial owner thereof. Also includes 39,492 shares of common stock allocated to the account of Mr. Schaffner pursuant to the ESOP. Each ESOP participant has the right to direct the ESOP Trustee to vote the shares allocated to his or her account on all matters requiring the vote of our shareholders and as such, Mr. Schaffner may be deemed the beneficial owner of such shares. |
| (11) | Includes 20,160 shares of common stock issuable to Mr. White upon exercise of stock options issued under the Stock Option Plans; 122,286 shares held by Mr. White in an individual retirement account; 83,148 shares held by Alan White 801 Investments; and 2,389,122 shares held by Maedgen & White, Ltd. 442,977 of the shares held by Maedgen & White, Ltd. are pledged as security on loans from an unaffiliated party. Mr. White is the sole general partner of Alan White 801 Investments and the sole general partner of Maedgen & White, Ltd. and may be deemed to have voting and/or investment power with respect to the shares owned by Alan White 801 Investments and Maedgen & White, Ltd. Also includes 150,000 shares of restricted stock granted to Mr. White. Pursuant to the terms of Mr. White’s restricted stock grant, he has the right to vote such shares and may be deemed the beneficial owner thereof. Also includes 40,473 shares of common stock allocated to the account of Mr. White pursuant to the ESOP. Each ESOP participant has the right to direct the ESOP Trustee to vote the shares allocated to his or her account on all matters requiring the vote of our shareholders and as such, Mr. White may be deemed the beneficial owner of such shares. |
| (12) | Comprised of 230,000 shares held by Maedgen & White, Ltd., 12,000 shares held in an individual retirement account and 8,000 shares held by Alan White 801 Investments. |
| (13) | Pursuant to the ESOP, each ESOP participant has the right to direct the ESOP Trustee to vote the shares allocated to his or her account on all matters requiring the vote of our shareholders. In the event that a participant does not direct the ESOP Trustees on how to vote his or her allocated shares, the ESOP Committee will determine how such shares are voted and may be deemed the beneficial holder thereof. The ESOP Committee has the right to vote all unallocated shares held by the ESOP and may be deemed the beneficial owner thereof. In the event that the ESOP Committee does vote the unallocated shares held by the ESOP or the allocated shares for which ESOP participants have not directed them to vote, then the ESOP Trustees will determine how such shares are voted and may be deemed the beneficial holder thereof. |
| (14) | Includes 9,762 shares held by Mr. Adair in an individual retirement account. |
| (15) | Includes 19,074 shares of common stock (the “Addams Earnout Shares”) currently held in escrow for the benefit of Mr. Addams. The Addams Earnout Shares are subject to the earnout provisions of the Merger Agreement. Mr. Addams may not receive the Addams Earnout Shares until January 31, 2013, and the number of shares that he will receive, if any, is subject to reduction in accordance with the terms of the Merger Agreement. Mr. Addams has the right to vote the Addams Earnout Shares prior to their cancellation or release from escrow and may be deemed the beneficial owner thereof. Mr. Addams is a current employee of First Southwest. |
| (16) | Bank of America serves as trustee for this trust. Bank of America may be deemed to have voting and/or investment power with respect to the shares owned by the IM Alison I Ash Trust. |
| (17) | The Bank serves as trustee for this trust. The Wealth Management and Trust department of the Bank may be deemed to have voting and/or investment power with respect to the shares owned by the Alison Igo Ash 1995 GS Trust. |
| (18) | Keith Bjork is the President of Simple Solutions, the managing General Partner of Bar None, Ltd. As such, Mr. Bjork and Simple Solutions may be deemed to have voting and/or investment power with respect to the shares owned by Bar None, Ltd. |
| (19) | Includes 31,086 shares of common stock (the “Bass Earnout Shares”) currently held in escrow for the benefit of Mr. Bass. The Bass Earnout Shares are subject to the earnout provisions of the Merger Agreement. Mr. Bass may not receive the Bass Earnout Shares until January 31, 2013, and the number of shares that he will receive, if any, is subject to reduction in accordance with the terms of the Merger Agreement. Mr. Bass has the right to vote the Bass Earnout Shares prior to their cancellation or release from escrow and may be deemed the beneficial owner thereof. Also includes 14,800 shares held in an individual retirement account. Mr. Bass currently serves as Vice Chairman of First Southwest. |
| (20) | Includes 14,800 shares held in an individual retirement account. |
| (21) | Mr. Berg is President of the Turtle Creek office of the Bank and an advisory member of the Director’s Trust Committee of the Bank. Includes 15,822 shares issuable to Mr. Berg upon exercise of stock options issued under the Stock Option Plans. Also includes 5,304 shares allocated to the account of Mr. Berg pursuant to the ESOP. Each ESOP participant has the right to direct the ESOP Trustee to vote the shares allocated to his or her account on all matters requiring the vote of our shareholders and as such, Mr. Berg may be deemed the beneficial owner of such shares. |
| (22) | Mr. Bergman is a Senior Vice President of the Bank. Includes 14,413 shares allocated to the account of Mr. Bergman pursuant to the ESOP. Each ESOP participant has the right to direct the ESOP Trustee to vote the shares allocated to his or her account on all matters requiring the vote of our shareholders and as such, Mr. Bergman may be deemed the beneficial owner of such shares. Also includes 3,111 shares issuable to Mr. Bergman upon exercise of stock options issued under the Stock Option Plans. |
| (23) | The Bank serves as trustee for this trust. The Bank may be deemed to have voting and/or investment power with respect to the shares owned by the Kara Lieske Bergstein Irrevocable Trust #1, PlainsCapital Bank Trustee. |
| (24) | The Bank serves as trustee for this trust. The Bank may be deemed to have voting and/or investment power with respect to the shares owned by the Saskia Katrin Bergstein Irrevocable Trust #1, PlainsCapital Bank Trustee. |
| (25) | The Bank serves as trustee for this trust. The Bank may be deemed to have voting and/or investment power with respect to the shares owned by the Petra Adriana Bergstein Irrevocable Trust #1, PlainsCapital Bank Trustee. |
150
Table of Contents
Index to Financial Statements
| (26) | Curtis Jordan is the President of Bob Jordan Amusement Co., Inc. and may be deemed to have voting and/or investment power with respect to the shares owned by Bob Jordan Amusement Co., Inc. |
| (27) | Ms. Bryant is a director and the President of JRR Corporation, the general partner of the Ratliff Family No 3 Limited Partnership, and may be deemed to have voting and/or investment power with respect to 421,836 shares owned by the Ratliff Family No 3 Limited Partnership, of which 42,000 shares will be sold pursuant to this offering. Ms. Bryant has disclaimed beneficial ownership with respect to all but 12,000 of the shares held by the Ratliff Family No 3 Limited Partnership, 4,200 of which will be sold in this offering. |
| (28) | The Bank serves as trustee for this trust. The Bank may be deemed to have voting and/or investment power with respect to the shares owned by the Jason Paladin Burchard Irrevocable Trust #1 PlainsCapital Bank Trustee. |
| (29) | The Bank serves as trustee for this trust. The Bank may be deemed to have voting and/or investment power with respect to the shares owned by the Jeremy Ray Burchard Irrevocable Trust #1 PlainsCapital Bank Trustee. |
| (30) | Includes 124,452 shares beneficially owned by Benny L. Judah and 13,320 shares beneficially owned by Excel Lease Fund. |
| (31) | Charles A. Anderson is the authorized agent of BV Investments GP, LLC, the general partner of BV Investments, LP, and may be deemed to have voting and/or investment power with respect to the shares owned by BV Investments, LP. |
| (32) | Douglas M. Hickok, Cary Platt and Stuart Frye are each venturers of CDS Stock Venture and may be deemed to have voting and/or investment power with respect to the shares owned by CDS Stock Venture. |
| (33) | Includes 6,450 shares held by Ms. Combest in an individual retirement account. |
| (34) | Mr. Cox is a former officer of PlainsCapital Corporation. |
| (35) | Mr. Dalby is a director of the Bank and a former director of PlainsCapital Corporation. |
| (36) | Mark B. Weaver is president of David Weaver Inc. and may be deemed to have voting and/or investment power with respect to the shares owned by David Weaver Inc. |
| (37) | Walter Harrell Spears is the trustee of the Spears Family Trust, the general partner of DCJ Partners Ltd., and may be deemed to have voting and/or investment power with respect to the shares owned by DCJ Partners Ltd. |
| (38) | Includes 42,387 shares held by Mr. DeLong in an individual retirement account. Also Includes 18,369 shares of common stock (the “DeLong Earnout Shares”) currently held in escrow for the benefit of Mr. DeLong. The DeLong Earnout Shares are subject to the earnout provisions of the Merger Agreement. Mr. DeLong may not receive the DeLong Earnout Shares until January 31, 2013, and the number of shares that he will receive, if any, is subject to reduction in accordance with the terms of the Merger Agreement. Mr. DeLong has the right to vote the DeLong Earnout Shares prior to their cancellation or release from escrow and may be deemed the beneficial owner thereof. Mr. DeLong is currently employed by First Southwest. |
| (39) | Robbie B. Durham is Trustee of the Robbie B. Durham, Revocable Trust, and may be deemed to have voting and/or investment power with respect to the shares owned by the Robbie B. Durham, Revocable Trust. |
| (40) | Includes 14,385 shares held by Ms. Easley in an individual retirement account, 3,000 shares of common stock issuable to Ms. Easley upon the exercise of stock options issued under the Stock Option Plans, and 3,964 shares allocated to the account of Ms. Easley pursuant to the ESOP. Each ESOP participant has the right to direct the ESOP Trustee to vote the shares allocated to his or her account on all matters requiring the vote of our shareholders and as such, Ms. Easley may be deemed the beneficial owner of such shares. Ms. Easley is President of the Wealth Management and Trust department of the Bank and an Advisory Director of the Bank. |
| (41) | Includes 14,385 shares held by Ms. Easley in an individual retirement account. |
| (42) | Comprised of shares held by Mr. Ellis in an individual retirement account. Mr. Ellis is a former employee of the Bank. |
| (43) | Encore Bank, N.A., trustee of the Peter B. Durham Marital Trust, may be deemed to have voting and/or investment power with respect to the shares owned by the Peter B. Durham Marital Trust. |
| (44) | Frank Sitton is the managing general partner of F & J Sitton Investments and may be deemed to have voting and/or investment power with respect to the shares owned by F & J Sitton Investments. |
| (45) | Mike Field is the general partner of F4 Portfolio, Ltd. and may be deemed to have voting and/or investment power with respect to the shares owned by F4 Portfolio, Ltd. Mr. Field is an advisory director of the Bank. |
| (46) | Includes 6,537 shares held by Ms. Faulkner in an individual retirement account. Ms. Faulkner is a former employee of the Bank. |
| (47) | Comprised of 10,443 shares held by Pat Fletcher in an individual retirement account. Ms. Fletcher is a former employee of the Bank. |
| (48) | Includes 8,361 shares allocated to the account of Ms. Foster pursuant to the ESOP. Each ESOP participant has the right to direct the ESOP Trustee to vote the shares allocated to his or her account on all matters requiring the vote of our shareholders and as such, Ms. Foster may be deemed the beneficial owner of such shares. Ms. Foster is an employee of the Bank. |
| (49) | Includes 41,514 shares of common stock (the “Fox Earnout Shares”) currently held in escrow for the benefit of Mr. Fox. The Fox Earnout Shares are subject to the earnout provisions of the Merger Agreement. Mr. Fox may not receive the Fox Earnout Shares until January 31, 2013, and the number of shares that he will receive, if any, is subject to reduction in accordance with the terms of the Merger Agreement. Mr. Fox has the right to vote the Fox Earnout Shares prior to their cancellation or release from escrow and may be deemed the beneficial owner thereof. |
151
Table of Contents
Index to Financial Statements
| (50) | Comprised of shares held by Mr. Garrison in an individual retirement account. |
| (51) | Arthur Leon Swift, Wayne L. Holder and Georgia Elizabeth Benton are Trustees of the Georgia Whittenburg Hawks Trust #2 and may be deemed to have voting and/or investment power with respect to the shares owned by the Georgia Whittenburg Hawks Trust #2. |
| (52) | Elias Ghandour is the president of Elias, Inc., the general partner of Ghan-Fam Ltd., and may be deemed to have voting and/or investment power with respect to the shares owned by Ghan-Fam Ltd. |
| (53) | Consists of shares held by Mr. Gilbreath in an individual retirement account. |
| (54) | Mr. Gray is a former employee of the Bank. |
| (55) | Includes 3,108 shares held by Ms. Grimes in an individual retirement account. |
| (56) | Includes 9,078 shares held by Mr. Hamilton in an individual retirement account. |
| (57) | Includes 4,000 shares held by Mr. Hamilton in an individual retirement account. |
| (58) | Harold O. Harriger and Don Graf serve as Co-Trustees of the Rebecca A. Harriger Family Trust and may be deemed to have voting and/or investment power with respect to the shares owned by the Rebecca A. Harringer Family Trust. |
| (59) | Includes 23,025 shares issuable to Mr. Heflin upon the exercise of stock options issued under the Stock Option Plans and 30,000 shares of restricted stock granted to Mr. Heflin. Also includes 19,601 shares allocated to the account of Mr. Heflin pursuant to the ESOP. Each ESOP participant has the right to direct the ESOP Trustee to vote the shares allocated to his or her account on all matters requiring the vote of our shareholders and as such, Mr. Heflin may be deemed the beneficial owner of such shares. Mr. Heflin currently serves as an Advisory Director and Chairman, North Texas Region, of the Bank and is a former Advisory Director of PlainsCapital Corporation. |
| (60) | Mr. and Mrs. Herring serve as co-trustees of the D.C. and Margie Herring Revocable Trust and may be deemed to have voting and/or investment power with respect to the shares owned by the D.C. and Margie Herring Revocable Trust. |
| (61) | Comprised of 7,437 shares held by Ms. Horkey in an individual retirement account. |
| (62) | Includes 3,432 shares held by Mr. Horkey in an individual retirement account. |
| (63) | Comprised of shares held by Mr. Houlette in an individual retirement account. |
| (64) | Modrell Beaty Howard is the trustee of The Odie Wylene Howard Estate Trust and may be deemed to have voting and/or investment power with respect to the shares owned by The Odie Wylene Howard Estate Trust. |
| (65) | Includes 47,289 shares held by Ms. Hurd in an individual retirement account. |
| (66) | Comprised of 11,601 shares held by Ms. Hurt in an individual retirement account. |
| (67) | Ralph E. Janes III is the Trustee of Janes Management Trust, the managing general partner of Janes Family, Ltd., and may be deemed to have voting and/or investment power with respect to the shares owned by Janes Family, Ltd. |
| (68) | Includes 15,543 shares (the “Johnson Earnout Shares”) currently held in escrow for the benefit of Mr. Johnson. The Johnson Earnout Shares are subject to the earnout provisions of the Merger Agreement. Mr. Johnson may not receive the Johnson Earnout Shares until January 31, 2013, and the number of shares that he will receive, if any, is subject to reduction in accordance with the terms of the Merger Agreement. Mr. Johnson has the right to vote the Johnson Earnout Shares prior to their cancellation or release from escrow and may be deemed the beneficial owner thereof. Mr. Johnson is an employee of First Southwest. |
| (69) | Jack Young is a trustee of The Paul & Marcia Johnson Trust For Andrew Kincaid Johnson and may be deemed to have voting and/or investment power with respect to the shares owned by The Paul & Marcia Johnson Trust For Andrew Kincaid Johnson. |
| (70) | Jack Young is a trustee of The Paul & Marcia Johnson Trust For Mary Francis Johnson Leonard and may be deemed to have voting and/or investment power with respect to the shares owned by The Paul & Marcia Johnson Trust For Mary Francis Johnson Leonard. |
| (71) | Dr. King is a former director of PlainsCapital Corporation and is currently a director of the Bank. |
| (72) | Comprised of 21,345 shares held by Ms. Lehman in an individual retirement account. |
| (73) | Comprised of 26,256 shares held by Ms. Lokey in an individual retirement account. |
| (74) | Includes 41,164 shares held by, or for the benefit of, Mr. London in individual retirement accounts. 10,291 of these shares and 60,356 shares held for the benefit of Mr. London (the “London Earnout Shares”) are currently held in escrow for the benefit of Mr. London. The London Earnout Shares are subject to the earnout provisions of the Merger Agreement. Mr. London may not receive the London Earnout Shares until January 31, 2013, and the number of shares that he will receive, if any, is subject to reduction in accordance with the terms of the Merger Agreement. Mr. London has the right to vote the London Earnout Shares prior to their cancellation or release from escrow and may be deemed the beneficial owner thereof. Mr. London is currently employed by First Southwest. |
| (75) | Includes 5,364 shares held by Mr. Lopez in an individual retirement account. Mr. Lopez is an employee of the Bank. |
| (76) | Includes 500 shares held by Mr. Lopez in an individual retirement account. |
| (77) | Ted Allen Rushing owns 50% of the stock of Lubbock Commercial Buildings, Inc. and is an officer of Lubbock Commercial Buildings, Inc. and may be deemed to have voting and/or investment power with respect to the shares owned by Lubbock |
152
Table of Contents
Index to Financial Statements
| Commercial Buildings, Inc. Mr. Rushing is a former director of PlainsCapital Corporation and is a director of the Bank. Mr. Rushing separately may be deemed to have voting and/or investment power with respect to 170,982 shares held by other entities. |
| (78) | Mr. Malina has loans outstanding with the Bank of approximately $5.75 million. |
| (79) | Includes 109,479 shares held for the benefit of an individual retirement account. 27,369 of the shares held for the benefit of Mr. Marz’s individual retirement account and 81,426 shares held for the benefit of Mr. Marz (the “Marz Earnout Shares”) are currently held in escrow. The Marz Earnout Shares are subject to the earnout provisions of the Merger Agreement. Mr. Marz may not receive the Marz Earnout Shares until January 31, 2013, and the number of shares that he will receive, if any, is subject to reduction in accordance with the terms of the Merger Agreement. Mr. Marz has the right to vote the Marz Earnout Shares prior to their cancellation or release from escrow and may be deemed the beneficial owner thereof. Also includes 19,500 shares of restricted stock granted to Mr. Marz. Pursuant to the terms of Mr. Marz’s restricted stock grant, he has the right to vote such shares and may be deemed the beneficial owner thereof. Mr. Marz is an employee of First Southwest. |
| (80) | Includes 8,000 shares held by Mr. Marz in an individual retirement account and 9,000 shares held directly by Mr. Marz. |
| (81) | Mr. Mathis is a former employee of First Southwest. |
| (82) | Comprised of 8,691 shares held by Ms. Mattox in an individual retirement account. |
| (83) | Includes 3,267 shares held by Mr. May in an individual retirement account and 9,456 shares held by Ms. May, the spouse of Mr. May, in an individual retirement account. |
| (84) | Mr. McCleskey is a Senior Executive Vice President of PlainsCapital Corporation and a director of the Bank. Mr. McCleskey is a former director of PlainsCapital Corporation. Includes 3,600 shares issuable to Mr. McClesky upon exercise of stock options issued under the Stock Option Plans, 21,069 shares held by Mr. McCleskey in an individual retirement account and 6,713.1928 shares allocated to the account of Mr. McCleskey pursuant to the ESOP. Each ESOP participant has the right to direct the ESOP Trustee to vote the shares allocated to his or her account on all matters requiring the vote of our shareholders and as such, Mr. McCleskey may be deemed the beneficial owner of such shares. Mr. McCleskey is a member of the PlainsCapital Corporation ESOP Committee, which serves as the ESOP Trustee. The ESOP holds more than 5% of the Original Common Stock. |
| (85) | Includes 2,100 shares held by Mr. McCleskey in an individual retirement account. |
| (86) | Mr. McCoy is a former employee and officer of the Bank. |
| (87) | Includes 995 shares allocated to the account of Ms. Miller pursuant to the ESOP. Each ESOP participant has the right to direct the ESOP Trustee to vote the shares allocated to his or her account on all matters requiring the vote of our shareholders and as such, Ms. Miller may be deemed the beneficial owner of such shares. Ms. Miller is a former employee of the Bank. |
| (88) | Mark D. D’Alise is president of MPD II Management GP, LLC, the sole general partner of MPD II Development, LP. Mr. D’Alise and MPD II Management GP, LLC may therefore be deemed to have voting and/or investment power with respect to the shares owned by MPD II Development, LP. Mr. D’Alise is an Advisory Director of the Bank. |
| (89) | Nevill Manning is the managing partner of Nevill Manning Partnership and may be deemed to have voting and/or investment power with respect to the shares owned by Nevill Manning Partnership. Mr. Manning is an Advisory Director of the Bank. |
| (90) | Mr. Odom is a former employee of PrimeLending. |
| (91) | Includes 94,248 shares held by Mr. Owens in an individual retirement account and 15,141 shares held by Mrs. Owens in an individual retirement account. Mr. Owens is a member of the PlainsCapital Corporation ESOP Committee, which serves as the ESOP Trustee. The ESOP holds more than 5% of the Original Common Stock. |
| (92) | Comprised of 25,000 shares held by Mr. and Mrs. Owens, 9,400 shares held by Mr. Owens in an individual retirement account and 1,500 shares held by Mrs. Owens in an individual retirement account. |
| (93) | Includes 81 shares allocated to the account of Ms. Page pursuant to the ESOP. Each ESOP participant has the right to direct the ESOP Trustee to vote the shares allocated to his or her account on all matters requiring the vote of our shareholders and as such, Ms. Page may be deemed the beneficial owner of such shares. Ms. Page is a former employee of PlainsCapital Corporation. |
| (94) | Includes 7,064 shares held by, or for the benefit of, Mr. Palmer in an individual retirement account. 1,766 of these shares and 7,064 shares held for the benefit of Mr. Palmer (the “Palmer Earnout Shares”) are currently held in escrow for the benefit of Mr. Palmer. The Palmer Earnout Shares are subject to the earnout provisions of the Merger Agreement. Mr. Palmer may not receive the Palmer Earnout Shares until January 31, 2013, and the number of shares that he will receive, if any, is subject to reduction in accordance with the terms of the Merger Agreement. Mr. Palmer has the right to vote the Palmer Earnout Shares prior to their cancellation or release from escrow and may be deemed the beneficial owner thereof. Mr. Palmer is Senior Vice President of First Southwest. |
| (95) | Comprised of shares held by Mr. Partin in an individual retirement account. |
| (96) | Includes 101,697 shares held by Mr. Pierce in an individual retirement account. Also includes 55,515 shares allocated to the account of Mr. Pierce pursuant to the ESOP. Each ESOP participant has the right to direct the ESOP Trustee to vote the shares allocated to his or her account on all matters requiring the vote of our shareholders and as such, Mr. Pierce may be deemed the beneficial owner of such shares. Also includes 45,000 shares of restricted stock. Pursuant to the terms of Mr. Pierce’s restricted stock grant, he has the right to vote such shares and may be deemed the beneficial owner thereof. Also includes 9,822 shares issuable to Mr. Pierce upon exercise of stock options issued under the Stock Option Plans. |
153
Table of Contents
Index to Financial Statements
| Mr. Pierce is an officer and director of the Bank and a former director of PlainsCapital Corporation. Mr. Pierce is a member of the PlainsCapital Corporation ESOP Committee, which serves as the ESOP Trustee. The ESOP holds more than 5% of the Original Common Stock. |
| (97) | Comprised of shares held by Mr. Pierce in an individual retirement account. |
| (98) | Mr. Price is a former employee of the Bank. |
| (99) | Mr. Ratliff is a director and the secretary of JRR Corporation, the general partner of Ratliff Family No 3 Limited Partnership, and may be deemed to have voting and/or investment power with respect to 421,836 shares owned by the Ratliff Family No 3 Limited Partnership, of which 42,000 shares will be sold pursuant to this offering. Mr. Ratliff has disclaimed beneficial ownership with respect to all but 10,000 of the shares held by the Ratliff Family No 3 Limited Partnership. |
| (100) | JRR Corporation is the general partner of the Ratliff Family No 3 Limited Partnership and may be deemed to have voting and/or investment power with respect to the shares owned by the Ratliff Family No 3 Limited Partnership. Suzanne Bryant is a director and the president of JRR Corporation. Ms. Bryant is also a limited partner of Ratliff Family No 3 Limited Partnership. Ms. Bryant has disclaimed beneficial ownership with respect to all but 12,000 of the shares held by the Ratliff Family No 3 Limited Partnership. James Ratliff is a limited partner of Ratliff Family No 3 Limited Partnership. Mr. Ratliff has disclaimed beneficial ownership with respect to all but 10,000 of the shares held by the Ratliff Family No 3 Limited Partnership. |
| (101) | Comprised of shares held by Ms. Rosen in an individual retirement account. |
| (102) | Sandra F. Sitton is the trustee of Management Trust, Ltd., the general partner of Sandra F. Sitton Enterprises, Ltd., and may be deemed to have voting and/or investment control with respect to the shares owned by Sandra F. Sitton Enterprises, Ltd. |
| (103) | Includes 84,672 shares held by Dr. Seger in an individual retirement account, 16,419 shares held directly by Mrs. Seger, the spouse of Dr. Seger, and 6,219 shares held by Mrs. Seger in an individual retirement account. Dr. Seger is a former director of PlainsCapital Corporation and a current director of the Bank. |
| (104) | Includes 50,000 shares held by Dr. and Mrs. Seger and 16,419 shares held separately by Mrs. Seger. |
| (105) | C. R. Gallagher Jr., is Trustee of the Andrew R. Seger 1990 Trust and may be deemed to have voting and/or investment power with respect to the shares owned by the Andrew R. Seger 1990 Trust. |
| (106) | C. R. Gallagher Jr., is Trustee of the Michael V. Seger 1990 Trust and may be deemed to have voting and/or investment power with respect to the shares owned by the Michael V. Seger 1990 Trust. |
| (107) | C. R. Gallagher Jr. is Trustee of the Michael Seger Childrens Trust and may be deemed to have voting and/or investment power with respect to the shares owned by the Michael Seger Childrens Trust. |
| (108) | C. R. Gallagher Jr. is Trustee of the Hilary C. Seger 1990 Trust and may be deemed to have voting and/or investment power with respect to the shares owned by the Hilary C. Seger 1990 Trust. |
| (109) | Mr. Steinhart is a former employee of PrimeLending. |
| (110) | Comprised of shares held by Mr. Strong in an individual retirement account. |
| (111) | Comprised of shares held by Ms. Strong in an individual retirement account. |
| (112) | Comprised of shares held by Mr. Tate in an individual retirement account. Mr. Tate is an employee of the Bank. |
| (113) | Ms. Terrill also owns 450 shares with Grady Terrill, her spouse, none of which will be sold in this offering. |
| (114) | Thomas F. Neal, President, Owner, MD of the Thomas F. Neal, M.D., PA Profit Sharing Plan, may be deemed to have voting and/or investment power with respect to the shares owned by the Thomas F. Neal, M.D., PA Profit Sharing Plan. |
| (115) | Includes 10,716 shares held by Mr. Tipton in an individual retirement account, and 14,269 shares allocated to the account of Mr. Tipton pursuant to the ESOP. Each ESOP participant has the right to direct the ESOP Trustee to vote the shares allocated to his or her account on all matters requiring the vote of our shareholders and as such, Mr. Tipton may be deemed the beneficial owner of such shares. Mr. Tipton is an employee of the Bank. |
| (116) | Includes 2,600 shares held by Mr. Tipton in an individual retirement account. |
| (117) | Fred Arch Underwood is the president of The Trinity Company and may be deemed to have voting and/or investment power with respect to the shares owned by The Trinity Company. Mr. Underwood is a former advisory director of PlainsCapital Corporation. Mr. Underwood separately owns 34,590 shares, of which he will be selling 3,000 shares in this offering. |
| (118) | Mr. Underwood is a former advisory director of PlainsCapital Corporation. Mr. Underwood separately may be deemed to have voting and/or investment control with respect to 1,047,168 shares held by The Trinity Company, of which 100,000 will be sold in this offering. |
| (119) | Mr. Villarreal is an Executive Vice President of the Bank. Includes 16,521 shares allocated to the account of Mr. Villarreal pursuant to the ESOP. Each ESOP participant has the right to direct the ESOP Trustee to vote the shares allocated to his or her account on all matters requiring the vote of our shareholders and as such, Mr. Villarreal may be deemed the beneficial owner of such shares. Also includes 8,184 shares issuable to Mr. Villarreal upon exercise of stock options issued under the Stock Option Plans. |
| (120) | Mary Jordanne McGinty McCauley serves as trustee of this trust and may be deemed to have voting and/or investment power with respect to the share owned by The William J. McGinty Trust For Mary Jordanne McGinty. Includes 6,156 shares held in the Adele McGinty Trust For Mary Jordanne McGinty. |
154
Table of Contents
Index to Financial Statements
| (121) | Includes 6,375 shares owned by Wallace Sprinkler, Inc. |
| (122) | Comprised of 13,953 shares held by Mr. West in an individual retirement account. |
| (123) | Includes 119,955 shares held by Ms. White in an individual retirement account. Ms. White is a limited partner of Maedgen & White, Ltd., which beneficially owns 2,389,122 shares. Ms. White is an employee of PlainsCapital Corporation. |
| (124) | Includes 1,137 shares held by Ms. Wilson in an individual retirement account and 3,000 shares issuable to Mr. Wilson upon exercise of stock options issued under the Stock Option Plans. Ms. Wilson is an employee of the Bank. |
| (125) | Bank of America serves as trustee for this trust may be deemed to have voting and/or investment power with respect to the shares owned by the IM Janet Woolwine Trust. |
| (126) | The Bank serves as trustee for this trust and may be deemed to have voting and/or investment power with respect to the shares owned by the Janet Igo Woolwine 1995 GS Trust. |
| (127) | Mr. Wright is an employee of the Bank. |
155
Table of Contents
Index to Financial Statements
General
The following discussion summarizes some of the important rights of our common shareholders. This discussion does not purport to be a complete description of these rights and may not contain all of the information regarding our common stock that is important to you. These rights can be determined in full only by reference to federal and state banking laws and regulations, the Texas Business Organizations Code and our certificate of formation and bylaws.
Our certificate of formation authorizes the issuance of 200 million shares of common stock, par value $0.001 per share, and 50 million shares of preferred stock, par value $1.00 per share. Immediately prior to the offering, no shares of our Common Stock will be issued and outstanding, 33,813,813 shares of Original Common Stock will be issued and outstanding, 87,631 shares of Fixed Rate Cumulative Perpetual Preferred Stock, Series A will be issued and outstanding and 4,382 shares of Fixed Rate Cumulative Perpetual Preferred Stock, Series B will be issued and outstanding. We intend to redeem the shares of Series A Series B Preferred Stock with the proceeds of this offering, subject to regulatory approval. 1,697,430 shares of these shares of Original Common Stock are currently held in escrow by an escrow agent on behalf of the former stockholders of First Southwest and may be released to such stockholders upon the satisfaction of the earnout provisions contained in the Merger Agreement.
Common Stock
Following this offering, we will have two outstanding classes of common stock, Common Stock and Original Common Stock. The rights of the holders of the shares of Common Stock and Original Common Stock are identical, except with respect to conversion. Each share of Original Common Stock is convertible at any time at our election into one share of Common Stock. The Original Common Stock also will automatically convert into shares of Common Stock in certain circumstances described below under the section entitled “Conversion”.
Voting
Each holder of our Common Stock and Original Common Stock is entitled to one vote per share of Common Stock or Original Common Stock held on each matter submitted to a vote of our shareholders. Holders of shares of our Common Stock and Original Common Stock do not have cumulative voting rights in the election of directors, which means that a plurality of the votes cast by the holders of the shares of our Original Common Stock and Common Stock voting together as a single class at a meeting of shareholders at which a quorum is present could elect all of the nominees.
Beginning with the 2010 annual meeting of shareholders, our board of directors will be divided into three classes of directors, each serving a staggered three-year term. One class of directors will hold office initially for a term expiring at the annual meeting of shareholders to be held in 2011, another class will hold office initially for a term expiring at the annual meeting of shareholders to be held in 2012, and another class will hold office initially for a term expiring at the annual meeting of shareholders to be held in 2013. At each annual meeting following this initial classification and election, the successors to the class of directors whose terms expire at that meeting will be elected for a term of office to expire at the third succeeding annual meeting after their election and until their successors have been duly elected and qualified.
156
Table of Contents
Index to Financial Statements
Dividends
Subject to the restrictions and limitations imposed by applicable law and those contained in the Certificates of Designations of our Series A and Series B Preferred Stock, which, subject to regulatory approval, we intend to redeem with the proceeds of this offering, we can pay dividends out of statutory surplus or from net profits if, as and when declared by our board of directors. The holders of our Common Stock and Original Common Stock are entitled to receive and share equally in such dividends as may be declared by the board of directors out of the legally available funds.
Liquidation
Upon our liquidation, dissolution or winding up, the holders of Common Stock and Original Common Stock would be entitled to share ratably in the net assets legally available for distribution to shareholders after the payment of all of our debts and other liabilities, subject to the prior rights of the holders of Series A and Series B Preferred Stock, which, subject to regulatory approval, we intend to redeem with the proceeds of this offering, and any preferred stock that may be issued in the future. Our outstanding shares of Original Common Stock are, and the shares of Common Stock to be issued in the offering will be, upon payment therefore, validly issued, fully paid and nonassessable. Holders of our common stock have no subscription, sinking fund, conversion or preemptive rights. Any authorized shares of our common stock that remain unissued are available for future issuance by us without any shareholder approval.
Conversion
Shares of our Common Stock are not convertible into any other shares of our capital stock.
Each share of our Original Common Stock is convertible into one share of Common Stock. All outstanding shares of our Original Common Stock will automatically convert into shares of our Common Stock on a one-for-one basis 180 days after the pricing of this offering of our Common Stock, subject to limited extension under certain circumstances. We also have the right to convert all or any portion of the outstanding shares of our Original Common Stock into shares of Common Stock on a one-for-one basis at any time, and any shares of our Original Common Stock that remain outstanding on June 30, 2011 will automatically convert into shares of our Common Stock on a one-for-one basis.
Preferred Stock
Our authorized capital stock includes 50 million shares of preferred stock. Our board of directors may, in its sole discretion, designate and issue one or more series of preferred stock from the authorized and unissued shares of preferred stock. Subject to limitations imposed by law or our certificate of formation, our board of directors is empowered to determine: (i) the designation of, and the number of, shares constituting each series of preferred stock, (ii) the dividend rate for each series, (iii) the terms and conditions of any voting, conversion, and exchange rights for each series, (iv) the amounts payable on each series upon redemption or our liquidation, dissolution or winding-up, (v) the provisions of any sinking fund for the redemption or purchase of shares of any series, and (vi) the preferences and the relative rights among the series of preferred stock. At the discretion of our board of directors, and subject to its fiduciary duties, the preferred stock could be used to deter any takeover attempt, by tender offer or otherwise. In addition, preferred stock could be issued with voting and conversion rights that could adversely affect the voting
157
Table of Contents
Index to Financial Statements
power of the shares of our common stock. The issuance of preferred stock could also result in a series of securities outstanding that would have preferences over the common stock with respect to dividends and in liquidation.
On December 19, 2008, we sold 87,631 shares of our Series A Preferred Stock, liquidation preference $1,000 per share, for approximately $87.6 million and 4,382 shares of our Series B Preferred Stock, liquidation preference $1,000 per share, to the U.S. Treasury pursuant to the TARP Capital Purchase Program. The shares of Series B Preferred Stock were issued to the U.S. Treasury for nominal consideration upon the exercise of a warrant issued in conjunction with the Series A Preferred Stock. The shares of Series A and Series B Preferred Stock issued to the U.S. Treasury are senior to shares of our common stock with respect to dividends and liquidation preference. Under the terms of the Series A Preferred Stock, we are obligated to pay a 5% per annum cumulative dividend on the stated value of the preferred stock until February 15, 2014 and thereafter at a rate of 9% per annum. As long as shares of the Series A and Series B Preferred Stock remain outstanding, we may not pay dividends to our common shareholders (nor may we repurchase or redeem any shares of our common stock) unless all accrued and unpaid dividends on the preferred stock have been paid in full. Furthermore, prior to December 19, 2011, unless we have redeemed all of the Series A and Series B Preferred Stock, the consent of the U.S. Treasury will be required to, among other things, increase the amount of dividends paid on our common stock. After December 19, 2011 and thereafter until December 19, 2018, the consent of the U.S. Treasury (if it still holds our preferred stock) will be required for any increase in the aggregate common stock dividends per share greater than 3% per annum. After December 19, 2018, we will be prohibited from paying dividends on or repurchasing any common stock until the preferred stock issued to the U.S. Treasury is redeemed in whole or the U.S. Treasury has transferred all of its preferred stock to third parties. If dividends on the preferred stock are not paid in full for six dividend periods, whether or not consecutive, the U.S. Treasury will have the right to elect two directors to our board of directors until all unpaid cumulative dividends are paid in full. The terms of the Series B Preferred Stock are identical to those described above for the Series A Preferred Stock except that (i) the dividend rate is 9% per annum and (ii) the Series B Preferred Stock may not be redeemed unless all of the Series A Preferred Stock is redeemed.
Anti-takeover effects of Texas law and our certificate of formation and bylaws
Texas law and certain provisions of our certificate of formation and bylaws could have the effect of delaying, deferring or discouraging another party from acquiring control of our company. These provisions, summarized below, are intended to encourage persons seeking to acquire control of us to first negotiate with its board of directors. These provisions also serve to discourage hostile takeover practices and inadequate takeover bids. We believe that these provisions are beneficial because the negotiation they encourage could result in improved terms of any unsolicited proposal.
Action by written consent without unanimous written consent
Under Texas law and our certificate of formation, no action required or permitted to be taken at an annual or special meeting of shareholders may be taken by written consent in lieu of a meeting of shareholders without the unanimous written consent of all shareholders unless the certificate of formation specifically allows action by less than unanimous consent. Our certificate of formation prohibits action by written consent upon less than unanimous consent.
158
Table of Contents
Index to Financial Statements
Business combinations with certain persons
Texas law also provides that, subject to certain exceptions, a Texas corporation such as us may not engage in certain business combinations, including mergers, consolidations and asset sales, with a person, or an affiliate or associate of such person, who is an “Affiliated Shareholder” (generally defined as the holder of 20% or more of the corporation’s voting shares) for a period of three years from the date such person became an Affiliated Shareholder unless: (1) the business combination or purchase or acquisition of shares made by the Affiliated Shareholder was approved by the board of directors of the corporation before the Affiliated Shareholder became an Affiliated Shareholder or (2) the business combination was approved by the affirmative vote of the holders of at least two-thirds of the outstanding voting shares of the corporation not beneficially owned by the Affiliated Shareholder, at a meeting of shareholders called for that purpose (and not by written consent), not less than six months after the Affiliated Shareholder became an Affiliated Shareholder. This law may have the effect of inhibiting a non-negotiated merger or other business combination involving us, even if such event would be beneficial to our shareholders.
Our board of directors is classified
Our certificate of formation and bylaws provide that our board of directors, effective beginning with our 2010 Annual Meeting of Shareholders, is classified into three classes of directors, with the members of one class to be elected each year, which prevents our directors from being removed during their terms other than for cause. Our certificate of formation also provides for noncumulative voting for directors.
Authorized but unissued capital stock
We have authorized but unissued shares of preferred stock and common stock, and our board of directors may authorize the issuance of one or more series of preferred stock without shareholder approval. These shares could be used by our board of directors to make it more difficult or to discourage an attempt to obtain control of us through a merger, tender offer, proxy contest or otherwise.
Limitation on right to call a special meeting of shareholders
Our certificate of formation provides that a special meeting of shareholders may be called only by certain officers or upon the written request of the holders of not less than 35% of the voting power represented by all the shares issued, outstanding and entitled to be voted at the proposed special meeting.
Right of first offer granted to former First Southwest stockholders
Pursuant to our acquisition of First Southwest, we agreed that in the event we determine to sell the properties or business of First Southwest or its subsidiaries prior to December 31, 2010 to someone other than one of our affiliates, and such sale does not constitute a change of control (as defined in the Merger Agreement) of us, we will provide notice and allow the former First Southwest stockholders the opportunity to purchase such properties or business in accordance with the terms set forth in the Merger Agreement.
159
Table of Contents
Index to Financial Statements
Limitation of liability and indemnification
Consistent with Texas law, our certificate of formation provides that our directors will not be liable to us or our shareholders for any action or omission in such director’s capacity as a director.
Our certificate of formation also provides that we must indemnify each of our directors and officers to the fullest extent permitted by law. Our certificate of formation also permits us to secure insurance on behalf of any director or officer for any liability arising out of his or her actions in such capacity.
Transfer agent and registrar
Continental Stock Transfer & Trust Company serves as our transfer agent and registrar.
160
Table of Contents
Index to Financial Statements
Shares eligible for future sale
Market information
There is currently no established public trading market or publicly available quotations for our common stock. As of September 30, 2009, 33,813,813 shares of our Original Common Stock were outstanding and held of record by approximately 507 holders (inclusive of those brokerage firms, clearing houses, banks and other nominee holders, holding common stock for clients, with each such nominee being considered as one holder). Additionally, as of September 30, 2009, there were 969,552 shares of our Original Common Stock issuable upon exercise of outstanding stock options. 1,697,430 shares of our Original Common Stock are currently held in escrow, and up to 71,322 shares underlying outstanding and unexercised stock options could be held in escrow if exercised prior to the applicable release date, by an escrow agent on behalf of the former stockholders of First Southwest and may be released to such stockholders upon the satisfaction of the earnout provisions contained in the Merger Agreement. As of September 30, 2009, there were no shares of our Common Stock issued and outstanding. Immediately prior to this offering, there will be approximately 33,813,813 shares of Common Stock and Original Common Stock issued and outstanding, and immediately following the offering, approximately 44,101,712 shares of Common Stock and Original Common Stock will be issued and outstanding or 46,351,712 shares if the underwriters exercise their over-allotment option in full. Of these shares, the 15,000,000 shares of Common Stock sold in this offering, or 17,250,000 shares of Common Stock if the underwriters exercise their over-allotment option in full, will be freely tradable without restriction under the Securities Act of 1933, as amended (the “Securities Act”), except for any shares purchased by one of our “affiliates” as defined in Rule 144 under the Securities Act.
Rule 144
Pursuant to Rule 144 promulgated under the Securities Act, all shares held by non-affiliates that have been issued and outstanding for more than six months are eligible for resale (other than those shares in excess of the volume limitation for each affiliated holder). Future sales of large numbers of shares into a limited trading market or the concerns that those sales may occur could cause the trading price of our Common Stock to decrease or to be lower than it might otherwise be. Upon consummation of the offering and subject where applicable to the volume limitation of Rule 144, up to approximately 7.5 million shares of our Original Common Stock could be sold pursuant to Rule 144 immediately following this offering and approximately 29.1 million shares of our Common Stock could be sold upon the expiration of the 180-day lock-up period described below. All shares of our Original Common Stock will convert to Common Stock no later than the expiration of the 180-day lock-up period described below.
Registration rights
6,790,107 shares of our Original Common Stock are subject to certain “piggyback” registration rights granted to former stockholders of First Southwest Holdings, Inc. pursuant to a registration rights agreement that we entered in connection with our acquisition of First Southwest. Pursuant to the registration rights agreement, if we register any of our common stock, including the Common Stock in this offering, other than on a registration statement (i) on Form S-4 or Form S-8, (ii) filed solely in connection with a dividend reinvestment plan covering our officers or directors or (iii) on any form not available for registering our common stock held by former
161
Table of Contents
Index to Financial Statements
stockholders of First Southwest Holdings, Inc., then, we must give each shareholder party to the registration rights agreement the right to participate in such registration. Expenses relating to these registrations are required to be paid by us. If the leading underwriter or underwriters on these registrations advise us that the number of securities to be offered to the public needs to be reduced, first priority for inclusion in the registration will be given to us and then to the piggybacking holders pro rata. These registration rights have been exercised with respect to approximately 230,000 shares of our Original Common Stock, which will be converted into shares of Common Stock immediately prior to this offering and included in this offering.
87,631 shares of our Series A Preferred Stock and 4,382 shares of our Series B Preferred Stock are subject to certain demand and “piggyback” registration rights that we granted to the U.S. Treasury in connection with our participation in the TARP Capital Purchase Program. Pursuant to these registration rights and subject to certain exceptions, we have agreed to register our Series A and Series B Preferred Stock on a shelf registration statement on Form S-3 upon demand by U.S. Treasury or its successor in interest. Pursuant to the piggyback registration rights, if we register any of our securities, including the Common Stock in this offering, on a form that may be used to distribute the Series A and Series B Preferred Stock, then we must give the U.S. Treasury or its successor in interest the right to participate in such registration. Expenses relating to this registration are required to be paid by us. If the leading underwriter or underwriters on this registration advise us that the number of securities to be offered to the public in the piggyback registration needs to be reduced, first priority for inclusion in the registration will be given to us and then to the U.S. Treasury or its successor in interest. This piggyback registration right was not exercised in connection with this offering.
Lock-up arrangements
In connection with this offering, we, our directors who have beneficial ownership over our shares or contemplate participating in our directed share program, our executive officers, and certain of our shareholders have each agreed to enter into a lock-up agreement that restricts the sale of our Original Common Stock and Common Stock, including shares of Common Stock purchased pursuant to a directed share program, for a period of 180 days after the date of this prospectus, subject to an extension in certain circumstances. J.P. Morgan Securities Inc., in its sole discretion, may release any of the shares of our Original Common Stock or Common Stock subject to these lock-up agreements at any time without notice. See “Underwriting”.
Shares of our Original Common Stock beneficially owned by two of our named executive officers, Messrs. White and Feinberg, in the aggregate amount of 877,977 shares of Original Common Stock, were already pledged to other financial institutions to secure outstanding indebtedness at the time that lock-up agreements with the underwriters were entered into with respect to these shares. As Representative of the Underwriters, J.P. Morgan Securities Inc. has agreed that the lock-ups will not prevent the transfer of such shares of Original Common Stock pursuant to the terms of such pledges in the event of a default on such indebtedness. If Messrs. White or Feinberg default on any of the loans securing such indebtedness, the lender may foreclose on and sell the shares securing such indebtedness. See “Risk factors—Shares of certain shareholders may be sold into the market in the near future. This could cause the market price of our Common Stock to drop significantly.”
162
Table of Contents
Index to Financial Statements
Certain material U.S. federal income and estate tax considerations for non-U.S. shareholders
The following is a general discussion of the material U.S. federal income and estate tax consequences of the ownership and disposition of Common Stock by a beneficial owner that is a “non-U.S. holder,” other than a non-U.S. holder that owns, or has owned, actually or constructively, more than 5% of the Company’s Common Stock. A “non-U.S. holder” is a person or entity that, for U.S. federal income tax purposes, is a:
| • | non-resident alien individual, other than certain former citizens and residents of the U.S. subject to tax as expatriates, |
| • | foreign corporation, or |
| • | foreign estate or trust. |
A “non-U.S. holder” does not include an individual who is present in the U.S. for 183 days or more in the taxable year of disposition and is not otherwise a resident of the U.S. for U.S. federal income tax purposes. Such an individual is urged to consult his or her own tax advisor regarding the U.S. federal income tax consequences of the sale, exchange or other disposition of Common Stock.
This discussion is based on the Internal Revenue Code of 1986, as amended (the “Code”), and administrative pronouncements, judicial decisions and final, temporary and proposed Treasury Regulations, changes to any of which subsequent to the date of this prospectus may affect the tax consequences described herein. This discussion does not address all aspects of U.S. federal income and estate taxation that may be relevant to non-U.S. holders in light of their particular circumstances and does not address any tax consequences arising under the laws of any state, local or foreign jurisdiction. Prospective holders are urged to consult their tax advisors with respect to the particular tax consequences to them of owning and disposing of Common Stock, including the consequences under the laws of any state, local or foreign jurisdiction.
Dividends
Dividends paid to a non-U.S. holder of Common Stock generally will be subject to withholding tax at a 30% rate or a reduced rate specified by an applicable income tax treaty. In order to obtain a reduced rate of withholding, a non-U.S. holder will be required to provide an Internal Revenue Service Form W-8BEN certifying its entitlement to benefits under a treaty.
The withholding tax does not apply to dividends paid to a non-U.S. holder who provides a Form W-8ECI, certifying that the dividends are effectively connected with the non-U.S. holder’s conduct of a trade or business within the U.S. Instead, the effectively connected dividends will be subject to regular U.S. income tax as if the non-U.S. holder were a U.S. resident, subject to an applicable income tax treaty providing otherwise. A non-U.S. corporation receiving effectively connected dividends may also be subject to an additional “branch profits tax” imposed at a rate of 30% (or a lower treaty rate).
163
Table of Contents
Index to Financial Statements
Gain on disposition of Common Stock
A non-U.S. holder generally will not be subject to U.S. federal income tax on gain realized on a sale or other disposition of Common Stock unless:
| • | the gain is effectively connected with a trade or business of the non-U.S. holder in the U.S., subject to an applicable treaty providing otherwise, or |
| • | the Company is or has been a U.S. real property holding corporation, as defined below, at any time within the five-year period preceding the disposition or during the non-U.S. holder’s holding period, whichever period is shorter, and its Common Stock has ceased to be traded on an established securities market prior to the beginning of the calendar year in which the sale or disposition occurs. |
Generally, a corporation is a U.S. real property holding corporation if the fair market value of its U.S. real property interests, as defined in the Code and applicable regulations, equals or exceeds 50% of the aggregate fair market value of its worldwide real property interests and its other assets used or held for use in a trade or business. The Company believes that it is not, and does not anticipate becoming, a U.S. real property holding corporation.
Information reporting requirements and backup withholding
In general, information returns will be filed with the Internal Revenue Service in connection with payments of dividends and the proceeds from a sale or other disposition of Common Stock. A non-U.S. holder may have to comply with certification procedures to establish that it is not a U.S. person in order to avoid backup withholding tax. The certification procedures required to claim a reduced rate of withholding under a treaty will satisfy the certification requirements necessary to avoid the backup withholding tax as well. The amount of any backup withholding from a payment to a non-U.S. holder will be allowed as a credit against such holder’s U.S. federal income tax liability and may entitle such holder to a refund, provided that the required information is timely furnished to the Internal Revenue Service.
Federal estate tax
Absent an applicable treaty, the Common Stock will be treated as U.S. situs property and subject to U.S. federal estate tax. This should be noted by both individual non-U.S. holders and certain entities, the property of which is potentially includible in such an individual’s gross estate for U.S. federal estate tax purposes (for example, a trust funded by such an individual and with respect to which the individual has retained certain interests or powers).
164
Table of Contents
Index to Financial Statements
We and the selling shareholders are offering the shares of Common Stock described in this prospectus through a number of underwriters. J.P. Morgan Securities Inc. is acting as book-running manager of the offering and as representative of the underwriters. We and the selling shareholders have entered into an underwriting agreement with the underwriters. Subject to the terms and conditions of the underwriting agreement, we and the selling shareholders have agreed to sell to the underwriters, and each underwriter has severally agreed to purchase, at the public offering price less the underwriting discounts and commissions set forth on the cover page of this prospectus, the number of shares of Common Stock listed next to the name of the underwriter in the following table.
| Name | Number of shares | |
| J.P. Morgan Securities Inc. |
||
| Fox-Pitt Kelton Cochran Caronia Waller (USA) LLC |
||
| Keefe, Bruyette & Woods, Inc. |
||
| Stephens Inc. |
||
| Total |
15,000,000 | |
The underwriters are committed to purchase all the shares of our Common Stock offered by us and the selling shareholders if they purchase any shares. The underwriting agreement also provides that if an underwriter defaults, the purchase commitments of non-defaulting underwriters may also be increased or the offering may be terminated.
The underwriters propose to offer the Common Stock directly to the public at the initial public offering price set forth on the cover page of this prospectus and to certain dealers at that price less a concession not in excess of $ per share. Any such dealers may resell shares to certain other brokers or dealers at a discount of up to $ per share from the initial public offering price. After the initial public offering of the shares, the offering price and other selling terms may be changed by the underwriters. Sales of shares made outside of the U.S. may be made by affiliates of the underwriters.
The underwriters have an option to buy up to 2,250,000 additional shares of Common Stock from us to cover sales of shares by the underwriters which exceed the number of shares specified in the table above. The underwriters have 30 days from the date of this prospectus to exercise this over-allotment option. If any shares are purchased with this over-allotment option, the underwriters will purchase shares in approximately the same proportion as shown in the table above. If any additional shares of Common Stock are purchased, the underwriters will offer the additional shares on the same terms as those on which the shares are being offered.
165
Table of Contents
Index to Financial Statements
The underwriting fee is equal to the public offering price per share of Common Stock less the amount paid by the underwriters to us and the selling shareholders per share of Common Stock. The underwriting fee is $ per share. The following table shows the per share and total underwriting discounts and commissions that we and the selling shareholders are to pay to the underwriters in connection with this offering. These amounts are shown assuming both no exercise and full exercise of the underwriters’ option to purchase additional shares.
| Per share | Total | |||||||
| Without exercise of option to shares |
With exercise of |
Without exercise of option to purchase additional shares |
With exercise of | |||||
| Underwriting discounts and commissions paid by us |
$ | $ | $ | $ | ||||
| Expenses payable by us |
$ | $ | $ | $ | ||||
| Underwriting discounts and commissions paid by the selling shareholders |
$ | $ | $ | $ | ||||
| Expenses payable by the selling shareholders |
$ | $ | $ | $ | ||||
We have directed the underwriters to reserve up to 750,000 shares of Common Stock for sale to our directors, officers, employees and other persons at the initial public offering price through a directed share program. The number of shares of Common Stock available for sale to the general public in the offering will be reduced to the extent these persons purchase any reserved shares. Any shares of Common Stock not so purchased will be offered by the underwriters to the general public on the same basis as other shares of Common Stock offered hereby. Stephens Inc., a participating underwriter in this offering, will administrate the directed share program. We have agreed to indemnify the administrator of the directed share program against certain liabilities and expenses relating to, arising out of, or in connection with the directed share program as well as liabilities arising out of or based upon certain material misstatements or omissions and liabilities caused by the failure of directed share program participants to pay for and accept delivery of shares of Common Stock which they agreed to purchase.
We estimate that the total expenses of this offering, including registration, filing and listing fees, printing fees and legal and accounting expenses, but excluding the underwriting discounts and commissions, will be approximately $1,550,000.
A prospectus in electronic format may be made available on the web sites maintained by one or more underwriters, or selling group members, if any, participating in the offering. The underwriters may agree to allocate a number of shares to underwriters and selling group members for sale to their online brokerage account holders. Internet distributions will be allocated by the representatives to underwriters and selling group members that may make Internet distributions on the same basis as other allocations.
We have agreed that, for a period of 180 days after the date of this prospectus, we will not (i) offer, pledge, announce the intention to sell, sell, contract to sell, sell any option or contract to purchase, purchase any option or contract to sell, grant any option, right or warrant to purchase or otherwise transfer or dispose of, directly or indirectly, or file with the SEC a registration statement relating to any shares of our Common Stock or any securities convertible into or exercisable or exchangeable for Common Stock (or convert any shares of our Original Common Stock) or (ii) enter into any swap or other agreement that transfers, in whole or in part, any of the economic consequences of ownership of the Common Stock or such other securities,
166
Table of Contents
Index to Financial Statements
whether any such transaction described in clause (i) or (ii) above is to be settled by delivery of Common Stock or such other securities, in cash or otherwise, other than (a) the shares to be sold hereunder, (b) grants of any awards under company stock plans, and any shares of Original Common Stock or Common Stock of our company issued upon the exercise of options granted under company stock plans, (c) the filing of any Registration Statement on Form S-8 relating to any shares that have been or may be issued pursuant to clauses (a) or (b) above and (d) sales of shares of Common Stock or any securities convertible into or exercisable or exchangeable for Common Stock pursuant to the mandate of regulatory authorities including the filing of any registration statement with respect thereto. Notwithstanding the foregoing, if (1) during the last 17 days of the 180-day restricted period, we issue an earnings release or material news or a material event relating to our company occurs; or (2) prior to the expiration of the 180-day restricted period, we announce that we will release earnings results during the 16-day period beginning on the last day of the 180-day period, the restrictions described above shall continue to apply until the expiration of the 18-day period beginning on the issuance of the earnings release or the occurrence of the material news or material event.
Our directors who have beneficial ownership over our shares or contemplate participating in our directed share program, our executive officers, and certain of our shareholders have entered into lock-up agreements with the underwriters prior to the commencement of this offering pursuant to which we and each of these persons or entities, for a period of 180 days after the date of this prospectus, may not, without the prior written consent of J.P. Morgan Securities Inc., (1) offer, pledge, announce the intention to sell, sell, contract to sell, sell any option or contract to purchase, purchase any option or contract to sell, grant any option, right or warrant to purchase, or otherwise transfer or dispose of, directly or indirectly, any shares of our Common Stock or any securities convertible into or exercisable or exchangeable for Common Stock (including without limitation, Common Stock or such other securities which may be deemed to be beneficially owned by such persons in accordance with the rules and regulations of the SEC and securities which may be issued upon exercise of a stock option or warrant) or (2) enter into any swap or other agreement that transfers, in whole or in part, any of the economic consequences of ownership of the Common Stock or such other securities, whether any such transaction described in clause (1) or (2) above is to be settled by delivery of Common Stock or such other securities, in cash or otherwise or (3) make any demand for or exercise any right with respect to the registration of any shares of Common Stock or any security convertible into or exercisable or exchangeable for Common Stock, in each case other than (A) the shares of Common Stock sold by the selling shareholders in this offering, (B) transfers of shares of Common Stock as a bona fide gift or gifts, and (C) distributions of shares of Common Stock to members or stockholders of such persons; provided that in the case of any transfer or distribution pursuant to clause (B) or (C), each donee or distributee shall execute and deliver to J.P. Morgan Securities Inc. a lock-up letter in the same form; and provided, further, that in the case of any transfer or distribution pursuant to clause (B) or (C), no filing by any party (donor, donee, transferor or transferee) under the Securities Exchange Act of 1934, as amended, or other public announcement shall be required or shall be made voluntarily in connection with such transfer or distribution (other than a filing on a Form 5 made after the expiration of the 180-day period referred to above). Notwithstanding the foregoing, if (1) during the last 17 days of the 180-day restricted period, we issue an earnings release or material news or a material event relating to our company occurs; or (2) prior to the expiration of the 180-day restricted period, we announce that we will release earnings results during the 16-day period beginning on the last day of the 180-day period, the restrictions described above shall continue to apply until the expiration of the 18-day period beginning on the issuance of the earnings release or the occurrence of the material news or material event.
167
Table of Contents
Index to Financial Statements
Shares of our Original Common Stock beneficially owned by two of our named executive officers, Messrs. White and Feinberg, in the aggregate amount of 877,977 shares of Original Common Stock, were already pledged to other financial institutions at the time that lock-up agreements with the underwriters were entered with respect to these shares. As Representative of the Underwriters, J.P. Morgan Securities Inc. has agreed that these lock-ups will not prevent the transfer of such shares of Original Common Stock pursuant to the terms of such pledges in the event of a default on such indebtedness. See “Risk factors—Shares of certain shareholders may be sold into the market in the near future. This could cause the market price of our Common Stock to drop significantly.”
We and the selling shareholders have agreed to indemnify the underwriters against certain liabilities, including liabilities under the Securities Act. We and the selling shareholders have also agreed to indemnify our transfer agent, Continental Stock Transfer & Trust Company, severally and not jointly against certain liabilities arising out of the transfer of the selling shareholders’ shares in connection with their participation in this offering. We have agreed to indemnify each of the selling shareholders against liability to our transfer agent unless such liability is caused by such selling shareholder’s willful misconduct or gross negligence.
Our Common Stock has been authorized for listing on the NYSE under the symbol “PCB,” subject to official notice of issuance. In order to meet one of the requirements for listing our Common Stock on the NYSE, the underwriters have undertaken to sell lots of our Common Stock in the offering such that, upon consummation of the offering, the underwriters expect that there will be at least 400 beneficial U.S. shareholders holding 100 shares or more of our common stock each and at least 1,100,000 publicly-held shares of our common stock outstanding in the United States having a market value of at least $100,000,000.
In connection with this offering, the underwriters may engage in stabilizing transactions, which involves making bids for, purchasing and selling shares of Common Stock in the open market for the purpose of preventing or retarding a decline in the market price of the Common Stock while this offering is in progress. These stabilizing transactions may include making short sales of the Common Stock, which involves the sale by the underwriters of a greater number of shares of Common Stock than they are required to purchase in this offering, and purchasing shares of Common Stock on the open market to cover positions created by short sales. Short sales may be “covered” shorts, which are short positions in an amount not greater than the underwriters’ over-allotment option referred to above, or may be “naked” shorts, which are short positions in excess of that amount. The underwriters may close out any covered short position either by exercising their over-allotment option, in whole or in part, or by purchasing shares in the open market. In making this determination, the underwriters will consider, among other things, the price of shares available for purchase in the open market compared to the price at which the underwriters may purchase shares through the over-allotment option. A naked short position is more likely to be created if the underwriters are concerned that there may be downward pressure on the price of the Common Stock in the open market that could adversely affect investors who purchase in this offering. To the extent that the underwriters create a naked short position, they will purchase shares in the open market to cover the position.
The underwriters have advised us that, pursuant to Regulation M promulgated under the Securities Act, they may also engage in other activities that stabilize, maintain or otherwise affect the price of the Common Stock, including the imposition of penalty bids. This means that if the representatives of the underwriters purchase Common Stock in the open market in stabilizing transactions or to cover short sales, the representatives can require the underwriters that sold those shares as part of this offering to repay the underwriting discount received by them.
168
Table of Contents
Index to Financial Statements
These activities may have the effect of raising or maintaining the market price of the Common Stock or preventing or retarding a decline in the market price of the Common Stock, and, as a result, the price of the Common Stock may be higher than the price that otherwise might exist in the open market. If the underwriters commence these activities, they may discontinue them at any time. The underwriters may carry out these transactions on the NYSE, in the over-the-counter market or otherwise.
Prior to this offering, there has been no public market for our Common Stock. The initial public offering price will be determined by negotiations between us and the representatives of the underwriters. In determining the initial public offering price, we and the representatives of the underwriters expect to consider a number of factors including:
| • | the information set forth in this prospectus and otherwise available to the representatives; |
| • | our prospects and the history and prospects for the industry in which we compete; |
| • | an assessment of our management; |
| • | our prospects for future earnings; |
| • | the general condition of the securities markets at the time of this offering; |
| • | the recent market prices of, and demand for, publicly traded common stock of generally comparable companies; and |
| • | other factors deemed relevant by the underwriters and us. |
Neither we nor the underwriters can assure investors that an active trading market will develop for our Common Stock, or that the shares will trade in the public market at or above the initial public offering price.
Other than in the U.S., no action has been taken by us or the underwriters that would permit a public offering of the securities offered by this prospectus in any jurisdiction where action for that purpose is required. The securities offered by this prospectus may not be offered or sold, directly or indirectly, nor may this prospectus or any other offering material or advertisements in connection with the offer and sale of any such securities be distributed or published in any jurisdiction, except under circumstances that will result in compliance with the applicable rules and regulations of that jurisdiction. Persons into whose possession this prospectus comes are advised to inform themselves about and to observe any restrictions relating to the offering and the distribution of this prospectus. This prospectus does not constitute an offer to sell or a solicitation of an offer to buy any securities offered by this prospectus in any jurisdiction in which such an offer or a solicitation is unlawful.
This document may only be distributed to, and may only be directed at, (i) persons who are outside the United Kingdom or (ii) to investment professionals falling within Article 19(5) of the Financial Services and Markets Act 2000 (Financial Promotion) Order 2005 (the “Order”) or (iii) high net worth entities, and other persons to whom it may lawfully be communicated, falling with Article 49(2)(a) to (d) of the Order (all such persons together being referred to as “relevant persons”). The securities are only available to, and any invitation, offer or agreement to subscribe, purchase or otherwise acquire such securities will be engaged in only with, relevant persons. Any person who is not a relevant person should not act or rely on this document or any of its contents.
169
Table of Contents
Index to Financial Statements
In relation to each Member State of the European Economic Area which has implemented the Prospectus Directive (each, a “Relevant Member State”), from and including the date on which the European Union Prospectus Directive (the “EU Prospectus Directive”) is implemented in that Relevant Member State (the “Relevant Implementation Date”) an offer of securities described in this prospectus may not be made to the public in that Relevant Member State prior to the publication of a prospectus in relation to the shares which has been approved by the competent authority in that Relevant Member State or, where appropriate, approved in another Relevant Member State and notified to the competent authority in that Relevant Member State, all in accordance with the EU Prospectus Directive, except that it may, with effect from and including the Relevant Implementation Date, make an offer of shares to the public in that Relevant Member State at any time:
| • | to legal entities which are authorized or regulated to operate in the financial markets or, if not so authorized or regulated, whose corporate purpose is solely to invest in securities; |
| • | to any legal entity which has two or more of (1) an average of at least 250 employees during the last financial year; (2) a total balance sheet of more than €43,000,000 and (3) an annual net turnover of more than €50,000,000, as shown in its last annual or consolidated accounts; |
| • | to fewer than 100 natural or legal persons (other than qualified investors as defined in the EU Prospectus Directive) subject to obtaining the prior consent of the book-running manager for any such offer; or |
| • | in any other circumstances which do not require the publication by the Issuer of a prospectus pursuant to Article 3 of the EU Prospectus Directive. |
For the purposes of this provision, the expression an “offer of securities to the public” in relation to any securities in any Relevant Member State means the communication in any form and by any means of sufficient information on the terms of the offer and the securities to be offered so as to enable an investor to decide to purchase or subscribe for the securities, as the same may be varied in that Member State by any measure implementing the EU Prospectus Directive in that Member State and the expression EU Prospectus Directive means Directive 2003/71/EC and includes any relevant implementing measure in each Relevant Member State.
Certain of the underwriters and their affiliates have provided in the past to us and our affiliates and may provide from time to time in the future certain commercial banking, financial advisory, investment banking and other services for us and such affiliates in the ordinary course of their business, for which they have received and may continue to receive customary fees and commissions. Specifically, Stephens Inc. performed the annual valuation of our equity held by the ESOP for the fiscal year ended December 31, 2008, and First Southwest performed such valuation for the fiscal years ended December 31, 2007 and 2006. As of September 30, 2009, we also had debt in the principal amount of $50.6 million outstanding with JPMorgan Chase Bank, N.A., an affiliate of J.P. Morgan Securities Inc., and we intend to use approximately $20 million of our net proceeds from this offering to repay borrowings under such loans. In addition, from time to time, certain of the underwriters and their affiliates may effect transactions for their own account or the account of customers, and hold on behalf of themselves or their customers, long or short positions in our debt or equity securities or loans, and may do so in the future.
170
Table of Contents
Index to Financial Statements
Our wholly-owned subsidiary, First Southwest Company, is participating as a broker-dealer in this offering. In addition, more than 5% of the proceeds of the offering are being used to repay borrowings we have received from JPMorgan Chase Bank, N.A., an affiliate of J.P. Morgan Securities Inc., a participating underwriter in this offering. Because of the foregoing, a “conflict of interest” is deemed to exist under NASD Rule 2720 of FINRA. As a result, the offering is being conducted in accordance with the applicable provisions of Rule 2720. Fox Pitt Kelton Cochran Caronia Waller (USA) LLC is assuming the responsibilities of acting as the qualified independent underwriter and has participated in the preparation of the registration statement and the prospectus and exercised the usual standards of due diligence in respect thereto. In addition, in accordance with Rule 2720, neither First Southwest Company nor J.P. Morgan Securities Inc. will makes sales to discretionary accounts without the prior written consent of the customer.
Certain legal matters with respect to the legality of the issuance of the shares of Common Stock offered by us and the selling shareholders by this prospectus will be passed upon for us by Haynes and Boone, LLP, Dallas, Texas and the selling shareholders by Akin Gump Strauss Hauer & Feld LLP, Dallas, Texas. The underwriters are being represented by Davis Polk & Wardwell LLP, New York, New York, in connection with the offering.
Ernst & Young LLP, an independent registered public accounting firm, has audited our consolidated financial statements at December 31, 2008 and 2007, and for each of the three years in the period ended December 31, 2008, as set forth in their report. We have included our financial statements in the prospectus and elsewhere in the registration statement in reliance on Ernst & Young LLP’s report, given on their authority as experts in accounting and auditing.
Where you can find more information
We have filed with the SEC a registration statement on Form S-1 under the Securities Act with respect to the Common Stock we propose to sell in this offering. This prospectus, which constitutes part of the registration statement, does not contain all of the information set forth in the registration statement. For further information about us and the Common Stock that we propose to sell in this offering, we refer you to the registration statement and the exhibits and schedules filed as a part of the registration statement. Statements contained in this prospectus as to the contents of any contract or other document filed as an exhibit to the registration statement are not necessarily complete. If a contract or document has been filed as an exhibit to the registration statement, we refer you to the copy of the contract or document that has been filed as an exhibit to the registration statement.
We file annual, quarterly, and current reports, proxy statements and other information with the SEC. Our SEC filings are available to the public over the Internet on our website at www.plainscapital.com/investors. Information on our web site is not part of this prospectus. You
171
Table of Contents
Index to Financial Statements
may also read and copy any document we file with the SEC at the SEC’s Public Reference Room at 100 F Street, N.E., Washington, D.C. 20549. You can also obtain copies of the documents upon the payment of a duplicating fee to the SEC. Please call the SEC at 1-800-SEC-0330 for further information on the operation of the Public Reference Room. The SEC maintains an Internet site that contains reports, proxy and information statements, and other information regarding issuers that file electronically with the SEC like us. Our SEC filings are also available to the public from the SEC’s website at http://www.sec.gov.
172
Table of Contents
Index to Financial Statements
F-1
Table of Contents
Index to Financial Statements
Consolidated financial statements
PlainsCapital Corporation and subsidiaries
Years ended December 31, 2008, 2007 and 2006
F-2
Table of Contents
Index to Financial Statements
Report of independent registered public accounting firm
The Board of Directors and Shareholders
PlainsCapital Corporation
We have audited the accompanying consolidated balance sheets of PlainsCapital Corporation and subsidiaries (the Company) as of December 31, 2008 and 2007, and the related consolidated statements of income, shareholders’ equity, and cash flows for each of the three years in the period ended December 31, 2008. These financial statements are the responsibility of the Company’s management. Our responsibility is to express an opinion on these financial statements based on our audits.
We conducted our audits in accordance with the standards of the Public Company Accounting Oversight Board (United States). Those standards require that we plan and perform the audit to obtain reasonable assurance about whether the financial statements are free of material misstatement. We were not engaged to perform an audit of the Company’s internal control over financial reporting. Our audits included consideration of internal control over financial reporting as a basis for designing audit procedures that are appropriate in the circumstances, but not for the purpose of expressing an opinion on the effectiveness of the Company’s internal control over financial reporting. Accordingly, we express no such opinion. An audit also includes examining, on a test basis, evidence supporting the amounts and disclosures in the financial statements, assessing the accounting principles used and significant estimates made by management, and evaluating the overall financial statement presentation. We believe that our audits provide a reasonable basis for our opinion.
In our opinion, the financial statements referred to above present fairly, in all material respects, the consolidated financial position of PlainsCapital Corporation and subsidiaries at December 31, 2008 and 2007, and the consolidated results of their operations and their cash flows for each of the three years in the period ended December 31, 2008, in conformity with U.S. generally accepted accounting principles.
As discussed in Note 20 to the financial statements, effective January 1, 2008, the Company adopted Statement of Financial Accounting Standards No., 157 “Fair Value Measurements”, and Statement of Financial Accounting Standards No. 159 “The Fair Value Option for Financial Assets and Financial Liabilities Including an amendment of FASB Statement No. 115.” Also, as discussed in Note 27 to the financial statements, effective January 1, 2008, the Company adopted Emerging Issues Task Force No. 06-4, “Accounting for Deferred Compensation and Post-retirement Benefit Aspects of Endorsement Split Dollar Life Insurance Arrangements.”
/s/ Ernst & Young LLP
Dallas, Texas
March 27, 2009
except for Note 1, as to which the date is
August 28, 2009
F-3
Table of Contents
Index to Financial Statements
PlainsCapital Corporation and subsidiaries
Consolidated balance sheets
December 31,
| (In thousands, except share amounts) | 2008 | 2007 | ||||
| Assets |
||||||
| Cash and due from banks |
$ 92,785 | $ 96,316 | ||||
| Federal funds sold |
21,786 | 30,106 | ||||
| Assets segregated for regulatory purposes |
11,500 | — | ||||
| Loans held for sale |
198,866 | 100,015 | ||||
| Securities |
||||||
| Held to maturity, fair market value $217,019 and $102,592, respectively |
217,209 | 104,499 | ||||
| Available for sale, amortized cost $165,417 and $89,534 respectively |
166,557 | 86,676 | ||||
| Trading, at fair market value |
1,561 | — | ||||
| 385,327 | 191,175 | |||||
| Loans, gross |
2,969,506 | 2,600,829 | ||||
| Unearned income |
(3,887 | ) | (3,467 | ) | ||
| Allowance for loan losses |
(40,672 | ) | (26,517 | ) | ||
| Loans, net |
2,924,947 | 2,570,845 | ||||
| Broker/dealer and clearing organization receivables |
45,331 | — | ||||
| Fee award receivable |
21,544 | — | ||||
| Investment in unconsolidated subsidiaries |
2,012 | 1,548 | ||||
| Premises and equipment, net |
57,336 | 43,323 | ||||
| Accrued interest receivable |
16,164 | 17,213 | ||||
| Other real estate owned |
9,637 | 6,355 | ||||
| Goodwill, net |
36,486 | 37,107 | ||||
| Other intangible assets, net |
82 | 200 | ||||
| Other assets |
128,193 | 88,660 | ||||
| Total assets |
$3,951,996 | $3,182,863 | ||||
| Liabilities and Shareholders’ Equity |
||||||
| Deposits |
||||||
| Noninterest-bearing |
$ 194,901 | 480,052 | ||||
| Interest-bearing |
2,731,198 | 1,913,302 | ||||
| Total deposits |
2,926,099 | 2,393,354 | ||||
| Broker/dealer and clearing organization payables |
59,203 | — | ||||
| Short-term borrowings |
256,452 | 413,060 | ||||
| Treasury tax and loan note option account |
3,424 | 3,246 | ||||
| Capital lease obligations |
8,651 | 3,994 | ||||
| Notes payable |
151,014 | 40,256 | ||||
| Junior subordinated debentures |
67,012 | 51,548 | ||||
| Other liabilities |
80,326 | 43,515 | ||||
| Total liabilities |
3,552,181 | 2,948,973 | ||||
| Commitments and contingencies |
||||||
| Shareholders’ equity |
||||||
| Preferred stock, $1 par value per share, authorized 5,000,000 shares; |
||||||
| Series A, 87,631 and zero shares issued, respectively |
82,736 | — | ||||
| Series B, 4,382 and zero shares issued, respectively |
4,895 | — | ||||
| Common stock, $0.001 par value per share, authorized 50,000,000 shares; issued 31,573,518 and 26,448,429 shares, respectively |
32 | 26 | ||||
| Surplus |
147,445 | 89,335 | ||||
| Retained earnings |
167,865 | 149,694 | ||||
| Accumulated other comprehensive income (loss) |
331 | (1,173 | ) | |||
| 403,304 | 237,882 | |||||
| Unearned ESOP shares (320,712 and 366,915 shares, respectively) |
(3,489 | ) | (3,992 | ) | ||
| Total shareholders’ equity |
399,815 | 233,890 | ||||
| Total liabilities and shareholders’ equity |
$3,951,996 | $3,182,863 | ||||
See accompanying notes.
F-4
Table of Contents
Index to Financial Statements
PlainsCapital Corporation and subsidiaries
Consolidated statements of income
For the years ended December 31,
| (In thousands, except per share amounts) | 2008 | 2007 | 2006 | ||||
| Interest income: |
|||||||
| Loans, including fees |
$182,683 | $209,243 | $181,119 | ||||
| Securities |
10,159 | 10,115 | 9,718 | ||||
| Federal funds sold |
477 | 1,330 | 1,795 | ||||
| Interest-bearing deposits with banks |
73 | 207 | 180 | ||||
| Total interest income |
193,392 | 220,895 | 192,812 | ||||
| Interest expense |
|||||||
| Deposits |
48,236 | 89,058 | 76,065 | ||||
| Short-term borrowings |
10,218 | 8,303 | 2,882 | ||||
| Treasury tax and loan note option account |
21 | 58 | 58 | ||||
| Capital lease obligation |
389 | 224 | 57 | ||||
| Notes payable |
2,878 | 2,627 | 3,466 | ||||
| Junior subordinated debentures |
4,327 | 4,535 | 4,445 | ||||
| Total interest expense |
66,069 | 104,805 | 86,973 | ||||
| Net interest income |
127,323 | 116,090 | 105,839 | ||||
| Provision for loan losses |
22,818 | 5,517 | 5,049 | ||||
| Net interest income after provision for loan losses |
104,505 | 110,573 | 100,790 | ||||
| Noninterest income |
|||||||
| Service charges on depositor accounts |
9,445 | 7,614 | 6,911 | ||||
| Income from loan origination and net gains from sale of loans |
94,353 | 60,483 | 81,442 | ||||
| Trust fees |
4,450 | 4,043 | 2,649 | ||||
| Other |
10,818 | 12,141 | 10,774 | ||||
| Total noninterest income |
119,066 | 84,281 | 101,776 | ||||
| Noninterest expense |
|||||||
| Employees’ compensation and benefits |
112,186 | 93,680 | 104,030 | ||||
| Occupancy and equipment, net |
28,137 | 24,444 | 26,986 | ||||
| Professional services |
11,602 | 9,798 | 10,757 | ||||
| Deposit insurance premium |
1,564 | 441 | 267 | ||||
| Repossession and foreclosure, net of recoveries |
3,386 | 474 | (2,226 | ) | |||
| Minority interests |
437 | 543 | 608 | ||||
| Other |
29,410 | 21,978 | 22,781 | ||||
| Total noninterest expense |
186,722 | 151,358 | 163,203 | ||||
| Income before income taxes |
36,849 | 43,496 | 39,363 | ||||
| Income tax provision |
12,725 | 14,904 | 13,624 | ||||
| Net income |
$ 24,124 | $ 28,592 | $ 25,739 | ||||
| Earnings per share |
|||||||
| Basic |
$ 0.92 | $ 1.10 | $ 1.00 | ||||
| Diluted |
$ 0.92 | $ 1.09 | $ 0.99 | ||||
See accompanying notes.
F-5
Table of Contents
Index to Financial Statements
PlainsCapital Corporation and subsidiaries
Consolidated statements of shareholders’ equity
| (Dollars in thousands) | Comprehensive income |
Preferred stock | Common stock | Surplus |
Retained earnings |
Accumulated comprehensive income (loss) |
Unearned ESOP shares |
Total | |||||||||||||||||
| Shares | Amount | Shares | Amount | ||||||||||||||||||||||
| Year Ended December 31, 2006 |
|||||||||||||||||||||||||
| Balance, January 1, 2006 |
— | $— | 26,129,781 | $87,099 | $ 81 | $105,097 | $ (804 | ) | $(5,041 | ) | $186,432 | ||||||||||||||
| Change in par value of common stock from $10 to $0.001 |
— | — | — | (87,073) | 87,073 | — | — | — | — | ||||||||||||||||
| Stock option plans’ activity |
— | — | 252,591 | — | 1,428 | — | — | — | 1,428 | ||||||||||||||||
| ESOP activity |
— | — | — | — | — | 56 | — | 532 | 588 | ||||||||||||||||
| Cash dividends ($0.19 per share) |
— | — | — | — | — | (4,905 | ) | — | — | (4,905 | ) | ||||||||||||||
| Comprehensive income: |
|||||||||||||||||||||||||
| Net income |
$25,739 | — | — | — | — | — | 25,739 | — | — | 25,739 | |||||||||||||||
| Other comprehensive income (loss): |
|||||||||||||||||||||||||
| Unrealized losses on securities available for sale, net of tax of $203.4 |
(395 | ) | |||||||||||||||||||||||
| Unrealized gains on securities held in trust for the Supplemental Executive Retirement Plan, net of tax of $170.1 |
330 | ||||||||||||||||||||||||
| Unrealized gains on customer-related cash flow hedges, net of tax of $61.7 |
115 | ||||||||||||||||||||||||
| Other comprehensive income |
50 | — | — | — | — | — | — | 50 | — | 50 | |||||||||||||||
| Total comprehensive income |
$25,789 | ||||||||||||||||||||||||
| Balance, December 31, 2006 |
— | — | 26,382,372 | 26 | 88,582 | 125,987 | (754 | ) | (4,509 | ) | 209,332 | ||||||||||||||
| Year Ended December 31, 2007 |
|||||||||||||||||||||||||
| Stock option plans’ activity |
— | — | 66,057 | — | 753 | — | — | — | 753 | ||||||||||||||||
| ESOP activity |
— | — | — | — | — | 49 | — | 517 | 566 | ||||||||||||||||
| Cash dividends ($0.19 per share) |
— | — | — | — | — | (4,934 | ) | — | (4,934 | ) | |||||||||||||||
| Comprehensive income: |
|||||||||||||||||||||||||
| Net income |
$28,592 | — | — | — | — | — | 28,592 | — | — | 28,592 | |||||||||||||||
| Other comprehensive income (loss): |
|||||||||||||||||||||||||
| Unrealized losses on securities available for sale, net of tax of $218.8 |
(425 | ) | |||||||||||||||||||||||
| Unrealized gains on securities held in trust for the Supplemental Executive Retirement Plan, net of tax of $2.0 |
(4 | ) | |||||||||||||||||||||||
| Unrealized gains on customer-related cash flow hedges, net of tax of $5.2 |
10 | ||||||||||||||||||||||||
| Other comprehensive loss |
(419 | ) | — | — | — | — | — | — | (419 | ) | — | (419 | ) | ||||||||||||
| Total comprehensive income |
$28,173 | ||||||||||||||||||||||||
| Balance, December 31, 2007 |
— | — | 26,448,429 | 26 | 89,335 | 149,694 | (1,173 | ) | (3,992 | ) | 233,890 | ||||||||||||||
F-6
Table of Contents
Index to Financial Statements
PlainsCapital Corporation and subsidiaries
Consolidated statements of shareholders’ equity (continued)
| (Dollars in thousands) | Comprehensive income |
Preferred stock | Common stock | Surplus |
Retained earnings |
Accumulated comprehensive income (Loss) |
Unearned ESOP shares |
Total | ||||||||||||||||
| Shares | Amount | Shares | Amount | |||||||||||||||||||||
| Year Ended December 31, 2008 |
||||||||||||||||||||||||
| Cumulative effect of the adoption of EITF 06-4, Accounting for Endorsement Split-Dollar Life Insurance |
— | — | — | — | — | (676 | ) | — | — | (676 | ) | |||||||||||||
| Sale of Series A and Series B preferred stock |
92,013 | 87,631 | — | — | — | — | — | — | 87,631 | |||||||||||||||
| Stock option plans’ activity |
— | — | 32,349 | — | 398 | — | — | — | 398 | |||||||||||||||
| Stock issued in business combination |
— | — | 5,092,740 | 6 | 57,712 | — | — | — | 57,718 | |||||||||||||||
| ESOP activity |
— | — | — | — | — | 36 | — | 503 | 539 | |||||||||||||||
| Cash dividends ($0.20 per share) |
— | — | — | — | — | (5,313 | ) | — | (5,313 | ) | ||||||||||||||
| Comprehensive income: |
||||||||||||||||||||||||
| Net income |
$24,124 | — | — | — | — | — | 24,124 | — | — | 24,124 | ||||||||||||||
| Other comprehensive income (loss): |
||||||||||||||||||||||||
| Unrealized gains on securities available for sale, net of tax of $1,359.3 |
2,638 | |||||||||||||||||||||||
| Unrealized losses on securities held in trust for the Supplemental Executive Retirement Plan, net of tax of $577.8 |
(1,122 | ) | ||||||||||||||||||||||
| Unrealized losses on customer-related cash flow hedges, net of tax of $6.6 |
(12 | ) | ||||||||||||||||||||||
| Other comprehensive income |
1,504 | — | — | — | — | — | — | 1,504 | — | 1,504 | ||||||||||||||
| Total comprehensive income |
$25,628 | |||||||||||||||||||||||
| Balance, December 31, 2008 |
92,013 | $87,631 | 31,573,518 | $32 | $147,445 | $167,865 | $ 331 | $(3,489 | ) | $399,815 | ||||||||||||||
See accompanying notes.
F-7
Table of Contents
Index to Financial Statements
PlainsCapital Corporation and subsidiaries
Consolidated statements of cash flows
For the years ended December 31,
(In thousands)
| 2008 | 2007 | 2006 | |||||||
| Operating Activities |
|||||||||
| Net income |
$ 24,124 | $ 28,592 | $ 25,739 | ||||||
| Adjustments to reconcile net income to net cash provided by operating activities |
|||||||||
| Provision for loan losses |
22,818 | 5,517 | 5,049 | ||||||
| Net losses (gains) on other real estate owned |
1,504 | 737 | (1,725 | ) | |||||
| Depreciation and amortization |
7,591 | 7,690 | 7,915 | ||||||
| Stock options compensation cost |
89 | 171 | 102 | ||||||
| Loss (gain) on sale of premises and equipment |
104 | (547 | ) | 800 | |||||
| Stock dividends on securities |
(533 | ) | (184 | ) | (212 | ) | |||
| Deferred income taxes |
(799 | ) | (3,876 | ) | (1,360 | ) | |||
| Payments (deposits) for claims in litigation |
6,816 | — | (6,816 | ) | |||||
| Changes in other assets |
(13,446 | ) | (7,735 | ) | (5,001 | ) | |||
| Changes in other liabilities |
150,983 | 502 | 2,437 | ||||||
| Net gains from sale of loans |
(94,353 | ) | (60,483 | ) | (81,442 | ) | |||
| Loans originated for sale |
(2,313,320 | ) | (1,697,516 | ) | (2,217,106 | ) | |||
| Proceeds from loans sold |
2,311,411 | 1,791,418 | 2,352,292 | ||||||
| Net cash provided by operating activities |
102,989 | 64,286 | 80,672 | ||||||
| Investing Activities |
|||||||||
| Proceeds from maturities and principal reductions of securities held to maturity |
4,305 | 7,946 | 18,758 | ||||||
| Proceeds from maturities and principal reductions of securities available for sale |
25,038 | 402,963 | 832,745 | ||||||
| Purchases of securities held to maturity |
(117,287 | ) | (7,171 | ) | (25,964 | ) | |||
| Purchases of securities available for sale |
(100,952 | ) | (408,615 | ) | (834,163 | ) | |||
| Net increase in loans |
(292,610 | ) | (408,577 | ) | (254,413 | ) | |||
| Purchases of premises and equipment and other assets |
(19,154 | ) | (5,653 | ) | (11,372 | ) | |||
| Proceeds from sales of premises and equipment and other real estate owned |
11,055 | 9,339 | 6,355 | ||||||
| Net cash from acquisitions |
3,954 | — | — | ||||||
| Net cash received (paid) for Federal Home Loan Bank and Federal Reserve Bank stock |
1,491 | (17,626 | ) | — | |||||
| Other, net |
(464 | ) | (275 | ) | — | ||||
| Net cash used for investing activities |
(484,624 | ) | (427,669 | ) | (268,054 | ) | |||
| Financing Activities |
|||||||||
| Net increase (decrease) in deposits |
452,872 | (104,706 | ) | 179,158 | |||||
| Net increase (decrease) in short-term borrowings |
(193,108 | ) | 368,082 | 7,003 | |||||
| Net increase (decrease) in treasury tax and loan note option account |
178 | 1,070 | (769 | ) | |||||
| Proceeds from notes payable |
120,150 | 14,900 | 15,450 | ||||||
| Payments on notes payable |
(108,609 | ) | (10,504 | ) | (26,050 | ) | |||
| Proceeds from junior subordinated debentures |
15,464 | — | — | ||||||
| Proceeds from sale of preferred stock |
87,631 | — | — | ||||||
| Proceeds from sale of common stock |
258 | 470 | 1,325 | ||||||
| Dividends paid |
(5,313 | ) | (4,934 | ) | (4,905 | ) | |||
| Other, net |
261 | 415 | 608 | ||||||
| Net cash provided by financing activities |
369,784 | 264,793 | 171,820 | ||||||
| Net decrease in cash and cash equivalents |
(11,851 | ) | (98,590 | ) | (15,562 | ) | |||
| Cash and cash equivalents at beginning of year |
126,422 | 225,012 | 240,574 | ||||||
| Cash and cash equivalents at end of year |
$ 114,571 | $ 126,422 | $ 225,012 | ||||||
| Supplemental Disclosures of Cash Flow Information |
|||||||||
| Cash paid during the year for: |
|||||||||
| Interest |
$ 68,629 | $ 105,486 | $ 85,985 | ||||||
| Income taxes |
$ 14,205 | $ 18,327 | $ 13,527 | ||||||
| Supplemental Schedule of Noncash Activities |
|||||||||
| Conversion of loans to other real estate owned |
$ 17,713 | $ 12,857 | $ 20,395 | ||||||
| Financing provided on sales of other real estate owned |
$ 390 | $ 552 | $ 16,185 | ||||||
| Capital leases |
$ 4,899 | $ — | $ 4,186 | ||||||
| Common stock issued in acquisitions |
$ 57,718 | $ — | $ — | ||||||
See accompanying notes.
F-8
Table of Contents
Index to Financial Statements
PlainsCapital Corporation and subsidiaries
Notes to consolidated financial statements
December 31, 2008
1. Summary of significant accounting and reporting policies
Nature of operations
PlainsCapital Corporation (“PlainsCapital”) is a financial holding company and a bank holding company headquartered in Dallas, Texas, that provides, through its subsidiaries, a broad array of products and services from offices primarily located throughout Texas. In addition to general commercial and consumer banking, other products and services offered include mortgage banking, investment banking, financial advisory services, trust and investment management, merchant banking, leasing, treasury management, and item processing.
Basis of presentation
PlainsCapital owns 100% of the outstanding stock of PlainsCapital Bank (“the Bank”) and PlainsCapital Equity, LLC. PlainsCapital owns a 60.9% interest in Hester Capital Management (“Hester Capital”). The Bank owns 100% of the outstanding stock of PrimeLending, a PlainsCapital Company (“PrimeLending”), PNB Aero Services, Inc., PCB-ARC, Inc. and 90% of the outstanding stock of Plains Financial Corporation (“PFC”). The Bank has a 100% interest in First Southwest Holdings, LLC (“First Southwest”), PlainsCapital Leasing, LLC, and PlainsCapital Securities, LLC, as well as a 51% voting interest in PlainsCapital Insurance Services, LLC.
After the close of business on December 31, 2008, First Southwest Holdings, Inc., a diversified, private investment banking corporation headquartered in Dallas, Texas merged into FSWH Acquisition, LLC, a wholly-owned subsidiary of the Bank. Following the merger, FSWH Acquisition LLC changed its name to First southwest Holdings, LLC. The principal subsidiaries of First Southwest are First Southwest Company (“FSC”), a broker-dealer registered with the Securities and Exchange Commission (“SEC”) and the Financial Industry Regulatory Authority (“FINRA”), First Southwest Asset Management, Inc., a registered investment advisor under the Investment Advisors Act of 1940, and First Southwest Leasing Company. Please see Note 2 for further discussion of the acquisition.
The accompanying consolidated financial statements include the accounts of the above-named entities. All significant intercompany transactions and balances have been eliminated. Noncontrolling interests have been recorded for minority ownership in entities that are not wholly owned.
PlainsCapital also owns 100% of the outstanding stock of PCC Statutory Trusts I, II, III, and IV (“Trusts”), which are not included in the consolidated financial statements under FIN 46(R), Consolidation of Variable Interest Entities, an Interpretation of ARB No. 51 (“FIN 46(R)”), because the primary beneficiaries of the Trusts are not within the consolidated group.
The preparation of financial statements in conformity with accounting principles generally accepted in the United States requires management to make estimates and assumptions that affect the reported amounts of assets and liabilities, the disclosure of contingent assets and liabilities at the date of the financial statements, and the reported amounts of revenues and expenses during the reporting period. Actual results could differ from those estimates.
F-9
Table of Contents
Index to Financial Statements
PlainsCapital Corporation and subsidiaries
Notes to consolidated financial statements (continued)
Common Stock
In August 2009, PlainsCapital shareholders authorized a three-for-one split of PlainsCapital Original Common Stock and a change in the par value of the Original Common Stock from $10 per share to $0.001 per share. The three-for-one stock split became effective August 28, 2009 when PlainsCapital filed its Third Amended and Restated Certificate of Formation with the Texas Secretary of State. PlainsCapital has retrospectively adjusted previously reported share and per share amounts to reflect the stock split and the change in the par value of the original common stock for all periods presented.
Loans held for sale
Loans held for sale consist primarily of single-family residential mortgages funded through PrimeLending. These loans are generally on the consolidated balance sheet for no more than 30 days, until their sale into the secondary market. Substantially all loans originated and intended for sale in the secondary market are carried at fair value under the provisions of Financial Accounting Standards Board (“FASB”) Statement of Financial Accounting Standards (“SFAS”) 159, The Fair Value Option for Financial Assets and Financial Liabilities (“SFAS 159”). Changes in the fair value of the loans held for sale are recognized in earnings and fees and costs associated with origination are recognized as incurred. The specific identification method is used to determine realized gains and losses on sales of loans, which are reported as net gains (losses) in noninterest income. Loans sold are subject to certain indemnification provisions with investors, including the repurchase of loans sold and repayment of certain sales proceeds to investors under certain conditions. The Bank guarantees PrimeLending’s performance with respect to the indemnification provisions included in a purchase agreement with a third party. Historically, such amounts have not been material to PlainsCapital’s consolidated financial position or results of operations. At December 31, 2008, PrimeLending had an accrued liability of $1.2 million under these indemnification provisions.
Securities
Securities that management has the positive intent and ability to hold until maturity are classified as held to maturity. These securities are carried at cost, adjusted for amortization of premiums and accretion of discounts, which are recognized as adjustments to interest income using the interest method over the period to maturity.
Securities to be held for indefinite periods of time and not intended to be held to maturity or on a long-term basis are classified as available for sale. Securities included in this category are those that management intends to use as part of its asset/liability management strategy and that may be sold in response to changes in interest rates, resultant prepayment risk, and other factors related to interest rate and resultant prepayment risk changes. Management classifies securities at the time of purchase and reassesses such designation at each balance sheet date. Transfers between categories from this reassessment are rare. Securities available for sale are carried at fair value. Unrealized holding gains and losses on securities available for sale, net of taxes, are reported in other comprehensive income until realized. Premiums and discounts are recognized in interest income using the interest method over the period to maturity.
F-10
Table of Contents
Index to Financial Statements
PlainsCapital Corporation and subsidiaries
Notes to consolidated financial statements (continued)
Securities held for resale in anticipation of short-term market movements are classified as trading. Trading securities are carried at fair value, with changes in fair value reported in current earnings.
Purchases and sales (and related gain or loss) of securities are recorded on the trade date, based on specific identification.
Prepayments are anticipated on mortgage-backed securities when amortizing premiums and accreting discounts. Future cash flow streams (prepayment rates) are estimated by management after considering recent prepayment history and the current interest rate environment.
Loans
Loans that management has the intent and ability to hold for the foreseeable future or until maturity or payoff are stated at the amount of unpaid principal reduced by unearned income and an allowance for loan losses. Unearned income on installment loans and interest on other loans is recognized using the simple-interest method. Fees received for providing loan commitments and letters of credit that result in loans are deferred and amortized to interest income over the life of the related loan, beginning with the initial borrowing. Fees on commitments and letters of credit that are not expected to be funded are amortized to noninterest income over the commitment period. Income on direct financing leases is recognized on a basis that achieves a constant periodic rate of return on the outstanding investment.
The accrual of interest on impaired loans is discontinued when, in management’s opinion, there is a clear indication that the borrower’s cash flow may not be sufficient to meet payments as they become due, which is generally when a loan is 90 days past due unless the asset is both well secured and in the process of collection. When a loan is placed on nonaccrual status, all previously accrued and unpaid interest is charged against income. If the ultimate collectibility of principal, wholly or partially, is in doubt, any payment received on a loan on which the accrual of interest has been suspended is applied to reduce principal to the extent necessary to eliminate such doubt. Once the collection of the remaining recorded loan balance is fully expected, interest income is recognized on a cash basis.
The Bank originates loans to customers primarily in Dallas, Fort Worth, Arlington, Lubbock, Austin, and San Antonio. PlainsCapital Leasing, LLC provides lease financing to customers primarily throughout Texas and the southern United States. Although the Bank and PlainsCapital Leasing, LLC have diversified loan and leasing portfolios and, generally, hold collateral against amounts advanced to customers, their debtors’ ability to honor their contracts is substantially dependent upon the general economic conditions of the region, which consist primarily of energy, agribusiness, wholesale/retail trade, real estate, health care, and institutions of higher education. PrimeLending originates loans to customers in its offices, which are located primarily throughout Texas and the southern United States. Mortgage loans originated by PrimeLending are sold in the secondary market, servicing released. FSC makes loans to customers through margin transactions. FSC controls risk by requiring customers to maintain margin collateral in compliance with various regulatory and internal guidelines, which may vary based upon market conditions. Securities owned by customers and held as collateral for margin loans are not included in the consolidated financial statements.
F-11
Table of Contents
Index to Financial Statements
PlainsCapital Corporation and subsidiaries
Notes to consolidated financial statements (continued)
Allowance for loan losses
The allowance for loan losses is a reserve established through a provision for loan losses charged to expense, which represents management’s best estimate of probable losses that have been incurred within the existing portfolio of loans. The allowance, in the judgment of management, is necessary to reserve for estimated loan losses inherent in the loan portfolio at the balance sheet date. The allowance for loan losses includes allowance allocations calculated in accordance with SFAS No. 114, Accounting by Creditors for Impairment of a Loan, as amended by SFAS 118, Accounting by Creditors for Impairment of a Loan—Income Recognition and Disclosures, and allowance allocations determined in accordance with SFAS No. 5, Accounting for Contingencies. The level of the allowance reflects management’s continuing evaluation of industry concentrations, specific credit risks, loan loss experience, current loan portfolio quality, present economic, political and regulatory conditions, and unidentified losses inherent in the current loan portfolio. Portions of the allowance may be allocated for specific credits; however, the entire allowance is available for any credit that, in management’s judgment, should be charged off. While management utilizes its best judgment and information available, the ultimate adequacy of the allowance is dependent upon a variety of factors beyond PlainsCapital’s control, including the performance of PlainsCapital’s loan portfolio, the economy, changes in interest rates, and the view of the regulatory authorities toward loan classifications.
PlainsCapital’s allowance for loan losses consists of three elements: (i) specific valuation allowances established for probable losses on specific loans; (ii) historical valuation allowances calculated based on historical loan loss experience for homogenous loans with similar characteristics and trends; and (iii) valuation allowances based on economic conditions and other qualitative risk factors both internal and external to PlainsCapital. Management considers the allowance for loan losses to be a critical accounting policy.
Broker/dealer and clearing organization transactions
Amounts recorded in broker/dealer and clearing organization receivables and payables include securities lending activities, as well as amounts related to securities transactions for either FSC customers or for the account of FSC. Securities-borrowed and securities-loaned transactions are generally reported as collateralized financings except where letters of credit or other securities are used as collateral. Securities-borrowed transactions require FSC to deposit cash, letters of credit, or other collateral with the lender. With respect to securities loaned, FSC receives collateral in the form of cash or other collateral in an amount generally in excess of the market value of securities loaned. FSC monitors the market value of securities borrowed and loaned on a daily basis, with additional collateral obtained or refunded as necessary.
Fee award receivable
In 2005, First Southwest participated in a monetization of future cash flows from several tobacco companies owed to a law firm under a settlement agreement (“Fee Award”). The Fee Award is accounted for in accordance with Statement of Position 03-3, Accounting for Certain Loans or Debt Securities Acquired in a Transfer. First Southwest estimated the amount and timing of the undiscounted expected cash flows from the receivable. The excess of the receivable’s cash flows
F-12
Table of Contents
Index to Financial Statements
PlainsCapital Corporation and subsidiaries
Notes to consolidated financial statements (continued)
expected to be collected over the amount paid is to be accreted into interest income over the remaining life of the receivable (accretable yield). Over the life of the Fee Award, First Southwest will continue to estimate cash flows expected to be collected.
Premises and equipment
Premises and equipment are stated at cost less accumulated depreciation and amortization computed principally on the straight-line method over the estimated useful lives of the assets, which range between 3 and 40 years. Gains or losses on disposals of premises and equipment are included in results of operations.
Other real estate owned
Real estate acquired through foreclosure is included in other real estate owned and is carried at the lower of the recorded loan amount at the time of foreclosure or management’s estimate of fair value less costs to sell. At the time of acquisition, any excess of the recorded loan amount over fair value is charged to the allowance for loan losses. Revenue and expenses from operations, subsequent reductions in fair value and gains and losses on sale are included in repossession and foreclosure expense.
Goodwill
Goodwill, which represents the excess of cost over the fair value of the net assets of an acquired business, is tested for impairment annually or whenever events or changes in circumstances indicate that the carrying amount should be assessed. Impairment, if any, for goodwill is recognized as a permanent charge to noninterest expense. There were no impairment charges in 2008, 2007 or 2006.
Intangibles and other long-lived assets
Intangible assets are acquired assets that lack physical substance but can be distinguished from goodwill because of contractual or other legal rights or because the asset is capable of being sold or exchanged either on its own or in combination with a related contract, asset, or liability. PlainsCapital’s intangible assets relate to core deposits and customer relationships. Intangible assets with definite useful lives are amortized on the straight-line method over their estimated lives. Intangible assets with indefinite useful lives are not amortized until their lives are determined to be definite. Intangible assets, premises and equipment, and other long-lived assets are tested for impairment whenever events or changes in circumstances indicate the carrying amount of the assets may not be recoverable from future undiscounted cash flows. If impaired, the assets are recorded at fair value. There were no impairment charges in 2008, 2007 or 2006.
Derivative financial instruments
PlainsCapital’s hedging policies permit the use of various derivative financial instruments to manage interest rate risk or to hedge specified assets and liabilities. In addition, PrimeLending executes interest rate lock commitments (“IRLCs”) with their customers that allow those customers to make mortgage loans at agreed upon rates. IRLCs meet the definition of a
F-13
Table of Contents
Index to Financial Statements
PlainsCapital Corporation and subsidiaries
Notes to consolidated financial statements (continued)
derivative under the provisions of SFAS No. 133, Accounting for Derivative Instruments and Hedging Activities, as amended and interpreted. Derivatives are recorded at fair value on PlainsCapital’s consolidated balance sheet. To qualify for hedge accounting, derivatives must be highly effective at reducing the risk associated with the exposure being hedged and must be designated as a hedge at the inception of the derivative contract. If derivative instruments are designated as hedges of fair values, the change in the fair value of the both the derivative instrument and the hedged item are included in current earnings. Changes in the fair value of derivatives designated as hedges of cash flows are recorded in other comprehensive income. Actual cash receipts and/or payments and related accruals on derivatives related to hedges are recorded as adjustments to the line item where the hedged item’s effect on earnings is recorded. During the life of the hedge, PlainsCapital formally assesses whether derivatives designated as hedging instruments continue to be highly effective in offsetting changes in the fair value or cash flows of hedged items. If PlainsCapital determines that a hedge has ceased to be highly effective, PlainsCapital will discontinue hedge accounting prospectively. At such time, previous adjustments to the carrying value of the hedged item would be reversed into earnings, amounts recorded in other comprehensive income would be reclassified into earnings and the derivative instrument would be recorded at fair value.
Loss contingencies
Loss contingencies, including claims and legal actions arising in the ordinary course of business, are recorded as liabilities when the likelihood of loss is probable and an amount or range of loss can be reasonably estimated.
Trust fees
Trust fees are recorded on the accrual basis.
Share-based compensation
PlainsCapital and its subsidiaries have four open incentive stock option plans that are described in Note 16. On January 1, 2006, PlainsCapital adopted SFAS No. 123(R), Share-Based Payment, (“SFAS 123(R)”) using the modified-prospective-transition method. Under that transition method, compensation cost recognized beginning in 2006 includes amounts for all share-based payments granted after December 31, 2005, based on the grant-date fair value estimated by application of the provisions of SFAS 123(R).
PlainsCapital’s income before taxes and net income for the year ended December 31, 2006, were $102,285 and $66,485 lower, respectively, than if PlainsCapital had continued to account for share-based compensation under APB 25.
SFAS 123(R) requires that cash flows resulting from the tax benefits that relate to tax deductions in excess of the compensation cost recognized for those options (“excess tax benefits”) be classified as financing cash flows. PlainsCapital has classified $0, $51,409 and $112,593 of excess tax benefits as financing cash flows, in “Other, net”, in the Consolidated Statement of Cash Flows for the years ended December 31, 2008, 2007 and 2006, respectively.
F-14
Table of Contents
Index to Financial Statements
PlainsCapital Corporation and subsidiaries
Notes to consolidated financial statements (continued)
Advertising
Advertising costs are expensed as incurred. Advertising expense totaled approximately $1.1 million, $1.1 million and $1.3 million in 2008, 2007 and 2006, respectively.
Income taxes
The provision for income tax includes taxes currently payable and deferred taxes arising from the difference in basis of assets and liabilities for financial statement and tax purposes. Deferred tax assets and liabilities are reflected at currently enacted income tax rates applicable to the period in which the deferred tax assets or liabilities are expected to be realized or settled. As changes in tax laws or rates are enacted, deferred tax assets and liabilities are adjusted through the income tax provision. PlainsCapital files a consolidated federal income tax return. Interest and penalties incurred related to tax matters are charged to other interest expense or other noninterest expense, as appropriate.
Cash flow reporting
For the purpose of presentation in the consolidated statement of cash flows, cash and cash equivalents are defined as those amounts included in the consolidated balance sheets captions “Cash and due from banks” and “Federal funds sold.” Cash equivalents have original maturities of three months or less.
Assets segregated for regulatory purposes
Under certain conditions, FSC may be required to segregate cash and securities in a special reserve account for the benefit of customers under rule 15c3-3 of the Securities and Exchange Act of 1934 (“the Act”). Assets segregated under the provisions of the Act are not available for general corporate purposes.
Comprehensive income (loss)
PlainsCapital’s comprehensive income (loss) consists of its net income and unrealized holding gains (losses) on its available for sale securities, investments held in trust for the Supplemental Executive Retirement Plan and derivative instruments designated as cash flow hedges.
The components of accumulated other comprehensive income (loss) at December 31, 2008, 2007 and 2006 are shown in the following table (in thousands, net of taxes):
| 2008 | 2007 | 2006 | |||||||
| Unrealized gain (loss) on securities available for sale |
$752 | $(1,886 | ) | $(1,461 | ) | ||||
| Unrealized gain (loss) on securities held in trust for the Supplemental Executive Retirement Plan |
(561 |
) |
561 |
|
565 |
| |||
| Unrealized gain on customer-related cash flow hedges |
140 | 152 | 142 | ||||||
| $331 | $(1,173 | ) | $ (754 | ) | |||||
F-15
Table of Contents
Index to Financial Statements
PlainsCapital Corporation and subsidiaries
Notes to consolidated financial statements (continued)
Reclassification
Certain items in the 2006 and 2007 financial statements have been reclassified to conform to the 2008 presentation.
2. Acquisition
As described in Note 1, First Southwest Holdings, Inc., a diversified, private investment banking corporation headquartered in Dallas, Texas, was merged with and into First Southwest after the close of business December 31, 2008. First Southwest is the surviving entity in the transaction. First Southwest exchanged shares of PlainsCapital common stock for all of the voting equity interests of First Southwest Holdings, LLC. The acquisition provides PlainsCapital with expanded service offerings and increases PlainsCapital’s assets and capital. The operations of First Southwest will be included in PlainsCapital’s consolidated income statement beginning January 1, 2009, while the assets and liabilities of First Southwest are included, at estimated fair value, in the consolidated balance sheet at December 31, 2008, the acquisition date.
The acquisition cost of First Southwest was approximately $60.9 million, composed of approximately 5.1 million shares of PlainsCapital stock valued at $57.7 million and $3.2 million of transaction costs. The value of $11.33 per share of PlainsCapital stock was the product of negotiations between the parties and was supported by a third-party, independent valuation.
In addition, First Southwest has placed approximately 1.7 million shares of PlainsCapital stock, valued at approximately $19.2 million, into escrow. The percentage of shares to be released from escrow and distributed to First Southwest stockholders will be determined based upon the valuation of certain auction rate securities held by First Southwest prior to the merger (or to be repurchased following the closing of the merger) as of the last day of December 2012 or, if applicable, the aggregate sales price of such auction rate securities prior to such date. The release of the escrowed shares will be further adjusted for certain specified losses, if any, during the earnout period and any excess dividend payments. If the value or aggregate sales price, as applicable, of the auction rate securities is less than 80% of the face value of the auction rate securities, no shares will be distributed from escrow to First Southwest stockholders. If the value or aggregate sales price of the auction rate securities falls between 80% and 90% of face value, First Southwest stockholders will receive an increasing portion of the PlainsCapital shares held in escrow. If the value or aggregate sales price of the auction rate securities equals or exceeds 90% of face value, First Southwest stockholders will receive all of the PlainsCapital shares held in escrow. Any shares issued will be accounted for as additional acquisition cost. The auction rate securities held by First Southwest prior to the merger were purchased by the Bank on December 31, 2008, at the closing of the acquisition.
F-16
Table of Contents
Index to Financial Statements
PlainsCapital Corporation and subsidiaries
Notes to consolidated financial statements (continued)
PlainsCapital is using a third-party valuation specialist to assist in the determination of the fair value of assets acquired, including intangibles, and liabilities assumed in the acquisition. Accordingly, the allocation of the purchase price is preliminary and subject to refinement, and may result in the recognition of other identified intangibles. The following table summarizes the estimated fair values of assets acquired and liabilities assumed of First Southwest at December 31, 2008 (in thousands):
| Due from PlainsCapital (principally auction rate securities) |
$152,014 | |
| Loans, net |
125,522 | |
| Broker/dealer and clearing organization receivables |
45,331 | |
| Fee award receivable |
21,544 | |
| Assets segregated for regulatory purposes |
11,500 | |
| Other assets |
38,319 | |
| Total assets acquired |
394,230 | |
| Notes payable |
124,217 | |
| Deposits |
82,079 | |
| Broker/dealer and clearing organization payables |
59,203 | |
| Short-term borrowings |
36,500 | |
| Other liabilities |
26,995 | |
| Total liabilities assumed |
328,994 | |
| Net assets acquired |
$ 65,236 | |
The initial purchase price allocation resulted in net assets acquired in excess of consideration paid of approximately $4.3 million. That amount has been recorded in other liabilities until the contingent consideration issue described previously is settled. The purchase price allocation is based on preliminary valuations which have not been finalized, including valuations of intangible assets and stock option modifications. When completed, the excess of net assets acquired over consideration paid could change. In addition, the resolution of the contingent consideration issue could result in a change of the net asset excess and also could result in recording goodwill from the transaction.
F-17
Table of Contents
Index to Financial Statements
PlainsCapital Corporation and subsidiaries
Notes to consolidated financial statements (continued)
The following table presents unaudited pro forma results of operations for the years ended December 31, 2008 and 2007, calculated as though the acquisition had been completed at the beginning of the respective periods (amounts in thousands, except for per share amounts). These pro forma amounts do not purport to be indicative of actual results that would have occurred if the acquisition had been completed at the beginning of the periods presented, nor of results that may be obtained in the future.
| 2008 | 2007 | |||
| Interest income |
$216,986 | $248,184 | ||
| Interest expense |
83,791 | 123,564 | ||
| Net interest income |
133,195 | 124,620 | ||
| Provision for loan losses |
22,818 | 6,017 | ||
| Net interest income after provision for loan losses |
110,377 | 118,603 | ||
| Noninterest income |
190,295 | 172,327 | ||
| Noninterest expense |
270,535 | 234,106 | ||
| Income before income taxes |
30,137 | 56,824 | ||
| Income tax provision |
9,886 | 19,075 | ||
| Net income |
$ 20,251 | $ 37,749 | ||
| Basic earnings per share |
$ 0.65 | $ 1.21 | ||
3. Securities
The amortized cost and fair value of securities as of December 31, 2008 and 2007 are summarized as follows (in thousands):
| Held to maturity | |||||||||
| Amortized cost |
Gross unrealized gains |
Gross unrealized losses |
Fair value | ||||||
| As of December 31, 2008 |
|||||||||
| U. S. government agencies |
|||||||||
| Mortgage-backed securities |
$ 19,982 | $ 585 | $ — | $ 20,567 | |||||
| Collateralized mortgage obligations |
29,030 | 171 | (116 | ) | 29,085 | ||||
| States and political subdivisions |
168,197 | 474 | (1,304 | ) | 167,367 | ||||
| Totals |
$217,209 | $1,230 | $(1,420 | ) | $217,019 | ||||
| As of December 31, 2007 |
|||||||||
| U. S. government agencies |
|||||||||
| Mortgage-backed securities |
$ 23,026 | $ 398 | $ (203 | ) | $ 23,221 | ||||
| Collateralized mortgage obligations |
29,520 | — | (1,662 | ) | 27,858 | ||||
| States and political subdivisions |
51,953 | 409 | (849 | ) | 51,513 | ||||
| Totals |
$104,499 | $ 807 | $(2,714 | ) | $102,592 | ||||
F-18
Table of Contents
Index to Financial Statements
PlainsCapital Corporation and subsidiaries
Notes to consolidated financial statements (continued)
| Available for sale | |||||||||
| Amortized cost |
Gross unrealized gains |
Gross unrealized losses |
Fair value | ||||||
| As of December 31, 2008 |
|||||||||
| U. S. Treasury securities |
$ 11,920 | $ 33 | $ — | $ 11,953 | |||||
| U. S. government agencies |
|||||||||
| Bonds |
10,000 | 38 | — | 10,038 | |||||
| Mortgage-backed securities |
35,037 | 708 | (306 | ) | 35,439 | ||||
| Collateralized mortgage obligations |
67,848 | 731 | (64 | ) | 68,515 | ||||
| States and political subdivisions |
40,612 | — | — | 40,612 | |||||
| Totals |
$165,417 | $1,510 | $ (370 | ) | $166,557 | ||||
| As of December 31, 2007 |
|||||||||
| U. S. government agencies |
|||||||||
| Bonds |
$ 17,958 | $ 42 | $ — | $ 18,000 | |||||
| Mortgage-backed securities |
36,328 | 126 | (415 | ) | 36,039 | ||||
| Collateralized mortgage obligations |
35,248 | — | (2,611 | ) | 32,637 | ||||
| Totals |
$ 89,534 | $ 168 | $(3,026 | ) | $ 86,676 | ||||
F-19
Table of Contents
Index to Financial Statements
PlainsCapital Corporation and subsidiaries
Notes to consolidated financial statements (continued)
Information regarding securities held by the Bank that were in an unrealized loss position as of December 31, 2008 and 2007, is shown in the following tables (dollar amounts in thousands):
| As of December 31, 2008 | As of December 31, 2007 | |||||||||||
| Number of securities |
Fair value | Unrealized losses |
Number of securities |
Fair value | Unrealized losses | |||||||
| Held to maturity |
||||||||||||
| U. S. government agencies |
||||||||||||
| Mortgage-backed securities |
||||||||||||
| Unrealized loss for less than twelve months |
— | $ — | $ — | — | $ — | $ — | ||||||
| Unrealized loss for more than twelve months |
— | — | — | 2 | 9,052 | 203 | ||||||
| — | — | — | 2 | 9,052 | 203 | |||||||
| Collateralized mortgage obligations |
||||||||||||
| Unrealized loss for less than twelve months |
2 | 1,884 | 102 | 2 | 6,202 | 548 | ||||||
| Unrealized loss for more than twelve months |
1 | 8,885 | 14 | 4 | 21,655 | 1,114 | ||||||
| 3 | 10,769 | 116 | 6 | 27,857 | 1,662 | |||||||
| States and political subdivisions |
||||||||||||
| Unrealized loss for less than twelve months |
60 | 26,836 | 825 | 33 | 13,238 | 451 | ||||||
| Unrealized loss for more than twelve months |
20 | 7,713 | 479 | 27 | 12,120 | 398 | ||||||
| 80 | 34,549 | 1,304 | 60 | 25,358 | 849 | |||||||
| Total held to maturity |
||||||||||||
| Unrealized loss for less than twelve months |
62 | 28,720 | 927 | 35 | 19,440 | 999 | ||||||
| Unrealized loss for more than twelve months |
21 | 16,598 | 493 | 33 | 42,827 | 1,715 | ||||||
| 83 | $45,318 | $1,420 | 68 | $62,267 | $2,714 | |||||||
| Available for sale |
||||||||||||
| U. S. government agencies |
||||||||||||
| Mortgage-backed securities |
||||||||||||
| Unrealized loss for less than twelve months |
— | $ — | $ — | 2 | $ 7,200 | $ 47 | ||||||
| Unrealized loss for more than twelve months |
1 | 4,944 | 306 | 4 | 16,903 | 368 | ||||||
| 1 | 4,944 | 306 | 6 | 24,103 | 415 | |||||||
| Collateralized mortgage obligations |
||||||||||||
| Unrealized loss for less than twelve months |
— | — | — | — | — | — | ||||||
| Unrealized loss for more than twelve months |
6 | 18,233 | 64 | 8 | 32,637 | 2,611 | ||||||
| 6 | 18,233 | 64 | 8 | 32,637 | 2,611 | |||||||
| Total available for sale |
||||||||||||
| Unrealized loss for less than twelve months |
— | — | — | 2 | 7,200 | 47 | ||||||
| Unrealized loss for more than twelve months |
7 | 23,177 | 370 | 12 | 49,540 | 2,979 | ||||||
| 7 | $23,177 | $ 370 | 14 | $56,740 | $3,026 | |||||||
F-20
Table of Contents
Index to Financial Statements
PlainsCapital Corporation and subsidiaries
Notes to consolidated financial statements (continued)
Management has the intention and ability to hold the securities classified as held to maturity until they mature, at which time the Bank will receive full value for the securities. Management also has the ability and intent to hold the securities classified as available for sale for a period of time sufficient for a recovery of cost. As of December 31, 2008 and 2007, the securities included in the table above represented 18% and 63%, respectively, of the fair value of the Bank’s securities portfolio. At December 31, 2008 and 2007, total impairment represented 2.6% and 4.8%, respectively, of the fair value of the underlying securities, and 0.5% and 3.0%, respectively, of the fair value of the Bank’s securities portfolio. As of December 31, 2008, management believes the impairments detailed in the table are temporary and relate to changes in interest rates. Accordingly, no other-than-temporary impairment loss has been recognized in PlainsCapital’s consolidated statements of income.
The amortized cost and fair value of securities held to maturity and securities available for sale by contractual maturity as of December 31, 2008, is shown below (in thousands).
| Securities held to maturity | Securities available for sale | |||||||
| Amortized cost |
Fair value | Amortized cost |
Fair value | |||||
| Due in one year or less |
$ 1,305 | $ 1,330 | $ 11,920 | $ 11,953 | ||||
| Due after one year through five years |
2,488 | 2,629 | 10,000 | 10,038 | ||||
| Due after five years through ten years |
12,494 | 12,556 | — | — | ||||
| Due after ten years |
151,910 | 150,852 | 40,612 | 40,612 | ||||
| 168,197 | 167,367 | 62,532 | 62,603 | |||||
| Mortgage-backed securities |
19,982 | 20,567 | 35,037 | 35,439 | ||||
| Collateralized mortgage obligations |
29,030 | 29,085 | 67,848 | 68,515 | ||||
| $217,209 | $217,019 | $165,417 | $166,557 | |||||
The Bank did not sell securities in 2008 or 2007.
Securities with a carrying amount of approximately $231.1 million and $181.8 million (fair value of approximately $232.0 million and $177.2 million) at December 31, 2008 and 2007, respectively, were pledged to secure public and trust deposits, federal funds purchased and securities sold under agreements to repurchase, and for other purposes as required or permitted by law. In addition, the Bank had secured a letter of credit from the Federal Home Loan Bank (FHLB) in the amount of $150 million and $100 million at December 31, 2008 and 2007, respectively, in lieu of pledging securities to secure certain public deposits.
Mortgage-backed securities and collateralized mortgage obligations consist principally of Government National Mortgage Association (“GNMA”), Federal National Mortgage Association (“FNMA”), and Federal Home Loan Mortgage Corporation (“FHLMC”) pass-through and participation certificates. GNMA securities are guaranteed by the full faith and credit of the United States, while FNMA and FHLMC securities are fully guaranteed by those respective United States government-sponsored agencies, and conditionally guaranteed by the full faith and credit of the United States government.
F-21
Table of Contents
Index to Financial Statements
PlainsCapital Corporation and subsidiaries
Notes to consolidated financial statements (continued)
4. Loans and allowance for loan losses
Loans summarized by category as of December 31, 2008 and 2007, are as follows (in thousands):
| 2008 | 2007 | |||||
| Commercial and industrial |
$1,262,456 | $1,028,332 | ||||
| Lease financing |
101,902 | 148,780 | ||||
| Construction and land development |
585,320 | 704,321 | ||||
| Real estate |
839,099 | 678,618 | ||||
| Securities (primarily margin loans) |
129,638 | 4,696 | ||||
| Consumer |
51,091 | 36,082 | ||||
| 2,969,506 | 2,600,829 | |||||
| Unearned income |
(3,887 | ) | (3,467 | ) | ||
| Allowance for loan losses |
(40,672 | ) | (26,517 | ) | ||
| $2,924,947 | $2,570,845 | |||||
Impaired (nonaccrual) loans totaled approximately $46.8 million and $17.2 million at December 31, 2008 and 2007, respectively. At December 31, 2008, an allowance for loan loss of approximately $23.7 million was associated with $44.7 million of impaired loans. At December 31, 2007, an allowance for loan loss of approximately $4.5 million was associated with $13.8 million of impaired loans. The average balance of impaired loans in 2008, 2007 and 2006 was approximately $35.3 million, $15.5 million and $8.6 million, respectively. Interest income recorded on impaired loans in 2008, 2007 and 2006 was nominal.
At December 31, 2008, the Bank had real estate loans of approximately $2.4 million and commercial loans of $1.2 million that were more than 90 days past due, but upon which the Bank continued to accrue interest. Accrued interest receivable on these loans at December 31, 2008, was $0.1 million. Subsequent to December 31, 2008, the Bank reclassified $2.9 million of the loans to nonaccrual status. The Bank has received payments on the remaining $0.7 million of loans and has removed the loans from past due status.
PlainsCapital Leasing, LLC’s net investment in lease financing at December 31, 2008 and 2007 is shown in the following table (in thousands).
| 2008 | 2007 | |||||
| Future minimum lease payments |
$110,405 | $164,312 | ||||
| Unguaranteed residual value |
369 | 979 | ||||
| Guaranteed residual value |
2,768 | 3,256 | ||||
| Initial direct costs, net of amortization |
589 | 1,131 | ||||
| Unearned income |
(12,229 | ) | (20,898 | ) | ||
| $101,902 | $148,780 | |||||
F-22
Table of Contents
Index to Financial Statements
PlainsCapital Corporation and subsidiaries
Notes to consolidated financial statements (continued)
PlainsCapital Leasing, LLC expects to receive future minimum lease payments in 2009 through 2013 and in the aggregate thereafter as follows (in thousands).
| 2009 |
$ 47,334 | |
| 2010 |
33,402 | |
| 2011 |
18,450 | |
| 2012 |
7,704 | |
| 2013 |
3,053 | |
| Thereafter |
462 | |
| $110,405 | ||
At December 31, 2008, PlainsCapital Leasing, LLC had lease financing receivables of approximately $0.3 million that were more than 90 days past due, but upon which PlainsCapital Leasing, LLC continued to accrue interest. Accrued interest receivable on the loans at December 31, 2008, was less than $50,000. Subsequent to December 31, 2008, $0.2 million of these leases are current, while the remaining $0.1 million of the leases continue to be 90 days past due.
Changes in the allowance for loan losses for the years ended December 31, 2008, 2007 and 2006 were as follows (in thousands):
| 2008 | 2007 | 2006 | |||||||
| Balance at beginning of year |
$26,517 | $24,722 | $22,666 | ||||||
| Provision charged to operations |
22,818 | 5,517 | 5,049 | ||||||
| Loans charged-off |
(11,658 | ) | (5,152 | ) | (3,855 | ) | |||
| Recoveries on charged-off loans |
1,715 | 1,430 | 862 | ||||||
| Additions due to acquisition |
1,280 | — | — | ||||||
| Balance at end of year |
$40,672 | $26,517 | $24,722 | ||||||
The amount on the line captioned “Additions due to acquisition” is the amount of the allowance for loan losses for First Southwest at December 31, 2008. The acquisition of First Southwest is described in Note 2.
5. Premises and equipment
The cost and accumulated depreciation and amortization of premises and equipment at December 31, 2008 and 2007, respectively, are summarized as follows (in thousands):
| 2008 | 2007 | |||||
| Land and premises |
$ 48,159 | $ 41,067 | ||||
| Furniture and equipment |
81,482 | 57,717 | ||||
| 129,641 | 98,784 | |||||
| Less accumulated depreciation and amortization |
(72,305 | ) | (55,461 | ) | ||
| $ 57,336 | $ 43,323 | |||||
F-23
Table of Contents
Index to Financial Statements
PlainsCapital Corporation and subsidiaries
Notes to consolidated financial statements (continued)
The amounts shown above include assets recorded under capital leases of $8.3 million and $3.8 million, net of accumulated amortization of $1.2 million and $0.7 million at December 31, 2008 and 2007, respectively.
Occupancy expense was reduced by rental income of approximately $0.4 million, $0.4 million and $0.5 million in 2008, 2007 and 2006, respectively. Depreciation and amortization expense on premises and equipment, which includes amortization of capital leases, amounted to $7.0 million, $7.0 million and $7.4 million in 2008, 2007 and 2006, respectively.
6. Goodwill and other intangible assets
The changes in the carrying amount of goodwill as of December 31, 2008 and 2007 are summarized as follows (in thousands):
| 2008 | 2007 | |||||
| Balance at beginning of year |
$37,107 | $36,679 | ||||
| Tax benefit related to earnout payments |
(621 | ) | — | |||
| Additions from minority interest acquisition, net |
— | 472 | ||||
| Other, net |
— | (44 | ) | |||
| $36,486 | $37,107 | |||||
PlainsCapital acquired PrimeLending in a 2000 transaction that included an earnout provision. A portion of the earnout payments were deductible interest expense for federal income tax purposes and reduced the goodwill originally recorded with respect to the earnout payments.
Other intangible assets at December 31, 2008, were as follows (in thousands):
| Gross intangible assets |
Accumulated amortization |
Net intangible assets | |||||
| Core deposits |
$ 520 | $ (438 | ) | $82 | |||
| Noncompete agreements |
10 | (10 | ) | — | |||
| Customer relationships |
913 | (913 | ) | — | |||
| $1,443 | $ (1,361 | ) | $82 | ||||
Other intangible assets at December 31, 2007, were as follows (in thousands):
| Gross intangible assets |
Accumulated amortization |
Net intangible assets | ||||
| Core deposits |
$ 520 | $ (365) | $155 | |||
| Noncompete agreements |
10 | (10) | — | |||
| Customer relationships |
913 | (868) | 45 | |||
| $ 1,443 | $(1,243) | $200 | ||||
F-24
Table of Contents
Index to Financial Statements
PlainsCapital Corporation and subsidiaries
Notes to consolidated financial statements (continued)
Other intangible assets are amortized on the straight-line method over their estimated lives, which range from 7 to 8 years. Amortization expense related to intangible assets for the years ended December 31, 2008, 2007 and 2006 was $0.1 million, $0.3 million and $0.3 million, respectively. The estimated aggregate future amortization expense for intangible assets remaining as of December 31, 2008, is as follows (in thousands):
| 2009 |
$73 | |
| 2010 |
9 | |
| $82 | ||
7. Deposits
Deposits at December 31, 2008 and 2007 are summarized as follows (in thousands):
| 2008 | 2007 | |||
| Noninterest-bearing demand |
$ 194,901 | $ 480,052 | ||
| Interest-bearing: |
||||
| NOW accounts |
43,753 | 244,738 | ||
| Money market |
970,477 | 314,942 | ||
| Demand |
65,291 | — | ||
| Savings |
151,341 | 175,253 | ||
| In foreign branches |
136,454 | 367,927 | ||
| Time—$100,000 and over |
567,149 | 490,542 | ||
| Time—brokered |
564,378 | 74,217 | ||
| Time—other |
232,355 | 245,683 | ||
| $2,926,099 | $2,393,354 | |||
At December 31, 2008, the scheduled maturities of interest-bearing time deposits are as follows (in thousands):
| 2009 |
$1,169,639 | |
| 2010 |
54,476 | |
| 2011 |
22,683 | |
| 2012 |
111,282 | |
| 2013 and thereafter |
5,802 | |
| $1,363,882 | ||
F-25
Table of Contents
Index to Financial Statements
PlainsCapital Corporation and subsidiaries
Notes to consolidated financial statements (continued)
8. Short-term borrowings
Short-term borrowings at December 31, 2008 and 2007 were as follows (in thousands):
| 2008 | 2007 | |||
| Federal funds purchased |
$165,125 | $116,475 | ||
| Securities sold under agreements to repurchase |
73,327 | 46,585 | ||
| Federal Home Loan Bank (FHLB) notes |
— | 250,000 | ||
| Short-term bank loans |
18,000 | — | ||
| $256,452 | $413,060 | |||
Federal funds purchased and securities sold under agreements to repurchase generally mature daily, on demand, or on some other short-term basis. The Bank and FSC execute transactions to sell securities under agreements to repurchase with both their customers and broker/dealers. Securities involved in these transactions are held by the Bank, FSC, or the dealer. Information concerning federal funds purchased and securities sold under agreements to repurchase for the periods ended December 31, 2008 and 2007 is shown in the following table (dollar amounts in thousands):
| 2008 | 2007 | |||
| Average balance during the year |
$192,296 | $ 86,411 | ||
| Average interest rate during the year |
1.90% | 4.67% | ||
| Maximum month-end balance during the year |
$266,077 | $163,060 | ||
| Securities underlying the agreements at year-end |
||||
| Carrying value |
$ 54,394 | $ 60,630 | ||
| Estimated fair value |
$ 54,684 | $ 58,243 | ||
FHLB notes mature over terms not exceeding 30 days and are secured by FHLB Dallas stock, nonspecified real estate loans, and certain specific commercial real estate loans. No FHLB notes were outstanding at December 31, 2008. The weighted average interest rate on the FHLB notes at December 31, 2007 was 4.18%.
First Southwest uses short-term bank loans periodically to finance securities owned, customers’ margin accounts, and other shorter operating activities. Interest on the borrowings varies with the federal funds rate. The weighted average interest rate on the borrowings at December 31, 2008 was 1.19%.
F-26
Table of Contents
Index to Financial Statements
PlainsCapital Corporation and subsidiaries
Notes to consolidated financial statements (continued)
9. Notes payable
Notes payable at December 31, 2008 and 2007, consisted of the following (balances in thousands):
| 2008 | 2007 | |||
| Federal Home Loan Bank Dallas advances |
$ 1,647 | $ 1,756 | ||
| Revolving credit line with JPMorgan Chase not to exceed $20,000,000. Facility matures August 1, 2009, with interest payable quarterly |
18,000 | 6,500 | ||
| Revolving credit line with JPMorgan Chase not to exceed $10,000,000. Advances under the facility are related to PlainsCapital Equity, LLC. Facility matures October 31, 2009, with interest payable quarterly |
7,650 | 7,000 | ||
| Term note with JPMorgan Chase, due September 1, 2009, with interest payable semi-annually |
4,000 | 4,500 | ||
| Term note with JPMorgan Chase, due October 27, 2013, with interest payable quarterly |
500 | 500 | ||
| Subordinated note with JPMorgan Chase, not to exceed $20,000,000. Facility matures October 27, 2013 with interest payable quarterly |
20,000 | 20,000 | ||
| First Southwest nonrecourse notes, due January 25, 2035 with interest payable quarterly |
20,597 | — | ||
| Other First Southwest notes payable |
78,620 | — | ||
| $151,014 | $40,256 | |||
The revolving credit facilities maturing in August 2009 and October 2009, and the term notes due September 2009 and October 2013 bear interest at the JPMorgan Chase Prime Rate (“Prime Rate”) minus 0.75% (2.50% at December 31, 2008). These debt instruments are collateralized by the outstanding stock of the Bank.
Advances under the subordinated note maturing in October 2013 bear interest at LIBOR plus 2.50% or, in the alternative, Prime minus 0.25%. The subordinated note is not collateralized. The rate on each of the outstanding advances under the subordinated note at December 31, 2008 was 3.00% (Prime Rate-based).
The agreements underlying the JPMorgan Chase debt include certain restrictive covenants, including limitations on the ability to incur additional debt, limitations on the disposition of assets, and requirements to maintain various financial ratios at acceptable levels. In the opinion of management, PlainsCapital was in compliance with these covenants at December 31, 2008.
In 2005, First Southwest participated in a monetization of future cash flows totaling $95.3 million from several tobacco companies owed to a law firm under a settlement agreement (“Fee Award”). In connection with the transaction, a special purpose entity that is consolidated with First Southwest under the provisions of FIN 46(R) issued $30.3 million of nonrecourse notes to finance the purchase of the Fee Award, the establishment of a reserve account and issuance costs. Cash flows from the settlement are the sole source of payment for the notes. The notes carry an interest rate of 8.58% that can increase to 10.08% under certain credit conditions.
F-27
Table of Contents
Index to Financial Statements
PlainsCapital Corporation and subsidiaries
Notes to consolidated financial statements (continued)
At the closing of the acquisition described in Note 2, First Southwest had $78.6 million of notes payable that financed the auction rate securities First Southwest held prior to the acquisition. First Southwest used the proceeds received from the sale of the auction rate securities to the Bank, as discussed in Note 2, to retire the notes payable in January 2009.
The following table summarizes information concerning FHLB Dallas advances in 2008 and 2007 (dollar amounts in thousands):
| 2008 | 2007 | |||
| Balance outstanding at year-end |
$ 1,647 | $ 1,756 | ||
| Average interest at year-end |
4.15% | 4.15% | ||
| Maximum month-end balance during the year |
$101,729 | $ 1,851 | ||
| Average balance during the year |
$ 51,970 | $ 1,804 | ||
| Average interest rate during the year |
1.82% | 4.15% | ||
FHLB Dallas advances are collateralized by FHLB Dallas stock, nonspecified real estate loans, and certain specific commercial real estate loans. At December 31, 2008, the Bank had available collateral of $636.9 million, including blanket collateral of $631.8 million and specified collateral of $5.1 million.
Scheduled maturities for notes payable outstanding at December 31, 2008, are as follows (in thousands):
| JPMorgan chase revolving lines |
JPMorgan chase subordinated and term notes |
FHLB advances |
First Southwest notes |
Total | ||||||
| 2009 |
$25,650 | $ 4,000 | 113 | 78,620 | $108,383 | |||||
| 2010 |
— | — | 1,534 | — | 1,534 | |||||
| 2011 |
— | — | — | — | — | |||||
| 2012 |
— | — | — | — | — | |||||
| 2013 and thereafter |
— | 20,500 | — | 20,597 | 41,097 | |||||
| $25,650 | $24,500 | $1,647 | $99,217 | $151,014 | ||||||
10. Junior subordinated debentures and trust preferred securities
PlainsCapital has four Statutory Trusts, three of which were formed under the laws of the state of Connecticut and the fourth, PCC Statutory Trust IV, which was formed in February 2008 under the laws of the state of Delaware. The Trusts were created for the sole purpose of issuing and selling preferred securities and common securities, using the resulting proceeds to acquire junior subordinated debentures (the debentures) issued by PlainsCapital. Accordingly, the debentures are the sole assets of the Trusts, and payments under the debentures are the sole revenue of the Trusts. All of the common securities are owned by PlainsCapital; however, PlainsCapital is not the primary beneficiary of the Trusts. Accordingly, the Trusts are not included in PlainsCapital’s consolidated financial statements.
F-28
Table of Contents
Index to Financial Statements
PlainsCapital Corporation and subsidiaries
Notes to consolidated financial statements (continued)
The Trusts have issued $65,000,000 of floating rate preferred securities and $2,012,000 of common securities and have invested the proceeds from the securities in floating rate debentures of PlainsCapital. Information regarding the PlainsCapital debentures is shown in the following table (amounts in thousands):
| Investor | Issue date | Amount | ||
| PCC Statutory Trust I |
July 31, 2001 | $18,042 | ||
| PCC Statutory Trust II |
March 26, 2003 | $18,042 | ||
| PCC Statutory Trust III |
September 17, 2003 | $15,464 | ||
| PCC Statutory Trust IV |
February 22, 2008 | $15,464 | ||
The stated term of the debentures is 30 years with interest payable quarterly. The rate on the debentures, which resets quarterly, is 3-month LIBOR plus an average spread of 3.22%. The total average interest rate at December 31, 2008 was 5.43%. The term, rate and other features of the preferred securities are the same as the debentures. PlainsCapital’s obligations under the debentures and related documents, taken together, constitute a full and unconditional guarantee of the Trust’s obligations under the preferred securities.
11. Income taxes
The income tax provision for 2008, 2007 and 2006 includes the following components (in thousands):
| 2008 | 2007 | 2006 | |||||||
| Current provision |
$13,524 | $18,780 | $14,984 | ||||||
| Deferred income taxes |
(799 | ) | (3,876 | ) | (1,360 | ) | |||
| $12,725 | $14,904 | $13,624 | |||||||
The differences between income taxes computed using the statutory federal income tax rate and that shown in the consolidated statement of income for 2008, 2007 and 2006 are summarized as follows (in thousands):
| 2008 | 2007 | 2006 | |||||||
| Computed tax at federal statutory rate |
$12,897 | $15,224 | $13,777 | ||||||
| Increase (decrease) in taxes resulting from: |
|||||||||
| Life insurance |
(249 | ) | (270 | ) | (269 | ) | |||
| Tax-exempt income, net |
(763 | ) | (563 | ) | (394 | ) | |||
| Provision for Internal Revenue Service matter |
— | 1,406 | 500 | ||||||
| Franchise tax credit |
— | (1,110 | ) | — | |||||
| Miscellaneous items |
840 | 217 | 10 | ||||||
| $12,725 | $14,904 | $13,624 | |||||||
PlainsCapital adopted the provisions of FASB Interpretation No. 48, Accounting for Uncertainty in Income Taxes, an interpretation of FASB Statement 109 (“FIN 48”) on January 1, 2008. FIN 48
F-29
Table of Contents
Index to Financial Statements
PlainsCapital Corporation and subsidiaries
Notes to consolidated financial statements (continued)
prescribes a recognition threshold and a measurement attribute for the financial statement recognition and measurement of a tax position taken or expected to be taken in a tax return. Benefits from tax positions should be recognized in the financial statements only when it is more likely than not that the tax position will be sustained upon examination by the appropriate taxing authority that would have full knowledge of all relevant information. A tax position that meets the more-likely-than-not recognition threshold is measured at the largest amount of cumulative benefit that is greater than fifty percent likely of being realized upon ultimate settlement. Tax positions that previously failed to meet the more-likely-than-not recognition threshold should be recognized in the first subsequent financial reporting period in which that threshold is met. Previously recognized tax positions that no longer meet the more-likely-than-not recognition threshold should be derecognized in the first subsequent financial reporting period in which that threshold is no longer met. FIN 48 also provides guidance on the accounting for and disclosure of unrecognized tax benefits, interest and penalties. Adoption of FIN 48 did not have a significant effect on PlainsCapital’s financial position, results of operations or cash flows.
PlainsCapital files income tax returns in the U.S. federal jurisdiction and several U.S. state jurisdictions. PlainsCapital is no longer subject to U.S. federal income tax examinations by tax authorities for years before 2005.
The components of the net deferred tax asset included in other assets at December 31, 2008 and 2007 are summarized as follows (in thousands):
| 2008 | 2007 | |||||
| Deferred tax assets |
||||||
| Allowance for loan losses |
$14,235 | $9,281 | ||||
| Net other comprehensive loss |
— | 601 | ||||
| Loan fees |
1,289 | 1,211 | ||||
| Franchise tax credit |
1,085 | 1,110 | ||||
| Other |
4,515 | 1,873 | ||||
| 21,124 | 14,076 | |||||
| Deferred tax liabilities |
||||||
| Premises and equipment |
(3,807 | ) | (2,635 | ) | ||
| Net other comprehensive income |
(174 | ) | — | |||
| Leases |
(3,316 | ) | (3,093 | ) | ||
| (7,297 | ) | (5,728 | ) | |||
| Net deferred tax assets before valuation allowance for deferred tax assets |
13,827 | 8,348 | ||||
| Valuation allowance for deferred tax assets |
— | — | ||||
| Net deferred tax assets |
$13,827 | $8,348 | ||||
Deferred tax assets at December 31, 2008, include $5.5 million associated with the acquisition of First Southwest.
F-30
Table of Contents
Index to Financial Statements
PlainsCapital Corporation and subsidiaries
Notes to consolidated financial statements (continued)
The Internal Revenue Service (“IRS”) examined the federal income tax returns for 1994 to 2000 of a partnership in which PFC has an ownership interest and proposed adjustments. In January 2006, PlainsCapital filed suit in the Federal Court of Claims regarding the proposed adjustments and in February 2008, PlainsCapital and the IRS agreed to a settlement. PlainsCapital was required to deposit approximately $6.8 million with the Court as part of its suit and had accrued the full amount due the IRS of approximately $7.4 million as of December 31, 2007.
During 2006 and 2007, the state of Texas amended its franchise tax law, which became effective on January 1, 2007. The transition provision allowed PlainsCapital to convert unused, unexpired Texas state net operating losses incurred under the previous franchise tax law into a tax credit that may be used to offset future tax liabilities over the next twenty years. The tax credit is $1.1 million, net of federal taxes, and was recorded as a deferred tax benefit in 2007.
12. Employee benefits
PlainsCapital and subsidiaries have a benefit plan that provides for elective deferrals by employees under Section 401(k) of the Internal Revenue Code. Employee contributions are determined by the level of employee participation and related salary levels per IRS regulations. PlainsCapital and subsidiaries match employee contributions to the plan based on the level of normal operating earnings and the amount of eligible employees’ contributions and salaries. The amount charged to operating expense for this matching contribution totaled $1.0 million in 2008, $0.6 million in 2007 and $0.8 million in 2006.
In September 2004, PlainsCapital established an Employee Stock Ownership Plan (“ESOP”). Employees of PlainsCapital are eligible to participate in the ESOP, and employees of PlainsCapital subsidiaries are also eligible to participate if their respective subsidiary has elected to do so. Contributions by participating employers to the ESOP are discretionary. The ESOP may borrow money to purchase shares of PlainsCapital. As contributions are made to the ESOP, and any debt is repaid, shares are released for allocation to participant accounts on a pro rata basis to the repayment of associated debt.
At December 31, 2008, the ESOP owned 1,721,088 shares of PlainsCapital stock, including 320,712 shares that are unearned. The fair value of the unearned shares was $3.6 million ($11.33 per share). At December 31, 2007, the ESOP owned 1,721,853 shares of PlainsCapital stock, including 366,915 shares that were unearned. The fair value of the unearned shares at December 31, 2007 was $5.1 million ($14 per share).
For the years ended December 31, 2008, 2007 and 2006, interest expense on ESOP debt was $0.2 million, $0.3 million and $0.4 million, respectively. During the same periods, the ESOP received approximately $36,000, $49,000 and $56,000 of dividends that were used for debt service. PlainsCapital and participating subsidiaries contributed $1.4 million, $1.2 million and $1.1 million to the ESOP for the years ended December 31, 2008, 2007 and 2006, respectively. PlainsCapital charges contributions to operating expense.
The Bank has a Supplemental Executive Retirement Plan to provide additional benefits for certain key officers. Pursuant to the plan, the Bank is obligated to pay each participant or his beneficiaries a lump sum at such participant’s retirement, death, or disability. The estimated cost
F-31
Table of Contents
Index to Financial Statements
PlainsCapital Corporation and subsidiaries
Notes to consolidated financial statements (continued)
of the plan is being accrued over the period of active employment of the participants. PlainsCapital adopted the plan in 2001. As of December 31, 2008 and 2007, $5.7 million and $5.0 million, respectively, had been accrued as a liability for benefits payable under the plan. The amount charged to operations in 2008, 2007 and 2006 was $0.7 million, $0.6 million and $0.6 million, respectively. Benefit accruals are funded annually in a Rabbi Trust in the first quarter following year-end. The assets of the Rabbi Trust consist primarily of marketable equity securities. As of December 31, 2008 and 2007, the assets of the Rabbi Trust are included in other assets at a book value of $4.7 million and $4.3 million, respectively.
The Bank purchased $15 million of flexible premium universal life insurance in 2001 to help finance the annual expense incurred in providing various employee benefits. Insurance policies are with Jefferson Pilot and Mass Mutual. As of December 31, 2008 and 2007, the carrying value of the policies included in other assets was $19.8 million and $19.0 million, respectively. For the years ended December 31, 2008, 2007 and 2006, the Bank recorded income of $0.8 million, $0.7 million, and $0.7 million related to the policies that was reported in other noninterest income.
13. Related party transactions
In the ordinary course of business, the Bank has granted loans to certain directors, executive officers, and their affiliates (collectively referred to as related parties) totaling $36.8 million at December 31, 2008 and $41.3 million at December 31, 2007. These loans were made on substantially the same terms, including interest rates and collateral, as those prevailing at the time for comparable transactions with other unaffiliated persons and do not involve more than normal risk of collectibility. During 2008, total principal additions were $30.3 million and total principal payments were $34.8 million.
At December 31, 2008, the Bank held deposits of related parties of approximately $53.0 million.
As discussed in Note 5, the Bank had recorded assets under capital leases of $8.3 million and $3.8 million, net of accumulated amortization of $1.2 million and $0.7 million at December 31, 2008 and 2007, respectively. A related party is the lessor in those capital leases. The Bank has granted a loan to the related party, the amount of which is included in the amounts shown above.
PlainsCapital Equity, LLC (PCE) is a limited partner in certain limited partnerships which have received loans from the Bank. The Bank made those loans in the normal course of business, using underwriting standards and offering terms that are substantially the same as those used or offered to non-affiliated borrowers. At December 31, 2008 and 2007, the Bank had outstanding loans of approximately $27.3 million and $8.3 million to limited partnerships in which PCE had a limited partnership interest. The investment of PCE in these limited partnerships was $3.6 million and $2.7 million at December 31, 2008 and 2007, respectively.
14. Commitments and contingencies
The Bank acts as agent on behalf of certain correspondent banks in the purchase and sale of federal funds that aggregated zero and $39.9 million at December 31, 2008 and 2007, respectively.
F-32
Table of Contents
Index to Financial Statements
PlainsCapital Corporation and subsidiaries
Notes to consolidated financial statements (continued)
Legal matters
FSC has received subpoenas from the SEC and the Department of Justice (“DOJ”) in connection with an investigation of possible antitrust and securities law violation, including bid-rigging, in the procurement of guaranteed investment contracts and other investment products for the reinvestment of bond proceeds by municipalities. The investigation is industry-wide and includes approximately 30 or more firms, including some of the largest U.S. investment firms. FSC is cooperating with these investigations.
As a result of these investigations, FSC has been named as a co-defendant in a series of class action lawsuits and in some lawsuits brought by individual municipalities which seek to attach themselves based upon the SEC and DOJ investigation.
As part of an industry-wide inquiry by FINRA into sales practices related to auction rate bonds, FSC executed a term sheet in 2008 in which it agreed to pay a fine and buy back $41.6 million of auction rate bonds at par from a defined class of customers. The fine was paid in 2008 and the auction rate bonds were purchased from the customers in February 2009. FSC has recorded a liability of $3.8 million as of December 31, 2008 representing the loss relating to this settlement.
PlainsCapital and subsidiaries are defendants in various other legal matters arising in the normal course of business. Management believes that the ultimate liability, if any, arising from these matters will not materially affect the consolidated financial statements.
Other contingencies
PlainsCapital and its subsidiaries have entered into employment contracts with certain executive officers. The contracts provide for minimum annual salaries and additional compensation in the form of bonuses based on performance. The contracts originated at various dates, and some contain self-renewing terms of three years, subject to the option of PlainsCapital or the executive not to renew. The minimum aggregate commitment for future salaries, excluding bonuses, under these contracts at December 31, 2008, is approximately $4.8 million. These employment contracts also provide severance pay benefits if there is a change in control of PlainsCapital. PlainsCapital and subsidiaries have separate severance agreements with certain other senior officers that provide severance pay benefits if there is a change in control. The severance agreements with the other senior officers contain self-renewing terms of two years subject to the option of PlainsCapital or the officer not to renew. At December 31, 2008, the aggregate contingent liability for severance pay benefits in the event of a change in control is approximately $27.6 million.
F-33
Table of Contents
Index to Financial Statements
PlainsCapital Corporation and subsidiaries
Notes to consolidated financial statements (continued)
PlainsCapital and its subsidiaries lease space, primarily for branch facilities and automatic teller machines, under noncancelable operating leases with remaining terms, including renewal options, of 1 to 20 years and under capital leases with remaining terms of 13 to 20 years. Future minimum payments by year and in the aggregate under these leases are as follows at December 31, 2008 (in thousands):
| Operating leases | Capital leases | ||||
| 2009 |
$13,152 | $ 715 | |||
| 2010 |
12,927 | 715 | |||
| 2011 |
11,286 | 725 | |||
| 2012 |
9,440 | 753 | |||
| 2013 |
7,612 | 778 | |||
| Thereafter |
28,462 | 9,287 | |||
| Total minimum lease payments |
$82,879 | 12,973 | |||
| Amount representing interest |
(4,322 | ) | |||
| Present value of minimum lease payments |
$ 8,651 | ||||
Rental expense under the operating leases was approximately $10.2 million, $8.7 million and $9.5 million in 2008, 2007 and 2006, respectively.
15. Financial instruments with off-balance sheet risk
The Bank and PrimeLending are parties to financial instruments with off-balance sheet risk in the normal course of business to meet the financing needs of their customers. These financial instruments include commitments to extend credit and standby letters of credit which involve varying degrees of credit and interest rate risk in excess of the amount recognized in the consolidated financial statements. Such financial instruments are recorded in the financial statements when they are funded or related fees are incurred or received. The contract amounts of those instruments reflect the extent of involvement (and therefore the exposure to credit loss) the Bank and PrimeLending have in particular classes of financial instruments.
Commitments to extend credit are agreements to lend to a customer provided that the terms established in the contract are met. Commitments generally have fixed expiration dates and may require payment of fees. Since some commitments are expected to expire without being drawn upon, the total commitment amounts do not necessarily represent future cash requirements. Standby letters of credit are conditional commitments issued to guarantee the performance of a customer to a third party. These guarantees are primarily issued to support public and private borrowing arrangements. The credit risk involved in issuing letters of credit is essentially the same as that involved in extending loan commitments to customers.
The Bank and PrimeLending had outstanding unused commitments to extend credit of $888.1 million at December 31, 2008. The Bank had outstanding standby letters of credit of $38.1 million at December 31, 2008.
The companies use the same credit policies in making commitments and standby letters of credit as they do for on-balance sheet instruments. The amount of collateral obtained, if deemed
F-34
Table of Contents
Index to Financial Statements
PlainsCapital Corporation and subsidiaries
Notes to consolidated financial statements (continued)
necessary, upon extension of credit is based on management’s credit evaluation of the borrower. Collateral held varies but may include real estate, accounts receivable, marketable securities, interest-bearing deposit accounts, inventory, and property, plant, and equipment.
In the normal course of business, First Southwest executes, settles, and finances various securities transactions that may expose First Southwest to off-balance sheet risk in the event that a customer or counterparty does not fulfill its contractual obligations. Examples of such transactions include the sale of securities not yet purchased by customers or for the account of First Southwest, clearing agreements between First Southwest and various clearinghouses and broker/dealers, secured financing arrangements that involve pledged securities, and when-issued underwriting and purchase commitments.
16. Stock-based compensation
PlainsCapital and subsidiaries have four open incentive stock option plans that provide for the granting of stock options to officers and key employees. The plans are described below. Compensation cost related to the stock option plans was approximately $0.1 million, $0.2 million and $0.1 million for the years ended December 31, 2008, 2007 and 2006, respectively. The income tax benefit related to share-based compensation was approximately $31,000, $60,000 and $36,000 in 2008, 2007 and 2006, respectively.
At December 31, 2008, unrecognized cost related to the stock option plans was approximately $0.1 million. PlainsCapital expects to recognize that cost over a weighted-average period of approximately 6 months.
The acquisition described in Note 2 includes a provision whereby First Southwest stock options that were outstanding and unexercised at the acquisition date would be converted into PlainsCapital stock options on the same terms and conditions, including vesting conditions, as the First Southwest options they replaced. At December 31, 2008, outstanding and unexercised First Southwest stock options were convertible into 285,366 PlainsCapital stock options with a weighted-average exercise price of $4.53. This provision of the acquisition constitutes a modification of the First Southwest stock options, and will be accounted for as such by PlainsCapital. The converted options are being valued and the result of that valuation will be included in the final purchase price allocation of the acquisition.
The stock option plans were established in 2001, 2003, 2005 and 2007. Each of the plans originally provided for option grants that could result in the issuance of up to 150,000 shares of common stock, subject to increase or decrease in the event of a stock dividend or stock split. As a result of the acquisition, the 2007 plan was amended in December 2008 to allow grants that could result in the issuance of up to 450,000 shares of PlainsCapital stock. At December 31, 2008, a total of 477,294 shares were available for grant under these plans, including the shares issuable to First Southwest option holders under the provisions of the acquisition. PlainsCapital typically issues new shares upon exercise of option grants.
The exercise price of all common stock subject to options granted under these plans will not be less than 100% of the fair market value of the common stock on the date of grant, unless an option is granted to a person who owns more than 10% of the common stock, in which case the
F-35
Table of Contents
Index to Financial Statements
PlainsCapital Corporation and subsidiaries
Notes to consolidated financial statements (continued)
exercise price will not be less than 110% of the fair market value of the common stock subject to the options granted. Options granted expire in no more than ten years, unless an option is granted to a person who owns more than 10% of the common stock, in which case the options granted expire in no more than five years, or upon the termination of employment unless (i) the optionee retires, after which time he will have three months from the date of his retirement to exercise his options, or (ii) the optionee dies, after which time his legal representatives have the privilege for a period of six months after his death to exercise his options. Options granted prior to December 31, 2006, vested in six months. Beginning in January 2006, option grants vest in two years, except, as noted above for grants made under the provisions of the acquisition.
The weighted-average grant date fair value of options granted during 2008, 2007 and 2006 was $3.75, $3.70 and $3.31, respectively. PlainsCapital uses a Black-Scholes option pricing model to estimate the fair value of each option award on the date of grant. Risk-free rates are derived from yields on U.S. Treasury strips (zero-coupon bonds) on the date options are granted. The expected term of options granted is based on an analysis of historical exercise data and represents the expected period of time that options are to be outstanding. Expected volatility is based on historical volatility of PlainsCapital’s stock. The estimates for expected term and expected volatility are reviewed annually. Weighted-average values used to estimate the fair value of options granted are shown in the following table:
| 2008 | 2007 | 2006 | ||||
| Risk-free interest rate |
3.96% to 4.37% | 4.31% to 5.23% | 4.53% to 5.30% | |||
| Expected term (years) |
5 | 5 | 5 | |||
| Expected volatility |
23% | 24% | 25% | |||
| Dividend yield |
1.33% | 1.33% | 1.50% | |||
Information regarding these stock option plans in 2008 and 2007 is as follows:
| 2008 | 2007 | |||||||||||
| Shares | Weighted Average Exercise Price |
Shares | Weighted Average Exercise Price | |||||||||
| Outstanding, January 1 |
632,295 | $ | 9.57 | 639,306 | $ | 8.88 | ||||||
| Granted |
23,250 | 12.50 | 69,300 | 13.97 | ||||||||
| Exercised |
(32,349 | ) | 7.96 | (66,051 | ) | 7.12 | ||||||
| Cancellations and expirations |
(37,719 | ) | 11.46 | (10,260 | ) | 12.29 | ||||||
| Outstanding, December 31 |
585,477 | 9.65 | 632,295 | 9.57 | ||||||||
| Exercisable, December 31 |
505,227 | 9.03 | 507,345 | 8.64 | ||||||||
The total intrinsic value of options exercised during the year ended December 31, 2008, 2007 and 2006 was $0.2 million, $0.4 million and $1.8 million, respectively. At December 31, 2008, the intrinsic value of options outstanding was $1.0 million and the intrinsic value of exercisable shares was $1.2 million. The total fair value of share awards vested was $0.5 million in 2008, zero in 2007 and $1.0 million in 2006.
F-36
Table of Contents
Index to Financial Statements
PlainsCapital Corporation and subsidiaries
Notes to consolidated financial statements (continued)
Details of PlainsCapital’s stock options outstanding at December 31, 2008, are as follows:
| Range of Exercise Prices |
Outstanding Shares at December 31, 2008 |
Weighted Average Exercise Price |
Weighted Average Remaining Contractual Life (years) |
Exercisable Shares at December 31, 2008 |
Weighted Average Exercise Price |
Weighted Average Remaining Contractual Life (years) | ||||||
| Less than $5.00 |
16.791 | $4.82 | 0.4 | 16,791 | $4.82 | 0.4 | ||||||
| $5.01 - $10.00 |
262,242 | 7.16 | 3.5 | 262,242 | 7.16 | 3.5 | ||||||
| $10.01 - $15.00 |
306,444 | 12.05 | 7.1 | 226,194 | 11.52 | 6.5 | ||||||
| Total |
585,477 | 9.65 | 3.5 | 505,227 | 9.03 | 4.7 | ||||||
On December 17, 2008, PlainsCapital granted 528,000 shares of restricted stock to a group of officers and key employees. The aggregate grant date fair value of the restricted stock was approximately $6.0 million. The shares of restricted stock vest in equal annual installments over a seven year period. At December 31, 2008, unrecognized cost related to the restricted stock was approximately $6.0 million. PlainsCapital expects to recognize that cost as compensation expense over a period of 7 years.
In February 2009, PlainsCapital granted 115,500 options from its 2007, 2005, 2003 and 2001 stock option plans at an exercise price of $11.33 per share.
17. Regulatory matters
The Bank and PlainsCapital are subject to various regulatory capital requirements administered by the federal banking agencies. Failure to meet minimum capital requirements can initiate certain mandatory—and possibly additional discretionary—actions by regulators that, if undertaken, could have a direct, material effect on the consolidated financial statements. The regulations require the companies to meet specific capital adequacy guidelines that involve quantitative measures of assets, liabilities, and certain off-balance sheet items as calculated under regulatory accounting practices. The capital classifications are also subject to qualitative judgments by the regulators about components, risk weightings, and other factors.
F-37
Table of Contents
Index to Financial Statements
PlainsCapital Corporation and subsidiaries
Notes to consolidated financial statements (continued)
Quantitative measures established by regulation to ensure capital adequacy require the companies to maintain minimum amounts and ratios (set forth in the table below) of Tier 1 capital (as defined in the regulations) to total average assets (as defined), and minimum ratios of Tier 1 and total capital (as defined) to risk-weighted assets (as defined). A comparison of the Bank’s and PlainsCapital’s actual capital amounts and ratios to the minimum requirements is as follows (dollar amounts in thousands):
| At December 31, 2008 | ||||||||
| Required | Actual | |||||||
| Amount | Ratio | Amount | Ratio | |||||
| PlainsCapital Bank: |
||||||||
| Tier 1 capital (to average assets) |
$134,729 | 4% | $456,567 | 13.6% | ||||
| Tier 1 capital (to risk-weighted assets) |
133,404 | 4% | 456,567 | 13.7% | ||||
| Total capital (to risk-weighted assets) |
266,808 | 8% | 497,239 | 14.9% | ||||
| PlainsCapital Corporation: |
||||||||
| Tier 1 capital (to average assets) |
$134,986 | 4% | $428,897 | 12.7% | ||||
| Tier 1 capital (to risk-weighted assets) |
133,669 | 4% | 428,897 | 12.8% | ||||
| Total capital (to risk-weighted assets) |
267,338 | 8% | 485,569 | 14.5% | ||||
| At December 31, 2007 | ||||||||
| Required | Actual | |||||||
| Amount | Ratio | Amount | Ratio | |||||
| PlainsCapital Bank: |
||||||||
| Tier 1 capital (to average assets) |
$123,107 | 4% | $266,795 | 8.7% | ||||
| Tier 1 capital (to risk-weighted assets) |
110,145 | 4% | 266,795 | 9.7% | ||||
| Total capital (to risk-weighted assets) |
220,290 | 8% | 293,312 | 10.7% | ||||
| PlainsCapital Corporation: |
||||||||
| Tier 1 capital (to average assets) |
$123,557 | 4% | $248,985 | 8.1% | ||||
| Tier 1 capital (to risk-weighted assets) |
110,797 | 4% | 248,985 | 9.0% | ||||
| Total capital (to risk-weighted assets) |
221,594 | 8% | 295,502 | 10.7% | ||||
F-38
Table of Contents
Index to Financial Statements
PlainsCapital Corporation and subsidiaries
Notes to consolidated financial statements (continued)
A reconciliation of book capital to Tier 1 and total capital (as defined) is as follows (in thousands):
| At December 31, 2008 | ||||||
| PlainsCapital Bank |
PlainsCapital Corporation |
|||||
| Total capital per books |
$488,688 | $399,815 | ||||
| Add: |
||||||
| Minority interests |
466 | 1,709 | ||||
| Trust preferred securities |
— | 65,000 | ||||
| Net unrealized holding losses on securities available for sale and held in trust |
(331 | ) | (331 | ) | ||
| Deduct: |
||||||
| Goodwill and other disallowed intangible assets |
(32,256 | ) | (36,568 | ) | ||
| Other |
— | (728 | ) | |||
| Tier 1 capital (as defined) |
456,567 | 428,897 | ||||
| Add: Allowable Tier 2 capital |
||||||
| Allowance for loan losses |
40,672 | 40,672 | ||||
| Qualifying subordinated debt |
— | 16,000 | ||||
| Total capital (as defined) |
$497,239 | $485,569 | ||||
| At December 31, 2007 | ||||||
| PlainsCapital Bank |
PlainsCapital Corporation |
|||||
| Total capital per books |
$298,106 | $233,890 | ||||
| Add: |
||||||
| Minority interests |
466 | 1,849 | ||||
| Trust preferred securities |
— | 50,000 | ||||
| Net unrealized holding losses on securities available for sale and held in trust |
1,173 | 1,173 | ||||
| Deduct: |
||||||
| Goodwill and other disallowed intangible assets |
(32,950 | ) | (37,307 | ) | ||
| Other |
— | (620 | ) | |||
| Tier 1 capital (as defined) |
266,795 | 248,985 | ||||
| Add: Allowable Tier 2 capital |
||||||
| Allowance for loan losses |
26,517 | 26,517 | ||||
| Qualifying subordinated debt |
— | 20,000 | ||||
| Total capital (as defined) |
$293,312 | $295,502 | ||||
To be considered adequately capitalized (as defined) under the regulatory framework for prompt corrective action, the Bank must maintain minimum Tier 1 capital to total average assets and Tier 1 capital to risk-weighted assets ratios of 4%, and a total capital to risk-weighted assets ratio of 8%. Based on the actual capital amounts and ratios shown in the table above, the Bank’s ratios place it in the well capitalized (as defined) capital category under the regulatory framework for
F-39
Table of Contents
Index to Financial Statements
PlainsCapital Corporation and subsidiaries
Notes to consolidated financial statements (continued)
prompt corrective action. The minimum required capital amounts and ratios for the well capitalized category are summarized as follows (dollar amounts in thousands):
| December 31, 2008 required |
December 31, 2007 required | |||||||
| Amount | Ratio | Amount | Ratio | |||||
| PlainsCapital Bank: |
||||||||
| Tier 1 capital (to average assets) |
$168,411 | 5% | $153,884 | 5% | ||||
| Tier 1 capital (to risk-weighted assets) |
200,106 | 6% | 165,217 | 6% | ||||
| Total capital (to risk-weighted assets) |
333,510 | 10% | 275,362 | 10% | ||||
As a mortgage originator, PrimeLending is subject to minimum net worth requirements. In addition, First Southwest and PlainsCapital Securities, LLC are subject to minimum net worth requirements as broker-dealers. At December 31, 2008, these entities were in compliance with their respective requirements.
18. Shareholders’ equity
The Bank is subject to certain restrictions on the amount of dividends it may declare without prior regulatory approval. At December 31, 2008, approximately $42.6 million of retained earnings was available for dividend declaration without prior regulatory approval.
19. Cash and due from banks
Cash and due from banks consisted of the following:
| At December 31, | ||||
| 2008 | 2007 | |||
| Cash on hand |
$23,346 | $19,121 | ||
| Clearings and collection items |
35,446 | 56,181 | ||
| Deposits at Federal Reserve Bank |
26,749 | 16,756 | ||
| Deposits at Federal Home Loan Bank |
1,076 | 1,194 | ||
| Deposits in FDIC-insured institutions under $100,000, individually |
1,849 | 571 | ||
| Deposits in FDIC-insured institutions over $100,000 |
4,319 | 2,493 | ||
| $92,785 | $96,316 | |||
The amounts above include interest-bearing deposits of $15.9 million and $3.5 million at December 31, 2008 and 2007, respectively.
Cash on hand and deposits at the Federal Reserve Bank satisfy regulatory reserve requirements at December 31, 2008 and 2007.
F-40
Table of Contents
Index to Financial Statements
PlainsCapital Corporation and subsidiaries
Notes to consolidated financial statements (continued)
20. Fair value measurements
SFAS 157
On January 1, 2008, PlainsCapital adopted SFAS 157, Fair Value Measurements. SFAS 157 defines fair value, establishes a framework for measuring fair value in generally accepted accounting principles, and expands disclosures about fair value measurements. SFAS 157 defines fair value as the price that would be received to sell an asset or paid to transfer a liability in an orderly transaction between market participants. SFAS 157 assumes that transactions upon which fair value measurements are based occur in the principal market for the asset or liability being measured. Further, fair value measurements made under SFAS 157 exclude transaction costs and are not the result of forced transactions.
SFAS creates a fair value hierarchy that classifies fair value measurements based upon the inputs used in valuing the assets or liabilities that are the subject of fair value measurements. The fair value hierarchy gives the highest priority to quoted prices in active markets for identical assets or liabilities and the lowest priority to unobservable inputs, as indicated below.
| • | Level 1 Inputs: Unadjusted quoted prices in active markets for identical assets or liabilities that PlainsCapital can access at the measurement date. |
| • | Level 2 Inputs: Observable inputs other than Level 1 prices. Level 2 inputs include quoted prices for similar assets or liabilities in active markets, quoted prices for identical or similar assets or liabilities in markets that are not active, inputs other than quoted prices that are observable for the asset or liability (e.g. interest rates and credit risks), and inputs that are derived from or corroborated by market data, among others. |
| • | Level 3 Inputs: Unobservable inputs that reflect an entity’s own assumptions about the assumptions that market participants would use in pricing the assets or liabilities. Level 3 inputs include pricing models and discounted cash flow techniques, among others. |
SFAS 159
On January 1, 2008, PlainsCapital adopted SFAS 159, The Fair Value Option for Financial Assets and Financial Liabilities. SFAS 159 permits entities to choose to measure many financial instruments and certain other items at fair value. PlainsCapital has elected to measure substantially all of PrimeLending’s mortgage loans held for sale and certain time deposits at fair value. PlainsCapital elected to apply the provisions of SFAS 159 to these items so that it would have the opportunity to mitigate volatility in reported earnings caused by measuring related assets and liabilities differently without having to apply complex hedge accounting provisions. PlainsCapital determines the fair value of the financial instruments accounted for under the provisions of SFAS 159 in compliance with the provisions of SFAS 157 discussed above.
At December 31, 2008, the aggregate fair value of PrimeLending loans held for sale accounted for under a SFAS 159 fair value option was $192.3 million, while the unpaid principal balance of those loans was $188.1 million. The fair value excludes interest, which is reported as interest income on loans in the income statement.
F-41
Table of Contents
Index to Financial Statements
PlainsCapital Corporation and subsidiaries
Notes to consolidated financial statements (continued)
PlainsCapital holds a number of financial instruments that are measured at fair value on a recurring basis, either by the application of SFAS 159 or other authoritative pronouncements. The fair values of those instruments are determined as described below.
Loans Held for Sale—Mortgage loans held for sale are reported at fair value, as discussed above, using Level 2 inputs that consist of commitments on hand from investors or prevailing market prices. These instruments are held for relatively short periods, typically no more than 30 days. As a result, changes in instrument-specific credit risk are not a significant component of the change in fair value.
Securities Available for Sale—Most securities available for sale are reported at fair value using Level 2 inputs. PlainsCapital obtains fair value measurements from an independent pricing service. The fair value measurements consider observable data that may include dealer quotes, market spreads, cash flows, the U.S. Treasury yield curve, live trading levels, trade execution data, market consensus prepayment speeds, credit information and the financial instruments’ terms and conditions, among other things. At December 31, 2008, PlainsCapital held one mortgage-backed security issued by FNMA that the pricing service was unable to price due to the terms and conditions of the instrument. As a result, the pricing service determined that fair value was equal to book value using Level 3 inputs. In addition, auction rate securities purchased as a result of the First Southwest acquisition were valued using Level 3 inputs, as discussed in Acquisition, below.
Trading Securities—Trading securities are reported at fair value using Level 2 inputs in the same manner as discussed previously for securities available for sale.
Deposits—As discussed previously, certain time deposits are reported at fair value by virtue of an election under the provisions of SFAS 159. Fair values are determined using Level 2 inputs that consist of observable rates paid on instruments of the same tenor in the brokered certificate of deposit market.
Derivatives—Derivatives are reported at fair value using Level 2 inputs. PlainsCapital uses dealer quotes to determine the fair value interest rate swaps used to hedge time deposits and certain customer contracts. PrimeLending uses dealer quotes to value forward purchase commitments executed for both hedging and non-hedging purposes. PrimeLending also issues IRLCs to its customers that it values based on the change in the fair value of the underlying mortgage loan from inception of the IRLC to the balance sheet date. PrimeLending determines the value of the underlying mortgage loan as discussed in Loans Held for Sale, above.
F-42
Table of Contents
Index to Financial Statements
PlainsCapital Corporation and subsidiaries
Notes to consolidated financial statements (continued)
The following table presents information regarding financial assets and liabilities measured at fair value on a recurring basis, including changes in fair value for those instruments that are reported at fair value under an election under the provisions of SFAS 159 (in thousands).
| At December 31, 2008 | Changes in fair value for assets and liabilities reported at fair value under provisions of SFAS 159 for the year ended December 31, 2008 | |||||||||||||||
| Level 1 inputs |
Level 2 inputs |
Level 3 inputs |
Total fair value |
Net gains from sale of loans |
Other noninterest income |
Total changes in fair value | ||||||||||
| Loans held for sale |
$— | $192,260 | $ — | $192,260 | $4,118 | $ — | $4,118 | |||||||||
| Securities available for sale |
— | 119,755 | 46,802 | 166,557 | — | — | — | |||||||||
| Trading securities |
— | 1,561 | — | 1,561 | — | — | — | |||||||||
| Derivative assets |
— | 4,387 | — | 4,387 | — | — | — | |||||||||
| Deposits |
— | 1,757 | — | 1,757 | — | 72 | 72 | |||||||||
| Derivative liabilities |
— | (56 | ) | — | (56 | ) | — | — | — | |||||||
PlainsCapital also determines the fair value of assets and liabilities on a non-recurring basis. For example, facts and circumstances may dictate a fair value measurement when there is evidence of impairment. Assets and liabilities measured on a non-recurring basis include the items discussed below.
Acquisition—As discussed in Note 2, the assets and liabilities of First Southwest are included, at estimated fair value, in the consolidated balance sheet at December 31, 2008, the acquisition date. In addition, auction rate securities held by First Southwest prior to the merger were purchased by the Bank at the closing of the acquisition on December 31, 2008. The estimated fair value of the auction rate securities was determined by a third-party valuation specialist using Level 3 inputs, primarily due to the lack of observable market data. Inputs for the valuation were developed using terms of the auction rate securities, market interest rates, asset appropriate credit transition matrices and recovery rates, and assumptions regarding the term to maturity of the auction rate securities.
Impaired (Non-accrual) Loans—PlainsCapital reports non-accrual loans at fair value through charges against the allowance for loan losses. PlainsCapital determines fair value using Level 2 inputs consisting of observable loss experience for similar loans. At December 31, 2008, loans with a carrying amount of $44.7 million had been reduced by charges to the allowance for loan losses of $23.7 million, resulting in a reported fair value of $21.0 million.
Other Real Estate Owned—PlainsCapital reports other real estate owned at fair value through use of valuation allowances that are charged against the allowance for loan losses or earnings as applicable. PlainsCapital determines fair value using Level 2 inputs consisting of independent appraisals. At December 31, 2008, the fair value of other real estate owned was $9.6 million.
F-43
Table of Contents
Index to Financial Statements
PlainsCapital Corporation and subsidiaries
Notes to consolidated financial statements (continued)
SFAS 107, Disclosures about Fair Value of Financial Instruments, requires disclosure of the fair value of financial assets and liabilities, including the financial assets and liabilities previously discussed. The methods for determining estimated fair value for financial assets and liabilities measured at fair value on a recurring or non-recurring basis are discussed above. For other financial assets and liabilities, PlainsCapital quoted market prices, if available, to estimate of the fair value of financial instruments. Because no quoted market prices exist for a significant portion of PlainsCapital’s financial instruments, the fair value of such instruments has been derived based on management’s assumptions with respect to future economic conditions, the amount and timing of future cash flows, and estimated discount rates. Different assumptions could significantly affect these estimates. Accordingly, the estimates provided herein do not necessarily indicate amounts which could be realized in a current transaction. Further, as it is management’s intent to hold a significant portion of its financial instruments to maturity, it is not probable that the fair values shown below will be realized in a current transaction.
Because of the wide range of permissible valuation techniques and the numerous estimates which must be made, it may be difficult to make reasonable comparisons of PlainsCapital’s fair value information to that of other financial institutions. The aggregate estimated fair value amount should in no way be construed as representative of the underlying value of PlainsCapital and its subsidiaries.
The following methods and assumptions were used in estimating the fair value disclosures for financial instruments:
Cash and Short-Term Investments—For cash and due from banks and federal funds sold, the carrying amount is a reasonable estimate of fair value.
Assets Segregated for Regulatory Purposes—For assets segregated for regulatory purposes, the carrying amount is a reasonable estimate of fair value.
Loans Held for Sale—Estimated fair values of loans held for sale are based on commitments on hand from investors or prevailing market prices. The carrying amount of mortgage loans held for sale has been adjusted to fair value under the provisions of SFAS 159.
Securities—For securities held to maturity, estimated fair value equals quoted market price, if available. If a quoted market price is not available, fair value is estimated using quoted market prices for similar securities. For securities available for sale and trading securities, the carrying amount is a reasonable estimate of fair value.
Loans—The fair value of loans is estimated by discounting the future cash flows using the current rates at which similar loans would be made to borrowers with similar credit ratings and for the same remaining maturities.
Broker/Dealer and Clearing Organization Receivables—The carrying amount approximates fair value.
Fee Award Receivable—The carrying amount approximates fair value.
Cash Surrender Value of Life Insurance Policies and Accrued Interest—The carrying amounts approximate their fair values.
F-44
Table of Contents
Index to Financial Statements
PlainsCapital Corporation and subsidiaries
Notes to consolidated financial statements (continued)
Deposit Liabilities—The estimated fair value of demand deposits, savings accounts, and NOW accounts is the amount payable on demand at the reporting date. The fair value of fixed-maturity certificates of deposit is estimated using the rates currently offered for deposits of similar remaining maturities. The carrying amount for variable-rate certificates of deposit approximates their fair values.
Broker/Dealer and Clearing Organization Payables—The carrying amount approximates fair value.
Short-Term Borrowings—The carrying amounts of federal funds purchased, and borrowings under repurchase agreements and other short-term borrowings approximate their fair values.
Debt—The fair values are estimated using discounted cash flow analysis based on PlainsCapital’s current incremental borrowing rates for similar types of borrowing arrangements.
The estimated fair values of PlainsCapital’s financial instruments are shown below (in thousands):
| At December 31, 2008 | At December 31, 2007 | |||||||||||
| Carrying amount |
Estimated fair value |
Carrying amount |
Estimated fair value |
|||||||||
| Financial assets |
||||||||||||
| Cash and short-term investments |
$ 114,571 | $ 114,571 | $ 126,422 | $ 126,422 | ||||||||
| Assets segregated for regulatory purposes |
11,500 | 11,500 | — | — | ||||||||
| Loans held for sale |
198,866 | 198,866 | 100,015 | 100,015 | ||||||||
| Securities |
385,327 | 385,137 | 191,175 | 189,268 | ||||||||
| Loans, net |
2,924,947 | 2,965,364 | 2,570,845 | 2,595,072 | ||||||||
| Broker/dealer and clearing organization receivables |
45,331 | 45,331 | — | — | ||||||||
| Fee award receivable |
21,544 | 21,544 | — | — | ||||||||
| Cash surrender value of life insurance policies |
20,698 | 20,698 | 19,813 | 19,813 | ||||||||
| Interest rate swaps and IRLCs |
4,387 | 4,387 | (255 | ) | (255 | ) | ||||||
| Accrued interest receivable |
16,164 | 16,164 | 17,213 | 17,213 | ||||||||
| Financial liabilities |
||||||||||||
| Deposits |
2,926,099 | 3,137,686 | 2,393,354 | 2,399,746 | ||||||||
| Broker/dealer and clearing organization payables |
59,203 | 59,203 | — | — | ||||||||
| Short-term borrowings |
256,452 | 256,452 | 413,060 | 413,060 | ||||||||
| Debt |
221,450 | 221,450 | 95,050 | 95,050 | ||||||||
| Forward purchase commitments |
(56 | ) | (56 | ) | 1,511 | 1,511 | ||||||
| Accrued interest payable |
5,930 | 5,930 | 8,491 | 8,491 | ||||||||
The deferred income amounts arising from unrecognized financial instruments are not significant. Also, these financial instruments have contractual interest rates at or above current market rates. Therefore, no fair value disclosure is provided for these items.
F-45
Table of Contents
Index to Financial Statements
PlainsCapital Corporation and subsidiaries
Notes to consolidated financial statements (continued)
21. Derivative financial instruments
The Bank and PrimeLending use various derivative financial instruments to mitigate interest rate risk or to hedge specified assets and liabilities. The Bank’s interest rate risk management strategy involves modifying the re-pricing characteristics of certain assets and liabilities so that changes in interest rates do not adversely affect the net interest margin. PrimeLending has interest rate risk relative to its inventory of mortgage loans held for sale and IRLCs. PrimeLending is exposed to such rate risk from the time an IRLC is made to an applicant to the time the related mortgage loan is sold.
Fair value hedges
The Bank entered into interest rate swap agreements to convert certain fixed rate brokered certificates of deposit to floating rate. To the extent that these swaps meet the criteria required to qualify for the shortcut method of accounting under SFAS No. 133, the Bank assumes no ineffectiveness in these hedging relationships and fair value changes in the interest rate swaps are recorded as changes in the value of both the swap and hedged items. If the relationships fail to qualify for the shortcut method, the Bank records changes in the fair value of the swaps in current earnings.
PrimeLending has executed forward purchase commitments to sell mortgage loans. Prior to January 1, 2008, a portion of those forward purchase commitments were designated as fair value hedges of certain mortgage loans held for sale. The forward purchase commitments were highly effective in offsetting volatility in the fair value of closed mortgage loans caused by changes in interest rates. In compliance with SFAS No. 133, the forward purchase commitments were recorded on the consolidated balance sheets, in other liabilities, at fair value, and the carrying amount of hedged loans held for sale was adjusted to fair value as well. To the extent that the hedging relationships were ineffective (i.e. changes in the fair values of the forward purchase commitments and the hedged loans held for sale did not exactly offset), the ineffectiveness was recorded in current earnings. The amount of hedge ineffectiveness was not significant in 2007 and 2006. PrimeLending ended its fair value hedging program upon the adoption of SFAS 159 on January 1, 2008.
Cash flow hedges
The Bank entered into interest rate swap agreements to manage interest rate risk associated with certain customer contracts. The swaps were originally designated as cash flow hedges. The swaps were highly effective in offsetting future cash flow volatility caused by changes in interest rates. The Bank has recorded the fair value of the swaps in other assets, and unrealized gains (losses) associated with the swaps in other comprehensive income.
Non-hedging derivative instruments and SFAS 159
Prior to the Adoption of SFAS 159—The portion of forward purchase commitments not designated as fair value hedges served to manage the interest rate risk associated with IRLCs. As discussed in Note 1, IRLCs are derivative instruments as defined by SFAS No. 133. Accordingly, the risk management activities related to the IRLCs did not qualify for hedge accounting under
F-46
Table of Contents
Index to Financial Statements
PlainsCapital Corporation and subsidiaries
Notes to consolidated financial statements (continued)
SFAS 133. As a result, the changes in the fair value of both the forward purchase commitments not designated as hedges and the IRLCs affected current earnings. The fair value of the IRLCs was recorded on the consolidated balance sheets in other assets, while the fair value of the forward purchase commitments was recorded in other liabilities. Changes in the fair values of these derivative instruments produced a net loss of approximately $149,000 for the year ended December 31, 2007, and a net gain of approximately $42,000 for the year ended December 31, 2006. The net gain or loss was recorded as a component of gain on sale of loans.
Subsequent to the Adoption of SFAS 159—As discussed in Note 20 PlainsCapital adopted SFAS 159 on January 1, 2008. At adoption, PrimeLending elected to measure substantially all mortgage loans held for sale at fair value on a prospective basis. The election provides PrimeLending the opportunity to mitigate volatility in reported earnings caused by measuring related assets and liabilities differently without applying complex hedge accounting provisions. Accordingly, PrimeLending no longer applies hedge accounting under SFAS 133. The fair values of both IRLCs and purchase commitments are recorded in other assets or other liabilities, as appropriate. Changes in the fair values of these derivative instruments produced a net gain of approximately $3.6 million for the year ended December 31, 2008. The net gain or loss was recorded as a component of gain on sale of loans.
Year-end derivative positions are presented in the following table (in thousands):
| At December 31, 2008 | At December 31, 2007 | |||||||||
| Notional amount |
Estimated fair value |
Notional amount |
Estimated fair value |
|||||||
| Derivative instruments designated as hedges |
||||||||||
| Interest rate swaps hedging brokered certificates of deposit |
$ — | $ — | $15,000 | $ (182 | ) | |||||
| Forward purchase commitments |
— | — | 62,914 | (1,480 | ) | |||||
| Non-hedging derivative instruments |
||||||||||
| IRLCs |
$219,700 | $ 5,019 | $80,365 | $ 18 | ||||||
| Interest rate swaps |
14,969 | (140 | ) | 13,000 | (91 | ) | ||||
| Forward purchase commitments |
280,795 | (1,399 | ) | 69,452 | (30,376 | ) | ||||
the Bank recorded unrealized gains (losses), net of reclassifications adjustments, on the swaps designated as cash flow hedges in other comprehensive income as shown in the following table (in thousands).
| Year ended December 31, 2008 | Year ended December 31, 2007 | ||||||||||||||||
| Before-tax amount |
Tax benefit (expense) |
After-tax amount |
Before-tax amount |
Tax benefit (expense) |
After-tax amount |
||||||||||||
| Change in market value |
$ — | $— | $ — | $42 | $(15 | ) | $ 27 | ||||||||||
| Reclassification adjustments |
(19 | ) | 7 | (12 | ) | (27 | ) | 9 | (18 | ) | |||||||
| Other comprehensive income (loss) |
$(19 | ) | $ 7 | $(12 | ) | $15 | $ (6 | ) | $ 9 | ||||||||
F-47
Table of Contents
Index to Financial Statements
PlainsCapital Corporation and subsidiaries
Notes to consolidated financial statements (continued)
Over the next twelve months, the Bank estimates that approximately $20,000 of unrealized after-tax gains will be reclassified from other comprehensive income into interest income, representing the earnings volatility that is avoided by using the interest rate swaps.
22. Other noninterest income and expense
The following tables show the components of other noninterest income and expense for the years ended December 31, 2008, 2007 and 2006 (in thousands).
| 2008 | 2007 | 2006 | |||||||
| Other noninterest income |
|||||||||
| Investment banking, advisory, brokerage and underwriting fees and commissions |
$ | 3,591 | $ | 3,804 | $ | 3,481 | |||
| Revenue from check and stored value cards |
1,557 | 1,320 | 1,070 | ||||||
| Other |
5,670 | 7,017 | 6,223 | ||||||
| $ | 10,818 | $ | 12,141 | $ | 10,774 | ||||
| Other noninterest expense |
|||||||||
| Marketing |
$ | 9,002 | $ | 5,928 | $ | 4,002 | |||
| Data processing |
2,438 | 2,088 | 1,837 | ||||||
| Printing, stationery and supplies |
1,392 | 1,173 | 1,434 | ||||||
| Funding fees |
1,785 | 1,352 | 1,490 | ||||||
| Unreimbursed loan closing costs |
1,666 | 769 | 930 | ||||||
| Other |
13,127 | 10,668 | 13,088 | ||||||
| $ | 29,410 | $ | 21,978 | $ | 22,781 | ||||
23. Preferred stock
On December 19, 2008, PlainsCapital executed a Letter Agreement and the related Securities Purchase Agreement – Standard Terms (collectively, the Purchase Agreement) with the United States Department of the Treasury (“Treasury”) under the provisions of the Troubled Asset Relief Program (“TARP”) Capital Purchase Program. Under the terms of the Purchase Agreement, PlainsCapital issued 87,631 shares of its Fixed Rate Cumulative Perpetual Preferred Stock, Series A, liquidation preference $1,000 per share (“Series A”) and warrants to purchase 4,382 shares of its Fixed Rate Cumulative Perpetual Preferred Stock, Series B, liquidation preference $1,000 per share, to the Treasury and received aggregate proceeds of $87.6 million. The Treasury immediately exercised the warrants to purchase the Series B preferred shares. PlainsCapital did not realize additional proceeds from the warrant exercise.
Both Series A and Series B qualify as Tier 1 capital for regulatory capital purposes. Series A pays cumulative dividends at a rate of 5% per annum until February 15, 2014 and 9% per annum thereafter. Series B pays cumulative dividends at a rate of 9% per annum.
On and after February 15, 2012, PlainsCapital may, at its option, subject to prior regulatory approval, redeem shares of Series A, in whole or in part, at any time and from time to time, for
F-48
Table of Contents
Index to Financial Statements
PlainsCapital Corporation and subsidiaries
Notes to consolidated financial statements (continued)
cash at a per share amount equal to the sum of the liquidation preference per share plus any accrued and unpaid dividends to but excluding the redemption date. Prior to February 15, 2012, PlainsCapital may be allowed to redeem shares of Series A and Series B under terms and conditions to be determined by the Secretary of the Treasury, in consultation with the Federal Reserve Bank. Regardless of the timing of any redemption, PlainsCapital may not redeem Series B shares until such time as all Series A shares have been redeemed.
24. Segment and related information
PlainsCapital has three reportable segments that are organized primarily by the core products offered to the segments’ respective customers, although numerous opportunities for cross-selling exist between segments. The Banking segment includes the operations of the Bank and PlainsCapital Leasing, LLC. The operations of PrimeLending constitute the Mortgage Origination segment. The Financial Advisory segment is composed of Hester Capital and, as of December 31, 2008, First Southwest. The operations of PlainsCapital and its remaining subsidiaries are included in “All Other and Eliminations.”
The following tables present information about the revenues, profits and assets of PlainsCapital’s reportable segments (in thousands). The assets of First Southwest are reflected in the Financial Advisory segment as of December 31, 2008. However, the operations of First Southwest will be reflected in the results of the Financial Advisory segment beginning January 1, 2009.
Income statement data
| Year ended December 31, 2008 | |||||||||||
| Banking | Mortgage origination |
Financial advisory |
All other and eliminations |
PlainsCapital consolidated | |||||||
| Interest income |
$196,409 | $ 5,452 | $ 11 | $ (8,480 | ) | $193,392 | |||||
| Interest expense |
64,937 | 3,388 | — | (2,256 | ) | 66,069 | |||||
| Net interest income |
131,472 | 2,064 | 11 | (6,224 | ) | 127,323 | |||||
| Provision for loan losses |
22,818 | — | — | — | 22,818 | ||||||
| Noninterest income |
20,142 | 93,157 | 6,063 | (296 | ) | 119,066 | |||||
| Noninterest expense |
84,498 | 83,446 | 4,956 | 13,822 | 186,722 | ||||||
| Net income (loss) before taxes |
44,298 | 11,775 | 1,118 | (20,342 | ) | 36,849 | |||||
| Income tax provision (benefit) |
15,379 | 4,196 | — | (6,850 | ) | 12,725 | |||||
| Net income (loss) |
$ 28,919 | $ 7,579 | $1,118 | $(13,492 | ) | $ 24,124 | |||||
F-49
Table of Contents
Index to Financial Statements
PlainsCapital Corporation and subsidiaries
Notes to consolidated financial statements (continued)
Balance sheet data
| December 31, 2008 | |||||||||||
| Banking | Mortgage origination |
Financial advisory |
All other and eliminations |
PlainsCapital consolidated | |||||||
| Cash and due from banks |
$ 93,190 | $ 9,344 | $ 5,554 | $ (15,303 | ) | $ 92,785 | |||||
| Loans held for sale |
6,605 | 192,261 | — | — | 198,866 | ||||||
| Securities |
383,766 | — | 1,561 | — | 385,327 | ||||||
| Loans, net |
2,825,914 | — | 125,522 | (26,489 | ) | 2,924,947 | |||||
| Investment in subsidiaries |
394,942 | — | — | (394,942 | ) | — | |||||
| Goodwill |
7,862 | 24,312 | 4,312 | — | 36,486 | ||||||
| Other assets |
179,168 | 8,655 | 263,557 | (137,795 | ) | 313,585 | |||||
| Total assets |
$3,891,447 | $234,572 | $400,506 | $(574,529 | ) | $3,951,996 | |||||
| Deposits |
$2,870,304 | $ — | $ 82,079 | $ (26,284 | ) | $2,926,099 | |||||
| Short-term borrowings |
219,952 | — | 36,500 | — | 256,452 | ||||||
| Notes payable |
102,666 | 182,061 | 124,217 | (257,930 | ) | 151,014 | |||||
| Junior subordinated debentures |
— | — | — | 67,012 | 67,012 | ||||||
| Other liabilities |
200,968 | 14,598 | 90,933 | (154,895 | ) | 151,604 | |||||
| Shareholders’ equity |
497,557 | 37,913 | 66,777 | (202,432 | ) | 399,815 | |||||
| Total liabilities and shareholders’ equity |
$3,891,447 | $234,572 | $400,506 | $(574,529 | ) | $3,951,996 | |||||
Income statement data
| Year ended December 31, 2007 | |||||||||||
| Banking | Mortgage origination |
Financial advisory |
All other and eliminations |
PlainsCapital consolidated | |||||||
| Interest income |
$228,592 | $ 5,109 | $ 32 | $(12,838 | ) | $220,895 | |||||
| Interest expense |
107,269 | 3,528 | — | (5,992 | ) | 104,805 | |||||
| Net interest income |
121,323 | 1,581 | 32 | (6,846 | ) | 116,090 | |||||
| Provision for loan losses |
5,517 | — | — | — | 5,517 | ||||||
| Noninterest income |
18,281 | 58,978 | 6,427 | 595 | 84,281 | ||||||
| Noninterest expense |
76,133 | 58,137 | 5,071 | 12,017 | 151,358 | ||||||
| Net income (loss) before taxes |
57,954 | 2,422 | 1,388 | (18,268 | ) | 43,496 | |||||
| Income tax provision (benefit) |
19,338 | 922 | — | (5,356 | ) | 14,904 | |||||
| Net income (loss) |
$ 38,616 | $ 1,500 | $1,388 | $(12,912 | ) | $ 28,592 | |||||
F-50
Table of Contents
Index to Financial Statements
PlainsCapital Corporation and subsidiaries
Notes to consolidated financial statements (continued)
Balance sheet data
| December 31, 2007 | ||||||||||||||||
| Banking | Mortgage origination |
Financial advisory |
All other and eliminations |
PlainsCapital consolidated | ||||||||||||
| Cash and due from banks |
$ | 102,298 | $ | 10,171 | $ | 1,563 | $ | (17,716 | ) | $ | 96,316 | |||||
| Loans held for sale |
25,827 | 74,188 | — | — | 100,015 | |||||||||||
| Securities |
191,175 | — | — | — | 191,175 | |||||||||||
| Loans, net |
2,570,061 | — | — | 784 | 2,570,845 | |||||||||||
| Investment in subsidiaries |
270,968 | — | — | (270,968 | ) | — | ||||||||||
| Goodwill |
7,862 | 24,933 | 4,312 | — | 37,107 | |||||||||||
| Other assets |
156,148 | 4,231 | 508 | 26,518 | 187,405 | |||||||||||
| Total assets |
$ | 3,324,339 | $ | 113,523 | $ | 6,383 | $ | (261,382 | ) | $ | 3,182,863 | |||||
| Deposits |
$ | 2,416,022 | $ | — | $ | — | $ | (22,668 | ) | $ | 2,393,354 | |||||
| Short-term borrowings |
413,060 | — | — | — | 413,060 | |||||||||||
| Notes payable |
149,656 | 72,214 | — | (181,614 | ) | 40,256 | ||||||||||
| Junior subordinated debentures |
— | — | — | 51,548 | 51,548 | |||||||||||
| Other liabilities |
42,070 | 5,353 | 439 | 2,893 | 50,755 | |||||||||||
| Shareholders’ equity |
303,531 | 35,956 | 5,944 | (111,541 | ) | 233,890 | ||||||||||
| Total liabilities and shareholders’ equity |
$ | 3,324,339 | $ | 113,523 | $ | 6,383 | $ | (261,382 | ) | $ | 3,182,863 | |||||
Income statement data
| Year ended December 31, 2006 | |||||||||||||||||
| Banking | Mortgage origination |
Financial advisory |
All other and eliminations |
PlainsCapital consolidated | |||||||||||||
| Interest income |
$ | 201,864 | $ | 8,827 | $ | 22 | $ | (17,901 | ) | $ | 192,812 | ||||||
| Interest expense |
90,544 | 7,202 | — | (10,773 | ) | 86,973 | |||||||||||
| Net interest income |
111,320 | 1,625 | 22 | (7,128 | ) | 105,839 | |||||||||||
| Provision for loan losses |
5,049 | — | — | — | 5,049 | ||||||||||||
| Noninterest income |
16,306 | 79,975 | 5,799 | (304 | ) | 101,776 | |||||||||||
| Noninterest expense |
68,566 | 81,847 | 4,678 | 8,112 | 163,203 | ||||||||||||
| Net income (loss) before taxes |
54,011 | (247 | ) | 1,143 | (15,544 | ) | 39,363 | ||||||||||
| Income tax provision (benefit) |
18,598 | (9 | ) | — | (4,965 | ) | 13,624 | ||||||||||
| Net income (loss) |
$ | 35,413 | $ | (238 | ) | $ | 1,143 | $ | (10,579 | ) | $ | 25,739 | |||||
F-51
Table of Contents
Index to Financial Statements
PlainsCapital Corporation and subsidiaries
Notes to consolidated financial statements (continued)
Balance sheet data
| December 31, 2006 | |||||||||||
| Banking | Mortgage origination |
Financial advisory |
All other and eliminations |
PlainsCapital consolidated | |||||||
| Cash and due from banks |
$ 120,981 | $ 18,262 | $ 845 | $ (23,376 | ) | $ 116,712 | |||||
| Loans held for sale |
25,701 | 101,138 | — | — | 126,839 | ||||||
| Securities |
193,504 | — | — | — | 193,504 | ||||||
| Loans, net |
2,179,461 | — | — | (1,164 | ) | 2,178,297 | |||||
| Investment in subsidiaries |
340,786 | — | — | (340,786 | ) | — | |||||
| Goodwill |
7,435 | 24,933 | 4,312 | — | 36,680 | ||||||
| Other assets |
203,921 | 5,912 | 588 | 18,244 | 228,665 | ||||||
| Total assets |
$3,071,789 | $150,245 | $5,745 | $(347,082 | ) | $2,880,697 | |||||
| Deposits |
$2,525,156 | $ — | $ — | $ (29,106 | ) | $2,496,050 | |||||
| Short-term borrowings |
44,977 | — | — | — | 44,977 | ||||||
| Notes payable |
184,981 | 100,706 | — | (249,827 | ) | 35,860 | |||||
| Junior subordinated debentures |
— | — | — | 51,548 | 51,548 | ||||||
| Other liabilities |
41,680 | 11,087 | 299 | (10,136 | ) | 42,930 | |||||
| Shareholders’ equity |
274,995 | 38,452 | 5,446 | (109,561 | ) | 209,332 | |||||
| Total liabilities and shareholders’ equity |
$3,071,789 | $150,245 | $5,745 | $(347,082 | ) | $2,880,697 | |||||
25. Earnings per share
The following table reconciles the number of shares used in the calculations of basic and diluted earnings per common share.
| 2008 | 2007 | 2006 | ||||
| Weighted-average shares outstanding for basic earnings per share |
26,117,934 | 26,012,250 | 25,785,612 | |||
| Dilutive effect of contingently issuable shares due to First Southwest acquisition |
4,650 | — | — | |||
| Dilutive effect of stock options and non-vested stock awards |
133,581 | 182,961 | 244,893 | |||
| Weighted-average shares outstanding for diluted earnings per share |
26,256,165 | 26,195,211 | 26,030,505 | |||
The dilutive effect of the First Southwest contingent consideration shares may increase significantly in the weighted-average shares outstanding during the four-year contingency period.
The weighted-average shares outstanding used to compute diluted earnings per share do not include outstanding options of 99,150, 67,800 and 61,650 for the years ended 2008, 2007 and
F-52
Table of Contents
Index to Financial Statements
PlainsCapital Corporation and subsidiaries
Notes to consolidated financial statements (continued)
2006, respectively. The exercise price of the excluded options exceeded the average market price of PlainsCapital stock in the years shown. Accordingly, the assumed exercise of the excluded options would have been antidilutive.
26. Condensed financial statements of PlainsCapital
Condensed financial statements of PlainsCapital (parent only) follow. Investments in subsidiaries are determined using the equity method of accounting.
Condensed statements of income
| Years ended December 31, | |||||||||
| 2008 | 2007 | 2006 | |||||||
| Income |
|||||||||
| Dividend income |
|||||||||
| From banks |
$20,000 | $20,000 | $13,000 | ||||||
| From nonbanks |
127 | 133 | 130 | ||||||
| Interest and other income |
399 | 278 | 1,986 | ||||||
| Total income |
20,526 | 20,411 | 15,116 | ||||||
| Expense |
|||||||||
| Interest expense |
6,339 | 7,147 | 6,990 | ||||||
| Salaries and employee benefits |
8,227 | 7,284 | 6,371 | ||||||
| Other |
5,278 | 4,327 | 3,603 | ||||||
| Total expense |
19,844 | 18,758 | 16,964 | ||||||
| Income before income taxes and equity in net earnings of subsidiaries |
682 | 1,653 | (1,848 | ) | |||||
| Income tax benefit |
(6,718 | ) | (5,258 | ) | (4,877 | ) | |||
| Equity in net earnings of subsidiaries |
16,724 | 21,681 | 22,710 | ||||||
| Net income |
$24,124 | $28,592 | $25,739 | ||||||
F-53
Table of Contents
Index to Financial Statements
PlainsCapital Corporation and subsidiaries
Notes to consolidated financial statements (continued)
Condensed balance sheet
| December 31, | ||||
| 2008 | 2007 | |||
| Assets |
||||
| Cash and due from banks |
$ 3,992 | $ 986 | ||
| Loans, net |
— | 2,500 | ||
| Investment in subsidiaries |
504,262 | 312,299 | ||
| Premises and equipment, net |
2,132 | 2,016 | ||
| Other assets |
10,788 | 17,134 | ||
| Total assets |
$521,174 | $334,935 | ||
| Balances due to subsidiaries |
$ 68,388 | $ 53,085 | ||
| Notes payable |
50,150 | 38,500 | ||
| Other liabilities |
2,821 | 9,460 | ||
| Shareholders’ equity |
399,815 | 233,890 | ||
| Total liabilities and shareholders’ equity |
$521,174 | $334,935 | ||
Condensed statements of cash flows
| Years ended December 31, | |||||||||
| 2008 | 2007 | 2006 | |||||||
| Operating activities |
|||||||||
| Net income |
$ 24,124 | $ 28,592 | $ 25,739 | ||||||
| Adjustments to reconcile net income to net cash provided by (used for) operating activities |
|||||||||
| Equity in net earnings of subsidiaries |
(16,724 | ) | (21,681 | ) | (22,710 | ) | |||
| Other, net |
(2,725 | ) | 290 | (9,166 | ) | ||||
| Net cash provided by (used for) operating activities |
4,675 | 7,201 | (6,137 | ) | |||||
| Investing activities |
|||||||||
| Payments for investments in and advances to subsidiaries |
(115,295 | ) | (7,400 | ) | (10 | ) | |||
| Repayment of investments in and advances to subsidiaries |
2,058 | 2,342 | 2,590 | ||||||
| Other, net |
1,436 | (2,912 | ) | (370 | ) | ||||
| Net cash provided by (used for) investing activities |
(111,801 | ) | (7,970 | ) | 2,210 | ||||
| Financing activities |
|||||||||
| Proceeds from junior subordinated debentures |
15,464 | — | — | ||||||
| Proceeds from notes payable |
20,150 | 14,900 | 15,450 | ||||||
| Payments on notes payable |
(8,500 | ) | (10,400 | ) | (8,950 | ) | |||
| Proceeds from sale of preferred stock |
87,631 | — | — | ||||||
| Proceeds from sale of common stock |
258 | 641 | 1,428 | ||||||
| Dividends paid |
(5,313 | ) | (4,934 | ) | (4,905 | ) | |||
| Other, net |
442 | 1,110 | 427 | ||||||
| Net cash provided by financing activities |
110,132 | 1,317 | 3,450 | ||||||
| Net increase (decrease) in cash and cash equivalents |
3,006 | 548 | (477 | ) | |||||
| Cash and cash equivalents at beginning of year |
986 | 438 | 915 | ||||||
| Cash and cash equivalents at end of year |
$ 3,992 | $ 986 | $ 438 | ||||||
F-54
Table of Contents
Index to Financial Statements
PlainsCapital Corporation and subsidiaries
Notes to consolidated financial statements (continued)
27. Recently issued accounting standards
EITF 06-4
In September 2006, the FASB ratified the consensus reached by the Emerging Issues Task Force on EITF Issue No. 06-4, Accounting for Deferred Compensation and Postretirement Benefit Aspects of Endorsement Split-Dollar Life Insurance Arrangements. EITF 06-4 applies to split-dollar life insurance arrangements that provide a benefit to an employee that extends to postretirement periods. The consensus states that employers should recognize a liability for future benefits based on the substantive agreement with the employee.
PlainsCapital adopted EITF 06-4 on January 1, 2008. The cumulative effect of the adoption of EITF 06-4 reduced the balance of retained earnings at January 1, 2008, by $0.7 million.
SFAS 141(R)
In December 2007, the FASB issued SFAS 141(R), Business Combinations. SFAS 141(R) replaces SFAS 141, Business Combinations, and applies to all transactions and other events in which one entity obtains control over one or more other businesses. Departing from the cost-allocation process of SFAS 141, SFAS 141(R) requires an acquirer to recognize the assets acquired, the liabilities assumed, and any noncontrolling interest in the acquiree at the acquisition date, measured at their fair values as of that date. In particular, this provision would prohibit an acquirer of a financial institution from carrying over the acquired entity’s allowance for loan losses. In addition, contingent consideration is recognized and measured at fair value at the acquisition date under the provisions of SFAS 141(R), and acquisition related costs are expensed as incurred. SFAS 141(R) also distinguishes between assets acquired and liabilities assumed arising from contractual contingencies as of the acquisition date and assets or liabilities arising from all other contingencies, requiring different treatment for each type of contingency. SFAS 141(R) is effective for PlainsCapital on January 1, 2009. To the extent business combinations occur on or after the effective date, PlainsCapital’s accounting for those transactions will be significantly affected by the provisions of SFAS 141(R).
SFAS 160
In December 2007, the FASB issued SFAS 160, Noncontrolling Interest in Consolidated Financial Statements, an amendment of ARB Statement No. 5. SFAS 160 amends Accounting Research Bulletin No. 51, Consolidated Financial Statements, to establish accounting and reporting standards for the noncontrolling interest in a subsidiary and for the deconsolidation of a subsidiary. SFAS 160 clarifies that a noncontrolling interest in a subsidiary, also referred to as minority interest, is an ownership interest in the consolidated entity that should be reported as a component of equity in the consolidated financial statements. Among other requirements, SFAS 160 requires consolidated net income to be reported at amounts that include the amounts attributable to both the parent and the minority interest. It also requires disclosure of the amounts of consolidated net income attributable to the parent and the minority interest on the face of the consolidated income statement. SFAS 160 is effective January 1, 2009, for PlainsCapital and is not expected to have a significant effect on its financial position, results of operations, or cash flows.
F-55
Table of Contents
Index to Financial Statements
PlainsCapital Corporation and subsidiaries
Notes to consolidated financial statements (continued)
SFAS 161
In March 2008, the FASB issued SFAS 161, Disclosures about Derivative Instruments and Hedging Activities, and Amendment of FASB Statement No. 133. SFAS 161 amends SFAS 133, requiring expanded disclosure to provide greater transparency about (i) how and why an entity uses derivative instruments, (ii) how derivative instruments and related hedge items are accounted for under SFAS 133 and its related interpretations, and (iii) how derivative instruments and related hedged items affect an entity’s financial position, results of operations and cash flows. To meet those objectives, SFAS 161 requires qualitative disclosures about objectives and strategies for using derivatives, quantitative disclosures about fair value amounts of gains and losses on derivative instruments and disclosures about credit-risk –related contingent features in derivative agreements. SFAS 161 is effective for PlainsCapital January 1, 2009 and is not expected to have a significant effect on its financial position, results of operations, or cash flows.
F-56
Table of Contents
Index to Financial Statements
Consolidated financial statements—unaudited
PlainsCapital Corporation and subsidiaries
Three and Nine months ended September 30, 2009 and 2008
F-57
Table of Contents
Index to Financial Statements
PlainsCapital Corporation and subsidiaries
Consolidated balance sheets—unaudited
(In thousands)
| September 30, 2009 |
December 31, 2008 |
|||||||
| Assets |
||||||||
| Cash and due from banks |
$ | 188,178 | $ | 92,785 | ||||
| Federal funds sold |
26,366 | 21,786 | ||||||
| Assets segregated for regulatory purposes |
17,000 | 11,500 | ||||||
| Loans held for sale |
428,341 | 198,866 | ||||||
| Securities |
||||||||
| Held to maturity, fair market value $274,966 and $217,019, respectively |
270,800 | 217,209 | ||||||
| Available for sale, amortized cost $169,982 and $165,417 respectively |
172,417 | 166,557 | ||||||
| Trading, at fair market value |
36,398 | 1,561 | ||||||
| 479,615 | 385,327 | |||||||
| Loans, gross |
3,056,803 | 2,969,506 | ||||||
| Unearned income |
(4,455 | ) | (3,887 | ) | ||||
| Allowance for loan losses |
(39,799 | ) | (40,672 | ) | ||||
| Loans, net |
3,012,549 | 2,924,947 | ||||||
| Broker/dealer and clearing organization receivables |
221,541 | 45,331 | ||||||
| Fee award receivable |
20,686 | 21,544 | ||||||
| Investment in unconsolidated subsidiaries |
2,012 | 2,012 | ||||||
| Premises and equipment, net |
63,193 | 57,336 | ||||||
| Accrued interest receivable |
15,045 | 16,164 | ||||||
| Other real estate owned |
13,222 | 9,637 | ||||||
| Goodwill, net |
35,880 | 36,486 | ||||||
| Other intangible assets, net |
16,221 | 82 | ||||||
| Other assets |
136,454 | 128,193 | ||||||
| Total assets |
$ | 4,676,303 | $ | 3,951,996 | ||||
| Liabilities and Shareholders’ Equity |
||||||||
| Deposits |
||||||||
| Noninterest-bearing |
$ | 134,798 | $ | 194,901 | ||||
| Interest-bearing |
3,114,974 | 2,731,198 | ||||||
| Total deposits |
3,249,772 | 2,926,099 | ||||||
| Broker/dealer and clearing organization payables |
261,491 | 59,203 | ||||||
| Short-term borrowings |
449,410 | 256,452 | ||||||
| Treasury tax and loan note option account |
2,985 | 3,424 | ||||||
| Capital lease obligation |
8,441 | 8,651 | ||||||
| Notes payable |
70,691 | 151,014 | ||||||
| Junior subordinated debentures |
67,012 | 67,012 | ||||||
| Other liabilities |
133,917 | 78,617 | ||||||
| Total liabilities |
4,243,719 | 3,550,472 | ||||||
| Commitments and contingencies |
||||||||
| Shareholders’ equity |
||||||||
| PlainsCapital Corporation shareholders’ equity |
||||||||
| Preferred stock, $1 par value per share, authorized 50,000,000 shares; |
||||||||
| Series A, 87,631 shares issued |
83,382 | 82,736 | ||||||
| Series B, 4,382 shares issued |
4,827 | 4,895 | ||||||
| Original common stock, $0.001 par value per share, authorized 50,000,000 shares; 31,588,383 and 31,573,518 shares issued, respectively |
32 | 32 | ||||||
| Common stock, $0.001 par value per share, authorized 150,000,000 shares; zero shares issued |
— | — | ||||||
| Surplus |
150,213 | 147,445 | ||||||
| Retained earnings |
194,255 | 167,865 | ||||||
| Accumulated other comprehensive income |
1,848 | 331 | ||||||
| 434,557 | 403,304 | |||||||
| Unearned ESOP shares (320,712 shares) |
(3,489 | ) | (3,489 | ) | ||||
| Total PlainsCapital Corporation shareholders’ equity |
431,068 | 399,815 | ||||||
| Noncontrolling interest |
1,516 | 1,709 | ||||||
| Total shareholders’ equity |
432,584 | 401,524 | ||||||
| Total liabilities and shareholders’ equity |
$ | 4,676,303 | $ | 3,951,996 | ||||
See accompanying notes.
F-58
Table of Contents
Index to Financial Statements
PlainsCapital Corporation and subsidiaries
Consolidated statements of income—unaudited
(In thousands, except per share amounts)
| Three months ended September 30, |
Nine months ended September 30, | |||||||||||
| 2009 | 2008 | 2009 | 2008 | |||||||||
| Interest income: |
||||||||||||
| Loans, including fees |
$ | 46,235 | $ | 44,057 | $ | 133,698 | $ | 139,051 | ||||
| Securities |
3,679 | 2,281 | 11,881 | 6,869 | ||||||||
| Federal funds sold |
42 | 160 | 75 | 421 | ||||||||
| Interest-bearing deposits with banks |
40 | 11 | 65 | 58 | ||||||||
| Other |
1,444 | 154 | 4,227 | 524 | ||||||||
| Total interest income |
51,440 | 46,663 | 149,946 | 146,923 | ||||||||
| Interest expense |
||||||||||||
| Deposits |
8,218 | 10,940 | 24,221 | 37,230 | ||||||||
| Short-term borrowings |
725 | 2,145 | 2,021 | 9,052 | ||||||||
| Capital lease obligation |
108 | 111 | 326 | 278 | ||||||||
| Notes payable |
929 | 863 | 2,549 | 2,377 | ||||||||
| Junior subordinated debentures |
685 | 1,065 | 2,325 | 3,230 | ||||||||
| Other |
165 | — | 550 | — | ||||||||
| Total interest expense |
10,830 | 15,124 | 31,992 | 52,167 | ||||||||
| Net interest income |
40,610 | 31,539 | 117,954 | 94,756 | ||||||||
| Provision for loan losses |
14,310 | 2,635 | 39,073 | 7,818 | ||||||||
| Net interest income after provision for loan losses |
26,300 | 28,904 | 78,881 | 86,938 | ||||||||
| Noninterest income |
||||||||||||
| Service charges on depositor accounts |
2,312 | 2,458 | 6,732 | 7,121 | ||||||||
| Net realized gains on sale of securities |
— | — | 301 | — | ||||||||
| Income from loan origination and net gains from sale of loans |
52,415 | 25,141 | 164,143 | 67,752 | ||||||||
| Trust fees |
1,040 | 1,148 | 2,812 | 3,342 | ||||||||
| Investment advisory fees and commissions |
19,520 | 1,486 | 52,385 | 4,716 | ||||||||
| Securities brokerage fees and commissions |
6,331 | 12 | 16,125 | 45 | ||||||||
| Other |
4,771 | 1,199 | 5,922 | 3,733 | ||||||||
| Total noninterest income |
86,389 | 31,444 | 248,420 | 86,709 | ||||||||
| Noninterest expense |
||||||||||||
| Employees’ compensation and benefits |
61,379 | 28,572 | 171,658 | 81,786 | ||||||||
| Occupancy and equipment, net |
12,923 | 6,961 | 36,166 | 20,007 | ||||||||
| Professional services |
4,209 | 3,356 | 13,128 | 8,620 | ||||||||
| Deposit insurance premium |
1,120 | 388 | 5,168 | 1,176 | ||||||||
| Repossession and foreclosure, net of recoveries |
1,871 | 926 | 3,984 | 2,777 | ||||||||
| Other |
15,912 | 7,385 | 41,331 | 21,336 | ||||||||
| Total noninterest expense |
97,414 | 47,588 | 271,435 | 135,702 | ||||||||
| Income before income taxes |
15,275 | 12,760 | 55,866 | 37,945 | ||||||||
| Income tax provision |
5,523 | 4,582 | 19,991 | 13,448 | ||||||||
| Net income |
9,752 | 8,178 | 35,875 | 24,497 | ||||||||
| Less: Net income attributable to noncontrolling interest |
70 | 52 | 126 | 234 | ||||||||
| Net income attributable to PlainsCapital Corporation |
9,682 | 8,126 | 35,749 | 24,263 | ||||||||
| Dividends on preferred stock and other |
1,381 | — | 4,319 | — | ||||||||
| Income applicable to PlainsCapital Corporation common shareholders |
$ | 8,301 | $ | 8,126 | $ | 31,430 | $ | 24,263 | ||||
| Earnings per common share |
||||||||||||
| Basic |
$ | 0.27 | $ | 0.31 | $ | 1.01 | $ | 0.93 | ||||
| Diluted |
$ | 0.25 | $ | 0.31 | $ | 0.95 | $ | 0.92 | ||||
See accompanying notes.
F-59
Table of Contents
Index to Financial Statements
PlainsCapital Corporation and subsidiaries
Consolidated statements of shareholders’ equity—unaudited
(Dollars in thousands)
| Comprehensive income |
PlainsCapital Corporation shareholders | Noncontrolling interest |
Total |
||||||||||||||||||||||||||||||||||
| Preferred stock | Common stock | Surplus |
Retained earnings |
Accumulated other comprehensive income (loss) |
Unearned ESOP shares |
||||||||||||||||||||||||||||||||
| Shares | Amount | Shares | Amount | ||||||||||||||||||||||||||||||||||
| Balance, January 1, 2008 |
— | $ | — | 26,448,429 | $ | 26 | $ | 89,335 | $ | 149,694 | $ | (1,173 | ) | $ | (3,992 | ) | $ | 1,849 | $ | 235,739 | |||||||||||||||||
| Cumulative effect of the adoption of the Split-Dollar Life Insurance Subsections of the FASB Accounting Standards Codification |
— | — | — | — | — | (676 | ) | — | — | — | (676 | ) | |||||||||||||||||||||||||
| Stock option plans’ activity, including compensation expense |
— | — | 25,863 | — | 410 | — | — | — | — | 410 | |||||||||||||||||||||||||||
| ESOP activity |
— | — | — | — | — | 55 | — | — | — | 55 | |||||||||||||||||||||||||||
| Dividends on common stock ($0.15 per share) |
— | — | — | — | — | (3,971 | ) | — | — | — | (3,971 | ) | |||||||||||||||||||||||||
| Cash distributions to noncontrolling interest |
— | — | — | — | — | — | — | — | (577 | ) | (577 | ) | |||||||||||||||||||||||||
| Comprehensive income: |
|||||||||||||||||||||||||||||||||||||
| Net income |
$ | 24,497 | — | — | — | — | — | 24,263 | — | — | 234 | 24,497 | |||||||||||||||||||||||||
| Other comprehensive income (loss): |
|||||||||||||||||||||||||||||||||||||
| Unrealized gains on securities available for sale, net of tax of $1.5 |
3 | ||||||||||||||||||||||||||||||||||||
| Unrealized losses on securities held in trust for the Supplemental Executive Retirement Plan, net of tax of $287.4 |
(558 | ) | |||||||||||||||||||||||||||||||||||
| Unrealized losses on customer-related cash flow hedges, net of tax of $5.0 |
(9 | ) | |||||||||||||||||||||||||||||||||||
| Other comprehensive loss |
(564 | ) | — | — | — | — | — | — | (564 | ) | — | — | (564 | ) | |||||||||||||||||||||||
| Total comprehensive income |
$ | 23,933 | |||||||||||||||||||||||||||||||||||
| Balance, September 30, 2008 |
— | $ | — | 26,474,292 | $ | 26 | $ | 89,745 | $ | 169,365 | $ | (1,737 | ) | $ | (3,992 | ) | $ | 1,506 | $ | 254,913 | |||||||||||||||||
F-60
Table of Contents
Index to Financial Statements
PlainsCapital Corporation and subsidiaries
Consolidated statements of shareholders’ equity—unaudited (continued)
(Dollars in thousands)
| Comprehensive income |
PlainsCapital Corporation shareholders | Noncontrolling interest |
Total |
|||||||||||||||||||||||||||||||||||
| Preferred stock | Common stock | Surplus |
Retained earnings |
Accumulated other comprehensive income (loss) |
Unearned ESOP shares |
|||||||||||||||||||||||||||||||||
| Shares | Amount | Shares | Amount | |||||||||||||||||||||||||||||||||||
| Balance, January 1, 2009 |
92,013 | $ | 87,631 | 31,573,518 | $ | 32 | $ | 147,445 | $ | 167,865 | $ | 331 | $ | (3,489 | ) | $ | 1,709 | $ | 401,524 | |||||||||||||||||||
| Stock option plans’ activity, including compensation expense |
— | — | 14,928 | — | 2,127 | — | — | — | — | 2,127 | ||||||||||||||||||||||||||||
| Adjustment to stock issued in business combination |
— | — | (63 | ) | — | (1 | ) | — | — | — | — | (1 | ) | |||||||||||||||||||||||||
| Stock-based compensation expense |
— | — | — | — | 642 | — | — | — | — | 642 | ||||||||||||||||||||||||||||
| ESOP activity |
— | — | — | — | — | 32 | — | — | — | 32 | ||||||||||||||||||||||||||||
| Dividends on common stock ($0.15 per share) |
— | — | — | — | — | (5,072 | ) | — | — | — | (5,072 | ) | ||||||||||||||||||||||||||
| Dividends on preferred stock |
— | — | — | — | — | (3,741 | ) | — | — | — | (3,741 | ) | ||||||||||||||||||||||||||
| Preferred stock discount and accretion |
— | 578 | — | — | — | (578 | ) | — | — | — | — | |||||||||||||||||||||||||||
| Cash distributions to noncontrolling interest |
— | — | — | — | — | — | — | — | (319 | ) | (319 | ) | ||||||||||||||||||||||||||
| Comprehensive income: |
||||||||||||||||||||||||||||||||||||||
| Net income |
$ | 35,875 | — | — | — | — | — | 35,749 | — | — | 126 | 35,875 | ||||||||||||||||||||||||||
| Other comprehensive income (loss): |
||||||||||||||||||||||||||||||||||||||
| Unrealized gains on securities available for sale, net of tax of $440.8 |
856 | |||||||||||||||||||||||||||||||||||||
| Unrealized gains on securities held in trust for the Supplemental Executive Retirement Plan, net of tax of $345.3 |
670 | |||||||||||||||||||||||||||||||||||||
| Unrealized losses on customer-related cash flow hedges, net of tax of $5.0 |
(9 | ) | ||||||||||||||||||||||||||||||||||||
| Other comprehensive loss |
1,517 | — | — | — | — | — | — | 1,517 | — | — | 1,517 | |||||||||||||||||||||||||||
| Total comprehensive income |
$ | 37,392 | ||||||||||||||||||||||||||||||||||||
| Balance, September 30, 2009 |
92,013 | $ | 88,209 | 31,588,383 | $ | 32 | $ | 150,213 | $ | 194,255 | $ | 1,848 | $ | (3,489 | ) | $ | 1,516 | $ | 432,584 | |||||||||||||||||||
See accompanying notes.
F-61
Table of Contents
Index to Financial Statements
PlainsCapital Corporation and subsidiaries
Consolidated statements of cash flows—unaudited
(In thousands)
| Nine months ended September 30, |
||||||||
| 2009 | 2008 | |||||||
| Operating Activities |
||||||||
| Net income |
$ | 35,875 | $ | 24,497 | ||||
| Adjustments to reconcile net income to net cash used in operating activities |
||||||||
| Provision for loan losses |
39,073 | 7,818 | ||||||
| Net losses on other real estate owned |
2,903 | 1,311 | ||||||
| Depreciation and amortization |
7,287 | 5,565 | ||||||
| Stock-based compensation expense |
812 | 142 | ||||||
| Net realized gains on sale of securities |
(301 | ) | — | |||||
| Loss (gain) on sale of premises and equipment |
1 | 89 | ||||||
| Stock dividends on securities |
(40 | ) | (446 | ) | ||||
| Deferred income taxes |
4,956 | (586 | ) | |||||
| Payments (deposits) for claims in litigation |
— | 6,816 | ||||||
| Changes in assets segregated for regulatory purposes |
(5,500 | ) | — | |||||
| Changes in trading securities |
(34,837 | ) | — | |||||
| Changes in broker/dealer and clearing organization receivables |
(176,210 | ) | — | |||||
| Changes in fee award receivable |
858 | — | ||||||
| Changes in broker/dealer and clearing organization payables |
202,288 | — | ||||||
| Changes in other assets |
4,724 | (1,617 | ) | |||||
| Changes in other liabilities |
35,767 | (3,334 | ) | |||||
| Net gains from loan origination and sale of loans |
(164,143 | ) | (67,752 | ) | ||||
| Loans originated for sale |
(4,313,972 | ) | (1,688,536 | ) | ||||
| Proceeds from loans sold |
4,223,135 | 1,692,205 | ||||||
| Net cash used in operating activities |
(137,324 | ) | (23,828 | ) | ||||
| Investing Activities |
||||||||
| Proceeds from maturities and principal reductions of securities held to maturity |
25,967 | 3,623 | ||||||
| Proceeds from sales, maturities and principal reductions of securities available for sale |
122,139 | 24,053 | ||||||
| Purchases of securities held to maturity |
(94,123 | ) | (6,317 | ) | ||||
| Purchases of securities available for sale |
(110,322 | ) | (39,235 | ) | ||||
| Net increase in loans |
(141,785 | ) | (120,860 | ) | ||||
| Purchases of premises and equipment and other assets |
(14,996 | ) | (10,042 | ) | ||||
| Proceeds from sales of premises and equipment and other real estate owned |
9,345 | 9,204 | ||||||
| Net cash paid (received) for Federal Home Loan Bank and Federal Reserve Bank stock |
(3,706 | ) | 608 | |||||
| Other, net |
— | (464 | ) | |||||
| Net cash used in investing activities |
(207,481 | ) | (139,430 | ) | ||||
| Financing Activities |
||||||||
| Net increase (decrease) in deposits |
341,242 | (48,585 | ) | |||||
| Net increase in short-term borrowings |
192,958 | 186,980 | ||||||
| Net decrease in treasury tax and loan note option account |
(439 | ) | (246 | ) | ||||
| Proceeds from notes payable |
2,900 | 119,250 | ||||||
| Payments on notes payable |
(83,223 | ) | (107,081 | ) | ||||
| Proceeds from junior subordinated debentures |
— | 15,464 | ||||||
| Proceeds from sale of common stock |
72 | 217 | ||||||
| Dividends paid on preferred and common stock |
(8,203 | ) | (3,971 | ) | ||||
| Cash distributions to noncontrolling interest |
(319 | ) | (577 | ) | ||||
| Other, net |
(210 | ) | (174 | ) | ||||
| Net cash provided by financing activities |
444,778 | 161,277 | ||||||
| Net increase (decrease) in cash and cash equivalents |
99,973 | (1,981 | ) | |||||
| Cash and cash equivalents at beginning of period |
114,571 | 126,422 | ||||||
| Cash and cash equivalents at end of period |
$ | 214,544 | $ | 124,441 | ||||
| Supplemental Disclosures of Cash Flow Information |
||||||||
| Cash paid during the period for: |
||||||||
| Interest |
$ | 32,456 | $ | 56,352 | ||||
| Income taxes |
$ | 10,680 | $ | 11,305 | ||||
| Supplemental Schedule of Noncash Activities |
||||||||
| Conversion of loans to other real estate owned |
$ | 18,612 | $ | 15,654 | ||||
| Capital leases |
$ | — | $ | 4,899 | ||||
See accompanying notes.
F-62
Table of Contents
Index to Financial Statements
PlainsCapital Corporation and Subsidiaries
Notes to Consolidated Interim Financial Statements—unaudited
September 30, 2009
1. Summary of significant accounting and reporting policies
Basis of presentation
The unaudited consolidated financial statements of PlainsCapital Corporation, a Texas corporation, and its subsidiaries (“we,” “us,” “our,” “our company,” or “PlainsCapital”) for the three and nine month periods ended September 30, 2009 and 2008 have been prepared by us pursuant to the rules and regulations of the Securities and Exchange Commission (the “SEC”).
PlainsCapital is a financial holding company registered under the Bank Holding Company Act of 1956, as amended by the Graham-Leach-Bliley Act of 1999, headquartered in Dallas, Texas, that provides, through its subsidiaries, a broad array of products and services. In addition to traditional banking services, PlainsCapital provides residential mortgage lending, investment banking, public finance advisory, wealth and investment management, treasury management, capital equipment leasing, fixed income sales and trading, asset management and correspondent clearing services.
PlainsCapital owns 100% of the outstanding stock of PlainsCapital Bank (the “Bank”) and PlainsCapital Equity, LLC. PlainsCapital owns a 60.9% interest in Hester Capital Management, LLC (“Hester Capital”). The Bank owns 100% of the outstanding stock of PrimeLending, a PlainsCapital Company (“PrimeLending”), PNB Aero Services, Inc., PCB-ARC, Inc. and 90% of the outstanding stock of Plains Financial Corporation (“PFC”). The Bank has a 100% interest in First Southwest Holdings, LLC (“First Southwest”), PlainsCapital Leasing, LLC, and PlainsCapital Securities, LLC, as well as a 51% voting interest in PlainsCapital Insurance Services, LLC.
After the close of business on December 31, 2008, First Southwest Holdings, Inc., a diversified, private investment banking corporation headquartered in Dallas, Texas merged into FSWH Acquisition LLC, a wholly-owned subsidiary of the Bank. Following the merger, FSWH Acquisition LLC changed its name to “First Southwest Holdings, LLC”. The principal subsidiaries of First Southwest are First Southwest Company (“FSC”), a broker-dealer registered with the SEC and the Financial Industry Regulatory Authority (“FINRA”), First Southwest Asset Management, Inc., a registered investment advisor under the Investment Advisors Act of 1940, and First Southwest Leasing Company. Please see Note 2 for further discussion of the acquisition.
The consolidated interim financial statements include the accounts of the above-named entities. All significant intercompany transactions and balances have been eliminated. Noncontrolling interests have been recorded for minority ownership in entities that are not wholly owned and are presented in compliance with the provisions of Noncontrolling Interest in Subsidiary Subsections of the Financial Accounting Standards Board (“FASB”) Accounting Standards Codification (“ASC”), as discussed below.
PlainsCapital also owns 100% of the outstanding common stock of PCC Statutory Trusts I, II, III, and IV (“Trusts”), which are not included in the consolidated financial statements under the requirements of the Variable Interest Entities Subsections of the ASC, because the primary beneficiaries of the Trusts are not within the consolidated group.
F-63
Table of Contents
Index to Financial Statements
PlainsCapital Corporation and subsidiaries
Notes to consolidated interim financial statements Unaudited (continued)
The consolidated interim financial statements of PlainsCapital and subsidiaries are unaudited, but in the opinion of management, contain all adjustments (consisting primarily of normal recurring accruals) necessary for a fair statement of the results of the interim periods presented. The consolidated interim financial statements have been prepared in compliance with accounting principles generally accepted in the United States for interim financial information and with instructions to Form 10-Q adopted by the SEC. Accordingly, the financial statements do not include all of the information and footnotes required by accounting principles generally accepted in the United States for complete financial statements and should be read in conjunction with the audited consolidated financial statements and notes thereto included herein. Results for interim periods are not necessarily indicative of results to be expected for a full year or any future period.
The preparation of financial statements in conformity with accounting principles generally accepted in the United States requires management to make estimates and assumptions that affect the reported amounts of assets and liabilities, the disclosure of contingent assets and liabilities at the date of the financial statements, and the reported amounts of revenues and expenses during the reporting period. Actual results could differ from those estimates. The allowance for loan losses, the fair values of financial instruments and the status of contingencies are particularly subject to change.
Common stock
On August 27, 2009, PlainsCapital shareholders authorized changing the name of our existing class of common stock to “Original Common Stock” and the creation of a new class of common stock with 150 million authorized shares. In addition, shareholders authorized a three-for-one split of PlainsCapital Original Common Stock and a change in the par value of the Original Common Stock from $10 per share to $0.001 per share. These changes became effective August 28, 2009 when PlainsCapital filed its Third Amended and Restated Certificate of Formation with the Texas Secretary of State. PlainsCapital has retrospectively adjusted previously reported share and per share amounts to reflect the stock split and the change in the par value of the Original Common Stock for all periods presented.
Comprehensive income (loss)
PlainsCapital’s comprehensive income (loss) consists of its net income and unrealized holding gains (losses) on its available for sale securities, investments held in trust for the Supplemental Executive Retirement Plan and derivative instruments designated as cash flow hedges.
F-64
Table of Contents
Index to Financial Statements
PlainsCapital Corporation and subsidiaries
Notes to consolidated interim financial statements Unaudited (continued)
The components of accumulated other comprehensive income (loss), net of taxes, at September 30, 2009 and December 31, 2008 are shown in the following table (in thousands):
| September 30, 2009 |
December 31, 2008 |
||||||
| Unrealized gain on securities available for sale |
$ | 1,608 | $ | 752 | |||
| Unrealized gain (loss) on securities held in trust for the Supplemental Executive Retirement Plan |
110 | (561 | ) | ||||
| Unrealized gain on customer-related cash flow hedges |
130 | 140 | |||||
| $ | 1,848 | $ | 331 | ||||
Earnings per common share
On January 1, 2009, PlainsCapital adopted the requirements of the ASC subsections regarding Participating Securities and the Two-Class Method as those requirements relate to the calculation of earnings per common share. The ASC provides that unvested share-based payment awards that contain nonforfeitable rights to dividends or dividend equivalents (whether paid or unpaid) are participating securities and shall be included in the computation of earnings per common share pursuant to the two-class method. PlainsCapital has shares of restricted stock outstanding that are participating securities under the provisions of the ASC. In addition, shares of PlainsCapital stock held in escrow pending the resolution of contingencies with respect to the First Southwest acquisition qualify as participating securities. Accordingly, PlainsCapital has computed earnings per common share using the two-class method described in the ASC beginning January 1, 2009, and has retrospectively adjusted previously reported earnings per common share data to conform to the two-class method.
Noncontrolling interest
On January 1, 2009, PlainsCapital adopted the ASC subsections regarding Noncontrolling Interest in a Subsidiary. The ASC specifies that a noncontrolling interest in a subsidiary, also referred to as minority interest, is an ownership interest in the consolidated entity that should be reported as a component of equity in the consolidated financial statements. Among other requirements, the ASC requires consolidated net income to be reported at amounts that include the amounts attributable to both the parent and the minority interest. The ASC also requires disclosure of the amounts of consolidated net income attributable to the parent and the minority interest on the face of the consolidated income statement. PlainsCapital has applied the provisions of the ASC to its consolidated interim financial statements and retrospectively adjusted previously reported noncontrolling interest amounts to conform to the new ASC provisions.
Subsequent events
PlainsCapital has applied the provisions of the Subsequent Events Topic of the ASC to its consolidated interim financial statements for periods ended after June 15, 2009. The Subsequent Event Topic establishes general standards of accounting for, and disclosure of, events that occur after the balance sheet date but before financial statements are issued or available to be issued.
F-65
Table of Contents
Index to Financial Statements
PlainsCapital Corporation and subsidiaries
Notes to consolidated interim financial statements Unaudited (continued)
In particular, the Subsequent Events Topic sets forth the period after the balance sheet date during which management of a reporting entity should evaluate events or transactions that may occur for potential recognition or disclosure in the financial statements. Accordingly, PlainsCapital has evaluated events and transactions occurring through October 20, 2009, the date the consolidated interim financial statements were issued, for potential recognition or disclosure in the financial statements.
Reclassification
Certain items in the 2008 financial statements have been reclassified to conform to the 2009 presentation.
2. Acquisition
As described in Note 1, First Southwest Holdings, Inc., a diversified, private investment banking corporation headquartered in Dallas, Texas, was merged with and into First Southwest after the close of business December 31, 2008. First Southwest is the surviving entity in the transaction. PlainsCapital’s consolidated income statement includes the operations of First Southwest from January 1, 2009, while the assets and liabilities of First Southwest were included, at estimated fair value, in the consolidated balance sheet at December 31, 2008, the acquisition date.
The acquisition cost of First Southwest Holdings, Inc. was approximately $62.7 million, composed of approximately 5.1 million shares of PlainsCapital Original Common Stock valued at $57.7 million, First Southwest Holdings, Inc. stock options that were converted to PlainsCapital stock options, the estimated fair value of which was $1.9 million as of December 31, 2008, and $3.1 million of transaction costs. The value of $11.33 per share of PlainsCapital Original Common Stock was the product of negotiations between the parties and was supported by an earlier third-party, independent fairness opinion.
In addition, First Southwest has placed approximately 1.7 million shares of PlainsCapital Original Common Stock, valued at approximately $19.2 million, into escrow. The percentage of shares to be released from escrow and distributed to former First Southwest stockholders will be determined based upon the valuation of certain auction rate bonds held by First Southwest prior to the merger (or repurchased from investors following the closing of the merger) as of the last day of December 2012 or, if applicable, the aggregate sales price of such auction rate bonds prior to such date. The release of the escrowed shares will be further adjusted for certain specified losses, if any, during the earnout period. If the value or aggregate sales price, as applicable, of the auction rate bonds is less than 80% of the face value of the auction rate bonds, no shares of PlainsCapital Original Common Stock will be distributed from escrow to former First Southwest stockholders. If the value or aggregate sales price of the auction rate bonds falls between 80% and 90% of face value, former First Southwest stockholders will receive an increasing portion of the PlainsCapital shares held in escrow. If the value or aggregate sales price of the auction rate bonds equals or exceeds 90% of face value, former First Southwest stockholders will receive all of the PlainsCapital shares held in escrow subject to certain specified losses, if any. Any shares issued
F-66
Table of Contents
Index to Financial Statements
PlainsCapital Corporation and subsidiaries
Notes to consolidated interim financial statements Unaudited (continued)
out of the escrow will be accounted for as additional acquisition cost. The auction rate bonds held by First Southwest Holdings, Inc. prior to the merger were purchased by the Bank on December 31, 2008, at the closing of the acquisition.
PlainsCapital used a third-party valuation specialist to assist in the determination of the fair value of assets acquired, including intangibles, and liabilities assumed in the acquisition. The valuation specialist has completed its work and the allocation of the purchase price was finalized in September 2009. The resulting fair values of the assets acquired and liabilities assumed of First Southwest at December 31, 2008 are summarized in the following table (in thousands):
| Due from PlainsCapital (principally auction rate bonds) |
$ | 152,014 | |
| Loans, net |
125,522 | ||
| Broker/dealer and clearing organization receivables |
45,331 | ||
| Fee award receivable |
21,544 | ||
| Identifiable intangible assets |
17,000 | ||
| Assets segregated for regulatory purposes |
11,500 | ||
| Other assets |
38,319 | ||
| Total assets acquired |
411,230 | ||
| Notes payable |
124,217 | ||
| Deposits |
82,079 | ||
| Broker/dealer and clearing organization payables |
59,203 | ||
| Short-term borrowings |
36,500 | ||
| Other liabilities |
33,485 | ||
| Total liabilities assumed |
335,484 | ||
| Net assets acquired |
$ | 75,746 | |
As shown in the table above, PlainsCapital identified $17.0 million of intangible assets, principally customer relationships, during the purchase price allocation. First Southwest began amortizing the cost of intangible assets subject to amortization on a prospective basis beginning July 1, 2009, over periods ranging from 3 to 15 years. Certain of the intangible assets are being amortized on an accelerated basis. First Southwest recorded amortization of $0.8 million for the three and nine months ended September 30, 2009.
The purchase price allocation resulted in net assets acquired in excess of consideration paid of approximately $13.0 million. That amount has been recorded in other liabilities until the contingent consideration issue described previously is settled. Upon resolution of the contingent consideration issue the acquisition cost of First Southwest may increase, resulting in a smaller excess of net assets acquired over consideration paid, or in certain circumstances, an excess of consideration paid over net assets acquired that would result in recording goodwill from the transaction.
F-67
Table of Contents
Index to Financial Statements
PlainsCapital Corporation and subsidiaries
Notes to consolidated interim financial statements Unaudited (continued)
3. Securities
The amortized cost and fair value of securities as of September 30, 2009, and December 31, 2008 are summarized as follows (in thousands):
| Held to maturity | |||||||||||||
| Amortized cost |
Gross unrealized gains |
Gross unrealized losses |
Fair value | ||||||||||
| As of September 30, 2009 |
|||||||||||||
| U. S. government agencies |
|||||||||||||
| Mortgage-backed securities |
$ | 17,739 | $ | 990 | $ | (9 | ) | $ | 18,720 | ||||
| Collateralized mortgage obligations |
40,097 | 745 | (206 | ) | 40,636 | ||||||||
| States and political subdivisions |
107,416 | 4,829 | (777 | ) | 111,468 | ||||||||
| Auction rate bonds |
105,548 | 191 | (1,597 | ) | 104,142 | ||||||||
| Totals |
$ | 270,800 | $ | 6,755 | $ | (2,589 | ) | $ | 274,966 | ||||
| As of December 31, 2008 |
|||||||||||||
| U. S. government agencies |
|||||||||||||
| Mortgage-backed securities |
$ | 19,982 | $ | 585 | $ | — | $ | 20,567 | |||||
| Collateralized mortgage obligations |
29,030 | 171 | (116 | ) | 29,085 | ||||||||
| States and political subdivisions |
57,228 | 474 | (1,304 | ) | 56,398 | ||||||||
| Auction rate bonds |
110,969 | — | — | 110,969 | |||||||||
| Totals |
$ | 217,209 | $ | 1,230 | $ | (1,420 | ) | $ | 217,019 | ||||
| Available for sale | |||||||||||||
| Amortized cost |
Gross unrealized gains |
Gross unrealized losses |
Fair value | ||||||||||
| As of September 30, 2009 |
|||||||||||||
| U. S. government agencies |
|||||||||||||
| Mortgage-backed securities |
$ | 26,533 | $ | 621 | $ | (168 | ) | $ | 26,986 | ||||
| Collateralized mortgage obligations |
74,338 | 1,340 | (68 | ) | 75,610 | ||||||||
| Auction rate bonds |
69,111 | 736 | (26 | ) | 69,821 | ||||||||
| Totals |
$ | 169,982 | $ | 2,697 | $ | (262 | ) | $ | 172,417 | ||||
| As of December 31, 2008 |
|||||||||||||
| U. S. Treasury securities |
$ | 11,920 | $ | 33 | $ | — | $ | 11,953 | |||||
| U. S. government agencies |
|||||||||||||
| Bonds |
10,000 | 38 | — | 10,038 | |||||||||
| Mortgage-backed securities |
35,037 | 708 | (306 | ) | 35,439 | ||||||||
| Collateralized mortgage obligations |
67,848 | 731 | (64 | ) | 68,515 | ||||||||
| Auction rate bonds |
40,612 | — | — | 40,612 | |||||||||
| Totals |
$ | 165,417 | $ | 1,510 | $ | (370 | ) | $ | 166,557 | ||||
F-68
Table of Contents
Index to Financial Statements
PlainsCapital Corporation and subsidiaries
Notes to consolidated interim financial statements Unaudited (continued)
Information regarding securities that were in an unrealized loss position as of September 30, 2009, is shown in the following tables (dollars in thousands):
| As of September 30, 2009 | ||||||||
| Number of securities |
Fair value | Unrealized losses | ||||||
| Held to maturity |
||||||||
| U. S. government agencies |
||||||||
| Mortgage-backed securities |
||||||||
| Unrealized loss for less than twelve months |
1 | $ | 495 | $ | 9 | |||
| Unrealized loss for more than twelve months |
— | — | — | |||||
| 1 | 495 | 9 | ||||||
| Collateralized mortgage obligations |
||||||||
| Unrealized loss for less than twelve months |
3 | 11,657 | 206 | |||||
| Unrealized loss for more than twelve months |
— | — | — | |||||
| 3 | 11,657 | 206 | ||||||
| States and political subdivisions |
||||||||
| Unrealized loss for less than twelve months |
6 | 2,912 | 37 | |||||
| Unrealized loss for more than twelve months |
27 | 11,986 | 740 | |||||
| 33 | 14,898 | 777 | ||||||
| Auction rate bonds |
||||||||
| Unrealized loss for less than twelve months |
4 | 95,261 | 1,597 | |||||
| Unrealized loss for more than twelve months |
— | — | — | |||||
| 4 | 95,261 | 1,597 | ||||||
| Total held to maturity |
||||||||
| Unrealized loss for less than twelve months |
14 | 110,325 | 1,849 | |||||
| Unrealized loss for more than twelve months |
27 | 11,986 | 740 | |||||
| 41 | $ | 122,311 | $ | 2,589 | ||||
| Available for sale |
||||||||
| U. S. government agencies |
||||||||
| Mortgage-backed securities |
||||||||
| Unrealized loss for less than twelve months |
— | $ | — | $ | — | |||
| Unrealized loss for more than twelve months |
1 | 5,046 | 168 | |||||
| 1 | 5,046 | 168 | ||||||
| Collateralized mortgage obligations |
||||||||
| Unrealized loss for less than twelve months |
2 | $ | 22,469 | $ | 68 | |||
| Unrealized loss for more than twelve months |
— | — | — | |||||
| 2 | 22,469 | 68 | ||||||
| Auction rate bonds |
||||||||
| Unrealized loss for less than twelve months |
1 | 22,824 | 26 | |||||
| Unrealized loss for more than twelve months |
— | — | — | |||||
| 1 | 22,824 | 26 | ||||||
| Total available for sale |
||||||||
| Unrealized loss for less than twelve months |
3 | 45,293 | 94 | |||||
| Unrealized loss for more than twelve months |
1 | 5,046 | 168 | |||||
| 4 | $ | 50,339 | $ | 262 | ||||
F-69
Table of Contents
Index to Financial Statements
PlainsCapital Corporation and subsidiaries
Notes to consolidated interim financial statements Unaudited (continued)
Management has the intent and ability to hold the securities classified as held to maturity until they mature, at which time the Bank expects to receive full value for the securities. Management also has the intent and ability to hold the securities classified as available for sale for a period of time sufficient for a recovery of cost. As of September 30, 2009, management believes the impairments detailed in the table are temporary and relate primarily to changes in interest rates. Accordingly, no other-than-temporary impairment loss has been recognized in PlainsCapital’s consolidated statements of income.
The amortized cost and fair value of securities, excluding trading securities, are shown by contractual maturity below (in thousands).
| Securities held to maturity |
Securities available for sale | |||||||||||
| Amortized cost |
Fair value | Amortized cost |
Fair value | |||||||||
| Due in one year or less |
$ | 603 | $ | 624 | $ | — | $ | — | ||||
| Due after one year through five years |
3,051 | 3,196 | — | — | ||||||||
| Due after five years through ten years |
15,980 | 16,360 | — | — | ||||||||
| Due after ten years |
193,330 | 195,430 | 69,111 | 69,821 | ||||||||
| 212,964 | 215,610 | 69,111 | 69,821 | |||||||||
| Mortgage-backed securities |
17,739 | 18,720 | 26,533 | 26,986 | ||||||||
| Collateralized mortgage obligations |
40,097 | 40,636 | 74,338 | 75,610 | ||||||||
| $ | 270,800 | $ | 274,966 | $ | 169,982 | $ | 172,417 | |||||
The Bank did not sell securities in the three months ended September 30, 2009, although, as described below, certain auction rate bonds were called by the issuer. For the nine months ended September 30, 2009, the Bank received proceeds from the sale of available for sale securities of $21.3 million and realized gross gains of $0.3 million. The Bank determines the cost of securities sold by specific identification. The Bank did not sell securities in the nine months ended September 30, 2008.
To address a change in an interpretation of the regulatory requirements regarding the maximum allowed level of investments in certain securities, the Bank transferred auction rate bonds with a net carrying amount of $22.6 million from held to maturity to available for sale in June 2009. The net carrying amount of the transferred securities included an unrealized loss of $0.2 million which was included in other comprehensive income. As of September 30, 2009, the unrealized loss on the transferred securities was less than $50,000.
During the third quarter of 2009, auction rate bonds with a par value of $16.0 million and an unaccreted discount of approximately $1.4 million were called by the issuer. Since First Southwest provides related financing to the issuer, the Bank began accreting the discount over the expected term of financing in the third quarter of 2009.
Securities with a carrying amount of approximately $331.6 million and $231.1 million (fair value of approximately $336.4 million and $232.0 million) at September 30, 2009 and
F-70
Table of Contents
Index to Financial Statements
PlainsCapital Corporation and subsidiaries
Notes to consolidated interim financial statements Unaudited (continued)
December 31, 2008, respectively, were pledged to secure public and trust deposits, federal funds purchased and securities sold under agreements to repurchase, and for other purposes as required or permitted by law. In addition, the Bank had secured a letter of credit from the Federal Home Loan Bank (FHLB) in the amount of $149.0 million and $150.0 million at September 30, 2009 and December 31, 2008, respectively, in lieu of pledging securities to secure certain public deposits.
4. Loans and allowance for loan losses
Loans summarized by category as of September 30, 2009 and December 31, 2008, are as follows (in thousands):
| September 30, 2009 |
December 31, 2008 |
|||||||
| Commercial and industrial |
$ | 1,215,758 | $ | 1,262,456 | ||||
| Lease financing |
84,871 | 101,902 | ||||||
| Construction and land development |
439,115 | 585,320 | ||||||
| Real estate |
1,132,065 | 839,099 | ||||||
| Securities (primarily margin loans) |
134,756 | 129,638 | ||||||
| Consumer |
50,238 | 51,091 | ||||||
| 3,056,803 | 2,969,506 | |||||||
| Unearned income |
(4,455 | ) | (3,887 | ) | ||||
| Allowance for loan losses |
(39,799 | ) | (40,672 | ) | ||||
| $ | 3,012,549 | $ | 2,924,947 | |||||
Impaired (non-accrual) loans totaled approximately $62.5 million and $46.8 million at September 30, 2009 and December 31, 2008, respectively. At September 30, 2009, an allowance of approximately $7.0 million was associated with $57.3 million of impaired loans. At December 31, 2008, an allowance for loan loss of approximately $23.7 million was associated with $44.7 million of impaired loans, a significant portion of which were charged off in the nine months ended September 30, 2009. The average aggregate balance of impaired loans for the three months ended September 30, 2009 and 2008 was approximately $58.0 million and $44.9 million, respectively. For the nine months ended September 30, 2009 and 2008, the average aggregate balance of impaired loans was approximately $54.9 million and $32.7 million, respectively. Interest income recorded on impaired loans for the three and nine months ended September 30, 2009 and 2008 was nominal.
At September 30, 2009 and December 31, 2008, the Bank had loans of approximately $0.1 million and $3.6 million, respectively that were more than 90 days past due, but upon which the Bank continued to accrue interest.
F-71
Table of Contents
Index to Financial Statements
PlainsCapital Corporation and subsidiaries
Notes to consolidated interim financial statements Unaudited (continued)
PlainsCapital Leasing, LLC’s net investment in lease financing at September 30, 2009 and December 31, 2008 is shown in the following table (in thousands).
| September 30, 2009 |
December 31, 2008 |
|||||||
| Future minimum lease payments |
$ | 90,959 | $ | 110,405 | ||||
| Unguaranteed residual value |
946 | 369 | ||||||
| Guaranteed residual value |
2,034 | 2,768 | ||||||
| Initial direct costs, net of amortization |
401 | 589 | ||||||
| Unearned income |
(9,469 | ) | (12,229 | ) | ||||
| $ | 84,871 | $ | 101,902 | |||||
At September 30, 2009 and December 31, 2008, PlainsCapital Leasing, LLC had lease financing receivables of less than $50,000 and $0.3 million, respectively, that were more than 90 days past due, but upon which PlainsCapital Leasing, LLC continued to accrue interest.
Changes in the allowance for loan losses for the three and nine months ended September 30, 2009 and 2008 were as follows (in thousands):
| Three months ended September 30, |
Nine months ended September 30, |
|||||||||||||||
| 2009 | 2008 | 2009 | 2008 | |||||||||||||
| Balance at beginning of period |
$ | 31,778 | $ | 26,799 | $ | 40,672 | $ | 26,517 | ||||||||
| Provision charged to operations |
14,310 | 2,635 | 39,073 | 7,818 | ||||||||||||
| Loans charged-off |
(6,580 | ) | (3,297 | ) | (40,776 | ) | (8,841 | ) | ||||||||
| Recoveries on charged-off loans |
291 | 267 | 830 | 910 | ||||||||||||
| Balance at end of period |
$ | 39,799 | $ | 26,404 | $ | 39,799 | $ | 26,404 | ||||||||
5. Deposits
Deposits at September 30, 2009 and December 31, 2008 are summarized as follows (in thousands):
| September 30, 2009 |
December 31, 2008 | |||||
| Noninterest-bearing demand |
$ | 134,798 | $ | 194,901 | ||
| Interest-bearing: |
||||||
| NOW accounts |
76,280 | 43,753 | ||||
| Money market |
1,630,007 | 970,477 | ||||
| Demand |
48,198 | 65,291 | ||||
| Savings |
138,039 | 151,341 | ||||
| In foreign branches |
119,327 | 136,454 | ||||
| Time—$100,000 and over |
700,978 | 567,149 | ||||
| Time—brokered |
181,245 | 564,378 | ||||
| Time—other |
220,900 | 232,355 | ||||
| $ | 3,249,772 | $ | 2,926,099 | |||
F-72
Table of Contents
Index to Financial Statements
PlainsCapital Corporation and subsidiaries
Notes to consolidated interim financial statements Unaudited (continued)
6. Short-term borrowings
Short-term borrowings at September 30, 2009 and December 31, 2008 were as follows (in thousands):
| September 30, 2009 |
December 31, 2008 | |||||
| Federal funds purchased |
$ | 121,725 | $ | 165,125 | ||
| Securities sold under agreements to repurchase |
41,685 | 73,327 | ||||
| Federal Home Loan Bank (FHLB) and Federal Reserve Bank (FRB) notes |
275,000 | — | ||||
| Short-term bank loans |
11,000 | 18,000 | ||||
| $ | 449,410 | $ | 256,452 | |||
Federal funds purchased and securities sold under agreements to repurchase generally mature daily, on demand, or on some other short-term basis. The Bank and FSC execute transactions to sell securities under agreements to repurchase with both their customers and broker/dealers. Securities involved in these transactions are held by the Bank, FSC, or the dealer. Information concerning federal funds purchased and securities sold under agreements to repurchase is shown in the following table (dollars in thousands):
| Nine months ended September 30, | ||||||
| 2009 | 2008 | |||||
| Average balance during the period |
$ | 216,138 | $ | 177,449 | ||
| Average interest rate during the period |
0.37% | 2.36% | ||||
| September 30, 2009 |
December 31, 2008 | |||||
| Securities underlying the agreements at end of period |
||||||
| Carrying value |
$ | 44,811 | $ | 54,394 | ||
| Estimated fair value |
$ | 45,920 | $ | 54,684 | ||
FHLB notes mature over terms not exceeding 365 days and are secured by FHLB Dallas stock, nonspecified real estate loans, and certain specific commercial real estate loans. FRB notes mature in either 28 or 154 days and are secured primarily by commercial and industrial loans. The weighted average rate on FHLB and FRB notes at September 30, 2009 was 0.75%. No FHLB or FRB notes were outstanding at December 31, 2008.
First Southwest uses short-term bank loans periodically to finance securities owned, customers’ margin accounts, and other short-term operating activities. Interest on the borrowings varies with the federal funds rate. The weighted average interest rate on the borrowings at September 30, 2009 and December 31, 2008 was 1.00% and 1.19%, respectively.
F-73
Table of Contents
Index to Financial Statements
PlainsCapital Corporation and subsidiaries
Notes to consolidated interim financial statements Unaudited (continued)
7. Notes payable
Notes payable at September 30, 2009 and December 31, 2008 consisted of the following (in thousands):
| September 30, 2009 |
December 31, 2008 | |||||
| Federal Home Loan Bank Dallas advances |
$ | 1,563 | $ | 1,647 | ||
| Revolving credit line with JPMorgan Chase not to exceed |
18,900 | 18,000 | ||||
| Revolving credit line with JPMorgan Chase not to exceed |
7,650 | 7,650 | ||||
| Term note with JPMorgan Chase, due July 31, 2010, |
3,500 | 4,000 | ||||
| Term note with JPMorgan Chase, due October 27, 2015, |
500 | 500 | ||||
| Subordinated note with JPMorgan Chase, not to exceed |
20,000 | 20,000 | ||||
| First Southwest nonrecourse notes, due January 25, 2035 |
18,578 | 20,597 | ||||
| Other First Southwest notes payable |
— | 78,620 | ||||
| $ | 70,691 | $ | 151,014 | |||
The revolving credit facilities maturing in July 2010 and the term notes due July 2010 and October 2015 bear interest at LIBOR plus 2.50%. The weighted-rate on those borrowings was 3.0% at September 30, 2009.
Advances under the subordinated note maturing in October 2015 bear interest at LIBOR plus 5.00%. The rate on each of the outstanding advances under the subordinated note at September 30, 2009 was 5.3%.
At the closing of the acquisition described in Note 2, First Southwest had $78.6 million of notes payable that financed the auction rate bonds First Southwest Holdings, Inc. held prior to the acquisition. First Southwest used the proceeds received from the sale of the auction rate bonds to the Bank, as discussed in Note 2, to retire the notes payable in January 2009.
8. Income taxes
PlainsCapital’s effective tax rate was 36.2% and 35.9% for the three months ended September 30, 2009 and 2008, respectively. PlainsCapital’s effective tax rate was 35.8% and 35.4% for the nine months ended September 30, 2009 and 2008, respectively.
F-74
Table of Contents
Index to Financial Statements
PlainsCapital Corporation and subsidiaries
Notes to consolidated interim financial statements Unaudited (continued)
PlainsCapital files income tax returns in the U.S. federal jurisdiction and several U.S. state jurisdictions. PlainsCapital is no longer subject to U.S. federal income tax examinations by tax authorities for years before 2005. The Internal Revenue Service is currently examining PlainsCapital’s federal income tax return for 2006. PlainsCapital does not expect any adjustments resulting from the examination to have a significant impact on its financial position, results of operations, or cash flows.
9. Commitments and contingencies
The Bank acts as agent on behalf of certain correspondent banks in the purchase and sale of federal funds that aggregated $5.1 million and zero at September 30, 2009 and December 31, 2008, respectively.
Legal matters
In November 2006, FSC received subpoenas from the SEC and the DOJ in connection with an investigation of possible antitrust and securities law violations, including bid-rigging, in the procurement of guaranteed investment contracts and other investment products for the reinvestment of bond proceeds by municipalities. The investigation is industry-wide and includes approximately 30 or more firms, including some of the largest U.S. investment firms. To the extent that its participation is requested, FSC will continue to cooperate with these investigations.
As a result of these SEC and DOJ investigations into industry-wide practices, FSC was named as a co-defendant in a series of civil lawsuits filed during 2008 in several different federal courts by various state and local governmental entities suing on behalf of themselves and a purported class of similarly situated governmental entities. A similar set of lawsuits were filed in California state courts by various local governmental entities suing only on behalf of themselves and not on behalf of a putative class. The California state court suits were removed to federal court, and all of the cases have been transferred to federal court in New York. On April 29, 2009, the federal court judge dismissed all claims asserted against FSC and nearly all other defendants from the consolidated putative class action case and granted the lead class plaintiffs until June 18, 2009 to file an amended complaint citing specific instances of alleged anti-competitive behavior by specific individuals at specific defendants. On June 18, 2009, the lead class plaintiffs filed a second consolidated amended class action complaint. This amended complaint did not name FSC as a defendant and did not make any specific allegations of misconduct against FSC or any of its employees. As a result, FSC is no longer a party to the putative class action case. However, FSC is identified in this consolidated amended class action complaint as an alleged co-conspirator with the named defendants. With respect to putative class actions filed in federal court by California plaintiffs that opted not to join in the consolidated class action case, the federal court judge granted those plaintiffs until September 15, 2009 to file an amended complaint. These California putative class plaintiffs also did not name FSC as a defendant and did not make any specific allegations of misconduct against FSC or any of its employees. As a result, FSC is no longer a party
F-75
Table of Contents
Index to Financial Statements
PlainsCapital Corporation and subsidiaries
Notes to consolidated interim financial statements Unaudited (continued)
to these California putative class actions. However, FSC is identified in this complaint as an alleged co-conspirator with the named defendants. With respect to the removed California suits that do not seek class action status, the federal court judge gave the plaintiffs until September 15, 2009 to file an amended complaint. These California plaintiffs filed amended complaints continuing to identify FSC as a named defendant. The few allegations against FSC are very limited in scope. Under the current scheduling order, the defendants in the removed California individual suits have until October 30, 2009 to file dispositive motions.
As part of an industry-wide inquiry by FINRA into sales practices related to auction rate bonds, FSC executed a term sheet in 2008 in which it agreed to pay a fine and to buy back $41.6 million of auction rate bonds at par from a defined class of customers. The fine was paid in 2008, and the auction rate bonds were purchased from these customers in February 2009. FSC recorded a liability of $3.8 million as of December 31, 2008 representing the loss relating to this settlement. In addition, for a 60-day period commencing June 16, 2009, FSC agreed to use its best efforts to provide liquidity to certain other customers not otherwise part of the defined class referenced above. This 60-day period expired on August 14, 2009, and on September 11, 2009, FSC certified to FINRA the results of its best efforts obligation.
PlainsCapital and subsidiaries are defendants in various other legal matters arising in the normal course of business. Management believes that the ultimate liability, if any, arising from these matters will not materially affect the consolidated financial statements.
Other contingencies
PlainsCapital and its subsidiaries lease space, primarily for branch facilities and automated teller machines, under noncancelable operating leases with remaining terms, including renewal options, of 1 to 20 years and under capital leases with remaining terms of 13 to 20 years. Future minimum payments under these leases have not changed significantly from the amounts reported at December 31, 2008 in the audited consolidated financial statements and notes thereto herein. Rental expense under the operating leases was approximately $4.9 million and $2.5 million for the three months ended September 30, 2009 and 2008, respectively. For the nine months ended September 30, 2009 and 2008, rental expense was approximately $13.3 million and $7.0 million, respectively.
10. Financial instruments with off-balance sheet risk
The Bank and PrimeLending are parties to financial instruments with off-balance sheet risk that are used in the normal course of business to meet the financing needs of their customers. These financial instruments include commitments to extend credit and standby letters of credit that involve varying degrees of credit and interest rate risk in excess of the amount recognized in the consolidated financial statements. Such financial instruments are recorded in the financial statements when they are funded or related fees are incurred or received. The contract amounts of those instruments reflect the extent of involvement (and therefore the exposure to credit loss) the Bank and PrimeLending have in particular classes of financial instruments.
F-76
Table of Contents
Index to Financial Statements
PlainsCapital Corporation and subsidiaries
Notes to consolidated interim financial statements Unaudited (continued)
Commitments to extend credit are agreements to lend to a customer provided that the terms established in the contract are met. Commitments generally have fixed expiration dates and may require payment of fees. Because certain commitments are expected to expire without being drawn upon, the total commitment amounts do not necessarily represent future cash requirements. Standby letters of credit are conditional commitments issued to guarantee the performance of a customer to a third party. These guarantees are primarily issued to support public and private borrowing arrangements. The credit risk involved in issuing letters of credit is essentially the same as that involved in extending loan commitments to customers.
The Bank and PrimeLending had in the aggregate outstanding unused commitments to extend credit of $817.5 million at September 30, 2009. The Bank had outstanding standby letters of credit of $43.2 million at September 30, 2009.
The Bank and PrimeLending use the same credit policies in making commitments and standby letters of credit as they do for on-balance sheet instruments. The amount of collateral obtained, if deemed necessary, upon extension of credit is based on management’s credit evaluation of the borrower. Collateral held varies but may include real estate, accounts receivable, marketable securities, interest-bearing deposit accounts, inventory, and property, plant, and equipment.
In the normal course of business, First Southwest executes, settles, and finances various securities transactions that may expose First Southwest to off-balance sheet risk in the event that a customer or counterparty does not fulfill its contractual obligations. Examples of such transactions include the sale of securities not yet purchased by customers or for the account of First Southwest, clearing agreements between First Southwest and various clearinghouses and broker/dealers, secured financing arrangements that involve pledged securities, and when-issued underwriting and purchase commitments.
11. Stock-based compensation
PlainsCapital and subsidiaries have four stock option plans that provide for the granting of stock options to officers and key employees. In addition, PlainsCapital has granted restricted stock to a group of officers and key employees. Compensation cost related to the plans was approximately $0.3 million and less than $50,000 for the three months ended September 30, 2009 and 2008, respectively. For the nine months ended September 30, 2009 and 2008, compensation cost related to the plans was approximately $0.8 million and $0.1 million, respectively.
At September 30, 2009, unrecognized cost related to the stock option plans was approximately $0.2 million. At September 30, 2009, PlainsCapital had 528,000 shares of unvested restricted stock with a grant date fair value of $11.33 per share that is being recorded as compensation expense over the seven-year vesting period. Unrecognized cost related to the restricted stock was $5.3 million at September 30, 2009. The vesting of the restricted stock will automatically accelerate in full upon a change in control or the date upon which our common stock is listed and traded on an exchange registered under the Securities Exchange Act of 1934, as amended (the “Exchange Act”). If the restricted stock vests on an accelerated basis, the entire unrecognized cost related to the restricted stock would be recognized in noninterest expense immediately.
F-77
Table of Contents
Index to Financial Statements
PlainsCapital Corporation and subsidiaries
Notes to consolidated interim financial statements Unaudited (continued)
At September 30, 2009, a total of 76,428 shares were available for grant under the stock option plans. PlainsCapital typically issues new shares upon exercise of option grants.
Information regarding the stock option plans for the nine months ended September 30, 2009 is as follows:
| 2009 | ||||||
| Shares | Weighted average exercise price | |||||
| Outstanding, January 1 |
585,477 | $ | 9.65 | |||
| Options granted in First Southwest acquisition |
285,366 | 4.53 | ||||
| 870,843 | 7.98 | |||||
| Granted |
115,500 | 11.33 | ||||
| Exercised |
(14,928 | ) | 4.82 | |||
| Cancellations and expirations |
(1,863 | ) | 4.83 | |||
| Outstanding, September 30 |
969,552 | 8.43 | ||||
The acquisition described in Note 2 included a provision whereby First Southwest Holdings, Inc. stock options that were outstanding and unexercised at the acquisition date would be converted into PlainsCapital stock options on the same terms and conditions, including vesting conditions, as the First Southwest Holdings, Inc. options they replaced. Accordingly, PlainsCapital granted 285,366 options with a weighted-average exercise price of $4.53 to replace outstanding and unexercised First Southwest Holdings, Inc. stock options.
In August 2009, our shareholders approved the PlainsCapital Corporation 2009 Long-Term Incentive Plan (“2009 Plan”). Adoption of the 2009 Plan is subject to the redemption of all preferred stock held by the U.S. Treasury through the Troubled Asset Relief Program Capital Purchase Program. Once effective, the 2009 Plan will replace the four stock option plans described above and no new awards will be made under those plans.
12. Regulatory matters
The Bank and PlainsCapital are subject to various regulatory capital requirements administered by the federal banking agencies. Failure to meet minimum capital requirements can initiate certain mandatory—and possibly additional discretionary—actions by regulators that, if undertaken, could have a direct, material effect on the consolidated financial statements. The regulations require the companies to meet specific capital adequacy guidelines that involve quantitative measures of assets, liabilities, and certain off-balance sheet items as calculated under regulatory accounting practices. The capital classifications are also subject to qualitative judgments by the regulators about components, risk weightings, and other factors.
Quantitative measures established by regulation to ensure capital adequacy require the companies to maintain minimum amounts and ratios (set forth in the table below) of Tier 1 capital (as defined in the regulations) to total average assets (as defined), and minimum ratios of
F-78
Table of Contents
Index to Financial Statements
PlainsCapital Corporation and subsidiaries
Notes to consolidated interim financial statements Unaudited (continued)
Tier 1 and total capital (as defined) to risk-weighted assets (as defined). A comparison of the Bank’s and PlainsCapital’s actual capital amounts and ratios to the minimum requirements is as follows (dollars in thousands):
| At September 30, 2009 | ||||||||||
| Required | Actual | |||||||||
| Amount | Ratio | Amount | Ratio | |||||||
| PlainsCapital Bank: |
||||||||||
| Tier 1 capital (to average assets) |
$ | 177,369 | 4% | $ | 471,023 | 10.6% | ||||
| Tier 1 capital (to risk-weighted assets) |
148,002 | 4% | 471,023 | 12.7% | ||||||
| Total capital (to risk-weighted assets) |
296,003 | 8% | 510,822 | 13.8% | ||||||
| PlainsCapital Corporation: |
||||||||||
| Tier 1 capital (to average assets) |
$ | 177,486 | 4% | $ | 443,030 | 10.0% | ||||
| Tier 1 capital (to risk-weighted assets) |
148,235 | 4% | 443,030 | 12.0% | ||||||
| Total capital (to risk-weighted assets) |
296,469 | 8% | 502,829 | 13.6% | ||||||
| At December 31, 2008 | ||||||||||
| Required | Actual | |||||||||
| Amount | Ratio | Amount | Ratio | |||||||
| PlainsCapital Bank: |
||||||||||
| Tier 1 capital (to average assets) |
$ | 134,729 | 4% | $ | 456,567 | 13.6% | ||||
| Tier 1 capital (to risk-weighted assets) |
133,404 | 4% | 456,567 | 13.7% | ||||||
| Total capital (to risk-weighted assets) |
266,808 | 8% | 497,239 | 14.9% | ||||||
| PlainsCapital Corporation: |
||||||||||
| Tier 1 capital (to average assets) |
$ | 134,986 | 4% | $ | 428,897 | 12.7% | ||||
| Tier 1 capital (to risk-weighted assets) |
133,669 | 4% | 428,897 | 12.8% | ||||||
| Total capital (to risk-weighted assets) |
267,338 | 8% | 485,569 | 14.5% | ||||||
To be considered adequately capitalized (as defined) under the regulatory framework for prompt corrective action, the Bank must maintain minimum Tier 1 capital to total average assets and Tier 1 capital to risk-weighted assets ratios of 4%, and a total capital to risk-weighted assets ratio of 8%. Based on the actual capital amounts and ratios shown in the table above, the Bank’s ratios place it in the well capitalized (as defined) capital category under the regulatory framework for prompt corrective action. The minimum required capital amounts and ratios for the well capitalized category are summarized as follows (dollars in thousands):
| At September 30, 2009 | ||||||||||
| Required | Actual | |||||||||
| Amount | Ratio | Amount | Ratio | |||||||
| PlainsCapital Bank: |
||||||||||
| Tier 1 capital (to average assets) |
$ | 221,712 | 5% | $ | 471,023 | 10.6% | ||||
| Tier 1 capital (to risk-weighted assets) |
222,002 | 6% | 471,023 | 12.7% | ||||||
| Total capital (to risk-weighted assets) |
370,004 | 10% | 510,822 | 13.8% | ||||||
F-79
Table of Contents
Index to Financial Statements
PlainsCapital Corporation and subsidiaries
Notes to consolidated interim financial statements Unaudited (continued)
| At December 31, 2008 | ||||||||||
| Required | Actual | |||||||||
| Amount | Ratio | Amount | Ratio | |||||||
| PlainsCapital Bank: |
||||||||||
| Tier 1 capital (to average assets) |
$ | 168,411 | 5% | $ | 456,567 | 13.6% | ||||
| Tier 1 capital (to risk-weighted assets) |
200,106 | 6% | 456,567 | 13.7% | ||||||
| Total capital (to risk-weighted assets) |
333,510 | 10% | 497,239 | 14.9% | ||||||
Pursuant to the net capital requirements of Rule 15c3-1 of the Exchange Act, FSC has elected to determine its net capital requirements using the alternative method. Accordingly, FSC is required to maintain minimum net capital, as defined in Rule 15c3-1, equal to the greater of $250,000 or 2% of aggregate debit balances, as defined in Rule 15c3-3. At September 30, 2009, FSC had net capital of $53.1 million; the minimum net capital requirement was $1.7 million; net capital maintained by FSC at September 30, 2009 was 42% of aggregate debits; and net capital in excess of the minimum requirement at September 30, 2009 was $51.4 million.
As a mortgage originator, PrimeLending is subject to minimum net worth requirements established by the United States Department of Housing and Urban Development (“HUD”). PrimeLending determines its compliance with the minimum net worth requirements on an annual basis. As of December 31, 2008, PrimeLending was required to have net worth of $1.0 million. PrimeLending’s adjusted net worth as defined by the Consolidated Audit Guide for Audits of HUD Programs was $8.3 million as of December 31, 2008, resulting in adjusted net worth above the required amount of $7.3 million.
13. Shareholders’ equity
The Bank is subject to certain restrictions on the amount of dividends it may declare without prior regulatory approval. At September 30, 2009, approximately $64.2 million of retained earnings was available for dividend declaration without prior approval from the Federal Reserve Bank.
PlainsCapital must receive the consent of the U.S. Treasury Department to increase the per share amount of dividends paid on our common stock until December 19, 2011, unless we redeem the preferred stock issued pursuant to the Troubled Asset Relief Program (“TARP”) Capital Purchase Program.
14. Assets segregated for regulatory purposes
At September 30, 2009 and December 31, 2008, FSC had segregated $17.0 million and $11.5 million, respectively, of cash and securities in a special reserve account for the benefit of customers under Rule 15c3-3 of the Exchange Act. Assets segregated under the provisions of the Exchange Act are not available for general corporate purposes.
FSC was not required to segregate cash or securities in a special reserve account for the benefit of proprietary accounts of introducing broker-dealers at September 30, 2009 or December 31, 2008.
F-80
Table of Contents
Index to Financial Statements
PlainsCapital Corporation and subsidiaries
Notes to consolidated interim financial statements Unaudited (continued)
15. Broker/dealer and clearing organization receivables and payables
Broker/dealer and clearing organization receivables and payables at September 30, 2009 and December 31, 2008 consisted of the following (in thousands):
| September 30, 2009 |
December 31, 2008 | |||||
| Receivables |
||||||
| Securities borrowed |
$ | 217,806 | $ | 43,871 | ||
| Securities failed to deliver |
2,513 | 80 | ||||
| Clearing organizations |
1,017 | 1,085 | ||||
| Due from dealers |
205 | 295 | ||||
| $ | 221,541 | $ | 45,331 | |||
| Payables |
||||||
| Securities loaned |
$ | 219,602 | $ | 43,437 | ||
| Correspondents |
36,439 | 15,229 | ||||
| Securities failed to receive |
2,927 | 82 | ||||
| Clearing organizations |
2,523 | 455 | ||||
| $ | 261,491 | $ | 59,203 | |||
16. Fair value measurements
Fair value measurements and disclosures
On January 1, 2008, PlainsCapital adopted the Fair Value Measurements and Disclosures Topic of the ASC (“Fair Value Topic”). The Fair Value Topic defines fair value, establishes a framework for measuring fair value in generally accepted accounting principles, and expands disclosures about fair value measurements. The Fair Value Topic defines fair value as the price that would be received to sell an asset or paid to transfer a liability in an orderly transaction between market participants. The Fair Value Topic assumes that transactions upon which fair value measurements are based occur in the principal market for the asset or liability being measured. Further, fair value measurements made under The Fair Value Topic exclude transaction costs and are not the result of forced transactions.
The Fair Value Topic creates a fair value hierarchy that classifies fair value measurements based upon the inputs used in valuing the assets or liabilities that are the subject of fair value measurements. The fair value hierarchy gives the highest priority to quoted prices in active markets for identical assets or liabilities and the lowest priority to unobservable inputs, as indicated below.
| • | Level 1 Inputs: Unadjusted quoted prices in active markets for identical assets or liabilities that PlainsCapital can access at the measurement date. |
F-81
Table of Contents
Index to Financial Statements
PlainsCapital Corporation and subsidiaries
Notes to consolidated interim financial statements Unaudited (continued)
| • | Level 2 Inputs: Observable inputs other than Level 1 prices. Level 2 inputs include quoted prices for similar assets or liabilities in active markets, quoted prices for identical or similar assets or liabilities in markets that are not active, inputs other than quoted prices that are observable for the asset or liability (e.g. interest rates and credit risks), and inputs that are derived from or corroborated by market data, among others. |
| • | Level 3 Inputs: Unobservable inputs that reflect an entity’s own assumptions about the assumptions that market participants would use in pricing the assets or liabilities. Level 3 inputs include pricing models and discounted cash flow techniques, among others. |
Fair value option
On January 1, 2008, PlainsCapital adopted the Fair Value Option Subsections of the ASC (“Fair Value Option”). The Fair Value Option permits entities to choose to measure many financial instruments and certain other items at fair value. PlainsCapital has elected to measure substantially all of PrimeLending’s mortgage loans held for sale and certain time deposits at fair value. PlainsCapital elected to apply the provisions of the Fair Value Option to these items so that it would have the opportunity to mitigate volatility in reported earnings caused by measuring related assets and liabilities differently without having to apply complex hedge accounting provisions. PlainsCapital determines the fair value of the financial instruments accounted for under the provisions of the Fair Value Option in compliance with the provisions of the Fair Value Topic discussed above.
At September 30, 2009, the aggregate fair value of PrimeLending loans held for sale accounted for under the Fair Value Option was $426.9 million, while the unpaid principal balance of those loans was $417.6 million. At December 31, 2008, the aggregate fair value of PrimeLending loans held for sale accounted for under the Fair Value Option was $192.3 million, while the unpaid principal balance of those loans was $188.1 million. The fair value excludes interest, which is reported as interest income on loans in the income statement.
PlainsCapital holds a number of financial instruments that are measured at fair value on a recurring basis, either by the application of the Fair Value Option or other authoritative pronouncements. The fair values of those instruments are determined primarily using Level 2 inputs. Those inputs include quotes from mortgage loan investors and derivatives dealers, data from an independent pricing service and rates paid in the brokered certificate of deposit market.
At September 30, 2009, the Bank held one mortgage-backed security issued by FNMA that the Bank was unable to price due to the terms and conditions of the instrument. As a result, the Bank determined that fair value was equal to book value using Level 3 inputs. In addition, the Bank holds auction rate bonds purchased as a result of the First Southwest acquisition. The estimated fair value of the auction rate bonds was determined by a third-party valuation specialist using Level 3 inputs, primarily due to the lack of observable market data. Inputs for the valuation were developed using terms of the auction rate bonds, market interest rates, asset appropriate credit transition matrices and recovery rates, and assumptions regarding the term to maturity of the
F-82
Table of Contents
Index to Financial Statements
PlainsCapital Corporation and subsidiaries
Notes to consolidated interim financial statements Unaudited (continued)
auction rate bonds. The following table reconciles the beginning and ending balances of assets measured at fair value using Level 3 inputs (in thousands).
| Mortgage- backed securities |
Auction rate bonds |
Total | ||||||||
| Balance, January 1, 2009 |
$ | 6,190 | $ | 40,612 | $ | 46,802 | ||||
| Unrealized gains in other comprehensive income, net |
— | 710 | 710 | |||||||
| Transfers from held to maturity |
— | 22,800 | 22,800 | |||||||
| Purchases, issuances and settlements, net |
(55 | ) | 5,699 | 5,644 | ||||||
| Balance, September 30, 2009 |
$ | 6,135 | $ | 69,821 | $ | 75,956 | ||||
In the table above, settlements include premium amortization and discount accretion.
The following tables present information regarding financial assets and liabilities measured at fair value on a recurring basis, including changes in fair value for those instruments that are reported at fair value under an election under the Fair Value Option (in thousands).
| At September 30, 2009 | ||||||||||||||
| Level 1 inputs |
Level 2 inputs |
Level 3 inputs |
Total fair value |
|||||||||||
| Loans held for sale |
$ | — | $ | 426,895 | $ | — | $ | 426,895 | ||||||
| Securities available for sale |
— | 96,461 | 75,956 | 172,417 | ||||||||||
| Trading securities |
— | 36,398 | — | 36,398 | ||||||||||
| Derivative assets |
— | 4,824 | — | 4,824 | ||||||||||
| Time deposits |
— | 1,478 | — | 1,478 | ||||||||||
| Derivative liabilities |
— | (90 | ) | — | (90 | ) | ||||||||
| Changes in fair value for assets and liabilities reported at fair value under fair value option |
||||||||||||||||||||||
| Three months ended September 30, 2009 |
Three months ended September 30, 2008 |
|||||||||||||||||||||
| Net gains from sale of loans |
Other noninterest income |
Total changes in fair value |
Net gains from sale of loans |
Other noninterest income |
Total changes in fair value |
|||||||||||||||||
| Loans held for sale |
$ | 2,184 | $ | — | $ | 2,184 | $ | 349 | $ | — | $ | 349 | ||||||||||
| Time deposits |
— | (25 | ) | (25 | ) | — | (22 | ) | (22 | ) | ||||||||||||
| Nine months ended September, 2009 |
Nine months ended September, 2008 | |||||||||||||||||||
| Net gains from sale of loans |
Other noninterest income |
Total changes in fair value |
Net gains from sale of loans |
Other noninterest income |
Total changes in fair value | |||||||||||||||
| Loans held for sale |
$ | 5,159 | $ | — | $ | 5,159 | $ | 2,131 | $ | — | $ | 2,131 | ||||||||
| Time deposits |
— | (88 | ) | (88 | ) | — | 168 | 168 | ||||||||||||
PlainsCapital also determines the fair value of assets and liabilities on a non-recurring basis. For example, facts and circumstances may dictate a fair value measurement when there is evidence
F-83
Table of Contents
Index to Financial Statements
PlainsCapital Corporation and subsidiaries
Notes to consolidated interim financial statements Unaudited (continued)
of impairment. Assets and liabilities measured on a non-recurring basis include the items discussed below.
Impaired (Non-accrual) Loans—PlainsCapital reports non-accrual loans at fair value through allocations of the allowance for loan losses. PlainsCapital determines fair value using Level 2 inputs consisting of observable loss experience for similar loans. At September 30, 2009, loans with a carrying amount of $57.3 million had been reduced by allocations of the allowance for loan losses of $7.0 million, resulting in a reported fair value of $50.3 million.
Other Real Estate Owned—PlainsCapital reports other real estate owned at fair value through use of valuation allowances that are charged against the allowance for loan losses when property is initially transferred to other real estate. Subsequent to the initial transfer to other real estate, valuation allowances are charged against earnings. PlainsCapital determines fair value using Level 2 inputs consisting of independent appraisals. At September 30, 2009, the estimated fair value of other real estate owned was $13.2 million.
The Fair Value of Financial Instruments Subsection of the ASC requires disclosure of the fair value of financial assets and liabilities, including the financial assets and liabilities previously discussed. The methods for determining estimated fair value for financial assets and liabilities is described in detail in Note 20 to the consolidated financial statements included in Amendment No. 1 to our registration statement on Form S-1 filed with the SEC on October 21, 2009.
The estimated fair values of PlainsCapital’s financial instruments are shown below (in thousands):
| At September 30, 2009 | At December 31, 2008 | |||||||||||||||
| Carrying amount |
Estimated fair value |
Carrying amount |
Estimated fair value |
|||||||||||||
| Financial assets |
||||||||||||||||
| Cash and short-term investments |
$ | 214,544 | $ | 214,544 | $ | 114,571 | $ | 114,571 | ||||||||
| Assets segregated for regulatory purposes |
17,000 | 17,000 | 11,500 | 11,500 | ||||||||||||
| Loans held for sale |
428,341 | 428,341 | 198,866 | 198,866 | ||||||||||||
| Securities |
479,615 | 483,781 | 385,327 | 385,137 | ||||||||||||
| Loans, net |
3,012,549 | 3,045,068 | 2,924,947 | 2,953,643 | ||||||||||||
| Broker/dealer and clearing organization receivables |
221,541 | 221,541 | 45,331 | 45,331 | ||||||||||||
| Fee award receivable |
20,686 | 20,686 | 21,544 | 21,544 | ||||||||||||
| Cash surrender value of life insurance policies |
21,199 | 21,199 | 20,698 | 20,698 | ||||||||||||
| Interest rate swaps, IRLCs and forward purchase commitments |
4,824 | 4,824 | 3,409 | 3,409 | ||||||||||||
| Accrued interest receivable |
15,045 | 15,045 | 16,164 | 16,164 | ||||||||||||
| Financial liabilities |
||||||||||||||||
| Deposits |
3,249,772 | 3,256,625 | 2,926,099 | 3,137,686 | ||||||||||||
| Broker/dealer and clearing organization payables |
261,491 | 261,491 | 59,203 | 59,203 | ||||||||||||
| Short-term borrowings |
449,410 | 449,410 | 256,452 | 256,452 | ||||||||||||
| Debt |
140,688 | 140,688 | 221,450 | 221,450 | ||||||||||||
| Forward purchase commitments |
(90 | ) | (90 | ) | (56 | ) | (56 | ) | ||||||||
| Accrued interest payable |
5,537 | 5,537 | 6,001 | 6,001 | ||||||||||||
F-84
Table of Contents
Index to Financial Statements
PlainsCapital Corporation and subsidiaries
Notes to consolidated interim financial statements Unaudited (continued)
17. Derivative financial instruments
The Bank and PrimeLending use various derivative financial instruments to mitigate interest rate risk. The Bank’s interest rate risk management strategy involves effectively modifying the re-pricing characteristics of certain assets and liabilities so that changes in interest rates do not adversely affect the net interest margin. PrimeLending has interest rate risk relative to its inventory of mortgage loans held for sale and interest rate lock commitments (“IRLC”s). PrimeLending is exposed to such rate risk from the time an IRLC is made to an applicant to the time the related mortgage loan is sold.
Cash flow hedges
The Bank entered into interest rate swap agreements to manage interest rate risk associated with certain customer contracts. The swaps were originally designated as cash flow hedges. The swaps were highly effective in offsetting future cash flow volatility caused by changes in interest rates. The Bank has recorded the fair value of the swaps in other assets, and unrealized gains (losses) associated with the swaps in other comprehensive income.
Non-hedging derivative instruments and the fair value option
As discussed in Note 16, PlainsCapital adopted the Fair Value Option on January 1, 2008. At adoption, PrimeLending elected to measure substantially all mortgage loans held for sale at fair value on a prospective basis. The election provides PrimeLending the opportunity to mitigate volatility in reported earnings caused by measuring related assets and liabilities differently without applying complex hedge accounting provisions. PrimeLending provides IRLCs to its customers and executes forward purchase commitments to sell mortgage loans. The fair values of both IRLCs and purchase commitments are recorded in other assets or other liabilities, as appropriate. Changes in the fair values of these derivative instruments produced net gains of approximately $0.6 million and $1.4 million for the three months ended September 30, 2009 and 2008, respectively. For the nine months ended September 30, 2009 and 2008, changes in the fair values of these derivative instruments produced net gains of $1.4 million and $2.6 million, respectively. The net gains or losses were recorded as a component of gain on sale of loans.
Derivative positions at September 30, 2009 and December 31, 2008 are presented in the following table (in thousands):
| At September 30, 2009 |
At December 31, 2008 |
|||||||||||||
| Notional amount |
Estimated fair value |
Notional amount |
Estimated fair value |
|||||||||||
| Non-hedging derivative instruments |
||||||||||||||
| IRLCs |
$ | 383,539 | $ | 6,502 | $ | 219,700 | $ | 4,041 | ||||||
| Interest rate swaps |
9,469 | (61 | ) | 14,969 | (156 | ) | ||||||||
| Forward purchase commitments |
294,097 | (1,527 | ) | 280,795 | (421 | ) | ||||||||
F-85
Table of Contents
Index to Financial Statements
PlainsCapital Corporation and subsidiaries
Notes to consolidated interim financial statements Unaudited (continued)
The Bank recorded unrealized gains (losses), net of reclassifications adjustments, on the swaps designated as cash flow hedges in other comprehensive income as shown in the following table (in thousands).
| Three months ended September 30, 2009 |
Three months ended September 30, 2008 |
|||||||||||||||||||||
| Before-tax amount |
Tax benefit (expense) |
After-tax amount |
Before-tax amount |
Tax benefit (expense) |
After-tax amount |
|||||||||||||||||
| Change in market value |
$ | — | $ | — | $ | — | $ | — | $ | — | $ | — | ||||||||||
| Reclassification adjustments |
(5 | ) | 2 | (3 | ) | (5 | ) | 2 | (3 | ) | ||||||||||||
| Other comprehensive income (loss) |
$ | (5 | ) | $ | 2 | $ | (3 | ) | $ | (5 | ) | $ | 2 | $ | (3 | ) | ||||||
| Nine months ended September 30, 2009 |
Nine months ended September 30, 2008 |
|||||||||||||||||||||
| Before-tax amount |
Tax benefit (expense) |
After-tax amount |
Before-tax amount |
Tax benefit (expense) |
After-tax amount |
|||||||||||||||||
| Change in market value |
$ | — | $ | — | $ | — | $ | — | $ | — | $ | — | ||||||||||
| Reclassification adjustments |
(14 | ) | 5 | (9 | ) | (14 | ) | 5 | (9 | ) | ||||||||||||
| Other comprehensive income (loss) |
$ | (14 | ) | $ | 5 | $ | (9 | ) | $ | (14 | ) | $ | 5 | $ | (9 | ) | ||||||
18. Segment and related information
PlainsCapital has three reportable segments that are organized primarily by the core products offered to the segments’ respective customers. The Banking segment includes the operations of the Bank and PlainsCapital Leasing, LLC. The operations of PrimeLending comprise the Mortgage Origination segment. The Financial Advisory segment is composed of Hester Capital and, as of December 31, 2008, First Southwest.
During the third quarter of 2009, PlainsCapital changed its segment reporting. Previously, the operations of PlainsCapital Corporation and its remaining subsidiaries (collectively, the “Holding Company”) were not allocated to the segments. Beginning in the third quarter, we adopted a new procedure for determining segment results. First, we eliminated intercompany transactions from the segments and certain noninterest expenses from the Bank. Second, we allocated the net expenses of the Holding Company among the three reporting segments based upon each segment’s relative net income. Finally, we reallocated the noninterest expenses of the Bank, removed above, among the three segments based upon the annual determination of senior managers regarding the allocation of management time and resources. Senior management believes this procedure assists with the allocation of corporate resources and decisions regarding capital investment.
Balance sheet amounts for the Holding Company are included in “All other and Eliminations.” We have restated segment results for prior periods for comparison purposes.
F-86
Table of Contents
Index to Financial Statements
PlainsCapital Corporation and subsidiaries
Notes to consolidated interim financial statements Unaudited (continued)
The following tables present information about the revenues, profits and assets of PlainsCapital’s reportable segments (in thousands). The assets of First Southwest are reflected in the Financial Advisory segment as of December 31, 2008, and the operations of First Southwest are reflected in the results of the Financial Advisory segment beginning January 1, 2009.
Income Statement Data
| Three months ended September 30, 2009 | |||||||||||||
| Banking | Mortgage origination |
Financial advisory |
PlainsCapital consolidated | ||||||||||
| Interest income |
$ | 49,163 | $ | 98 | $ | 2,179 | $ | 51,440 | |||||
| Interest expense |
9,577 | 416 | 837 | 10,830 | |||||||||
| Net interest income |
39,586 | (318 | ) | 1,342 | 40,610 | ||||||||
| Provision for loan losses |
14,310 | — | — | 14,310 | |||||||||
| Noninterest income |
4,595 | 52,421 | 29,373 | 86,389 | |||||||||
| Noninterest expense |
23,203 | 46,626 | 27,585 | 97,414 | |||||||||
| Net income (loss) before taxes |
6,668 | 5,477 | 3,130 | 15,275 | |||||||||
| Income tax provision (benefit) |
2,408 | 2,001 | 1,114 | 5,523 | |||||||||
| Consolidated net income (loss) |
4,260 | 3,476 | 2,016 | 9,752 | |||||||||
| Less: Net income attributable to noncontrolling interest |
— | — | 70 | 70 | |||||||||
| Net income (loss) attributable to PlainsCapital Corporation |
$ | 4,260 | $ | 3,476 | $ | 1,946 | $ | 9,682 | |||||
| Nine months ended September 30, 2009 | |||||||||||||
| Banking | Mortgage origination |
Financial advisory |
PlainsCapital consolidated | ||||||||||
| Interest income |
$ | 142,965 | $ | 758 | $ | 6,223 | $ | 149,946 | |||||
| Interest expense |
27,649 | 1,896 | 2,447 | 31,992 | |||||||||
| Net interest income |
115,316 | (1,138 | ) | 3,776 | 117,954 | ||||||||
| Provision for loan losses |
39,073 | — | — | 39,073 | |||||||||
| Noninterest income |
12,848 | 163,349 | 72,223 | 248,420 | |||||||||
| Noninterest expense |
70,528 | 130,880 | 70,027 | 271,435 | |||||||||
| Net income (loss) before taxes |
18,563 | 31,331 | 5,972 | 55,866 | |||||||||
| Income tax provision (benefit) |
6,629 | 11,262 | 2,100 | 19,991 | |||||||||
| Consolidated net income (loss) |
11,934 | 20,069 | 3,872 | 35,875 | |||||||||
| Less: Net income attributable to noncontrolling interest |
— | — | 126 | 126 | |||||||||
| Net income (loss) attributable to PlainsCapital Corporation |
$ | 11,934 | $ | 20,069 | $ | 3,746 | $ | 35,749 | |||||
F-87
Table of Contents
Index to Financial Statements
PlainsCapital Corporation and subsidiaries
Notes to consolidated interim financial statements Unaudited (continued)
| Three months ended september 30, 2008 | |||||||||||||
| Banking | Mortgage origination |
Financial advisory |
PlainsCapital consolidated | ||||||||||
| Interest income |
$ | 46,074 | $ | 589 | $ | — | $ | 46,663 | |||||
| Interest expense |
14,854 | 267 | 3 | 15,124 | |||||||||
| Net interest income |
31,220 | 322 | (3 | ) | 31,539 | ||||||||
| Provision for loan losses |
2,635 | — | — | 2,635 | |||||||||
| Noninterest income |
4,862 | 25,157 | 1,425 | 31,444 | |||||||||
| Noninterest expense |
22,840 | 23,342 | 1,406 | 47,588 | |||||||||
| Net income (loss) before taxes |
10,607 | 2,137 | 16 | 12,760 | |||||||||
| Income tax provision (benefit) |
3,818 | 776 | (12 | ) | 4,582 | ||||||||
| Consolidated net income (loss) |
6,789 | 1,361 | 28 | 8,178 | |||||||||
| Less: Net income attributable to noncontrolling interest |
— | — | 52 | 52 | |||||||||
| Net income (loss) attributable to PlainsCapital Corporation |
$ | 6,789 | $ | 1,361 | $ | (24 | ) | $ | 8,126 | ||||
| Nine months ended september 30, 2008 | |||||||||||||
| Banking | Mortgage origination |
Financial advisory |
PlainsCapital consolidated | ||||||||||
| Interest income |
$ | 145,361 | $ | 1,560 | $ | 2 | $ | 146,923 | |||||
| Interest expense |
51,502 | 642 | 23 | 52,167 | |||||||||
| Net interest income |
93,859 | 918 | (21 | ) | 94,756 | ||||||||
| Provision for loan losses |
7,818 | — | — | 7,818 | |||||||||
| Noninterest income |
15,706 | 66,476 | 4,527 | 86,709 | |||||||||
| Noninterest expense |
68,639 | 62,740 | 4,323 | 135,702 | |||||||||
| Net income (loss) before taxes |
33,108 | 4,654 | 183 | 37,945 | |||||||||
| Income tax provision (benefit) |
11,796 | 1,669 | (17 | ) | 13,448 | ||||||||
| Consolidated net income (loss) |
21,312 | 2,985 | 200 | 24,497 | |||||||||
| Less: Net income attributable to noncontrolling interest |
— | — | 234 | 234 | |||||||||
| Net income (loss) attributable to PlainsCapital Corporation |
$ | 21,312 | $ | 2,985 | $ | (34 | ) | $ | 24,263 | ||||
F-88
Table of Contents
Index to Financial Statements
PlainsCapital Corporation and subsidiaries
Notes to consolidated interim financial statements Unaudited (continued)
Balance Sheet Data
| September 30, 2009 | |||||||||||
| Banking | Mortgage origination |
Financial advisory |
All other and eliminations |
PlainsCapital consolidated | |||||||
| Cash and due from banks |
$ 186,852 | $ 38,867 | $ 4,759 | $ (42,300 | ) | $ 188,178 | |||||
| Loans held for sale |
1,446 | 426,895 | — | — | 428,341 | ||||||
| Securities |
443,217 | — | 36,398 | — | 479,615 | ||||||
| Loans, net |
2,870,434 | — | 143,418 | (1,303 | ) | 3,012,549 | |||||
| Broker/dealer and clearing organization receivables |
— | — | 221,541 | — | 221,541 | ||||||
| Investment in subsidiaries |
660,270 | — | — | (660,270 | ) | — | |||||
| Goodwill |
7,862 | 23,706 | 4,312 | — | 35,880 | ||||||
| Other assets |
191,846 | 16,149 | 81,457 | 20,747 | 310,199 | ||||||
| Total assets |
$4,361,927 | $505,617 | $491,885 | $(683,126 | ) | $4,676,303 | |||||
| Deposits |
$3,259,638 | $ — | $ 56,802 | $ (66,668 | ) | $3,249,772 | |||||
| Broker/dealer and clearing organization payables |
— | — | 261,491 | — | 261,491 | ||||||
| Short-term borrowings |
438,410 | — | 11,000 | — | 449,410 | ||||||
| Notes payable |
77,146 | 402,484 | 29,579 | (438,518 | ) | 70,691 | |||||
| Junior subordinated debentures |
— | — | — | 67,012 | 67,012 | ||||||
| Other liabilities |
56,125 | 39,165 | 59,886 | (9,833 | ) | 145,343 | |||||
| PlainsCapital Corporation shareholders’ equity |
530,608 | 63,968 | 73,127 | (236,635 | ) | 431,068 | |||||
| Noncontrolling interest |
— | — | — | 1,516 | 1,516 | ||||||
| Total liabilities and shareholders’ equity |
$4,361,927 | $505,617 | $491,885 | $(683,126 | ) | $4,676,303 | |||||
F-89
Table of Contents
Index to Financial Statements
PlainsCapital Corporation and subsidiaries
Notes to consolidated interim financial statements Unaudited (continued)
| December 31, 2008 | ||||||||||||||||
| Banking | Mortgage origination |
Financial advisory |
All other and eliminations |
Plainscapital consolidated | ||||||||||||
| Cash and due from banks |
$ | 93,190 | $ | 9,344 | $ | 5,554 | $ | (15,303 | ) | $ | 92,785 | |||||
| Loans held for sale |
6,605 | 192,261 | — | — | 198,866 | |||||||||||
| Securities |
383,766 | — | 1,561 | — | 385,327 | |||||||||||
| Loans, net |
2,825,914 | — | 125,522 | (26,489 | ) | 2,924,947 | ||||||||||
| Broker/dealer and clearing organization receivables |
— | — | 45,331 | — | 45,331 | |||||||||||
| Investment in subsidiaries |
394,942 | — | — | (394,942 | ) | — | ||||||||||
| Goodwill |
7,862 | 24,312 | 4,312 | — | 36,486 | |||||||||||
| Other assets |
179,168 | 8,655 | 218,226 | (137,795 | ) | 268,254 | ||||||||||
| Total assets |
$ | 3,891,447 | $ | 234,572 | $ | 400,506 | $ | (574,529 | ) | $ | 3,951,996 | |||||
| Deposits |
$ | 2,870,304 | $ | — | $ | 82,079 | $ | (26,284 | ) | $ | 2,926,099 | |||||
| Broker/dealer and clearing organization payables |
— | — | 59,203 | — | 59,203 | |||||||||||
| Short-term borrowings |
219,952 | — | 36,500 | — | 256,452 | |||||||||||
| Notes payable |
102,666 | 182,061 | 124,217 | (257,930 | ) | 151,014 | ||||||||||
| Junior subordinated debentures |
— | — | — | 67,012 | 67,012 | |||||||||||
| Other liabilities |
200,968 | 14,598 | 31,730 | (156,604 | ) | 90,692 | ||||||||||
| PlainsCapital Corporation shareholders’ equity |
497,557 | 37,913 | 66,777 | (202,432 | ) | 399,815 | ||||||||||
| Noncontrolling interest |
— | — | — | 1,709 | 1,709 | |||||||||||
| Total liabilities and shareholders’ equity |
$ | 3,891,447 | $ | 234,572 | $ | 400,506 | $ | (574,529 | ) | $ | 3,951,996 | |||||
F-90
Table of Contents
Index to Financial Statements
PlainsCapital Corporation and subsidiaries
Notes to consolidated interim financial statements Unaudited (continued)
19. Earnings per common share
The following table presents the computation of basic and diluted earnings per common share for the three and nine months ended September 30, 2009 and 2008 (in thousands, except per share data).
| Three months ended September 30, |
Nine months ended September 30, | |||||||||||
| 2009 | 2008 | 2009 | 2008 | |||||||||
| Income applicable to PlainsCapital Corporation common shareholders |
$ | 8,301 | $ | 8,126 | $ | 31,430 | $ | 24,263 | ||||
| Less: income applicable to particpating securities |
531 | — | 2,057 | - | ||||||||
| Income applicable to PlainsCapital Corporation common shareholders for basicearnings per common share |
$ | 7,770 | $ | 8,126 | $ | 29,373 | $ | 24,263 | ||||
| Weighted-average shares outstanding |
31,267,671 | 26,107,377 | 31,255,362 | 26,101,797 | ||||||||
| Less: participating securities included in weighted-average shares outstanding |
2,225,430 | — | 2,225,430 | — | ||||||||
| Weighted-average shares outstanding for basic earnings per common share |
29,042,241 | 26,107,377 | 29,029,932 | 26,101,797 | ||||||||
| Basic earnings per common share |
$ | 0.27 | $ | 0.31 | $ | 1.01 | $ | 0.93 | ||||
| Income applicable to PlainsCapital Corporation common shareholders |
$ | 8,301 | $ | 8,126 | $ | 31,430 | $ | 24,263 | ||||
| Weighted-average shares outstanding |
31,267,671 | 26,107,377 | 31,255,362 | 26,101,797 | ||||||||
| Dilutive effect of contingently issuable shares due to First Southwest acquisition |
1,527,687 | — | 1,527,687 | — | ||||||||
| Dilutive effect of stock options and non-vested stock awards |
419,599 | 115,928 | 358,775 | 143,822 | ||||||||
| Weighted-average shares outstanding for diluted earnings per common share |
33,214,957 | 26,223,305 | 33,141,824 | 26,245,619 | ||||||||
| Diluted earnings per common share |
$ | 0.25 | $ | 0.31 | $ | 0.95 | $ | 0.92 | ||||
PlainsCapital uses the two-class method prescribed by the Earnings per Share Topic of the ASC to compute earnings per common share. Participating securities include non-vested restricted stock and shares of PlainsCapital stock held in escrow pending the resolution of contingencies with respect to the First Southwest acquisition.
F-91
Table of Contents
Index to Financial Statements
PlainsCapital Corporation and subsidiaries
Notes to consolidated interim financial statements Unaudited (continued)
The weighted-average shares outstanding used to compute diluted earnings per common share do not include outstanding options of 57,000 and 191,889 for the three months ended September 30, 2009 and 2008, respectively and 180,489 and 65,100 for the nine months ended September 30, 2009 and 2008, respectively. The exercise price of the excluded options exceeded the average market price of PlainsCapital stock in the periods shown. Accordingly, the assumed exercise of the excluded options would have been antidilutive.
20. Recently issued accounting standards
Split-dollar life insurance
In September 2006, the FASB ratified the consensus reached by the Emerging Issues Task Force on the Split-Dollar Life Insurance Subsections of the ASC (“Split-Dollar Life Consensus”). The Split-Dollar Life Consensus applies to split-dollar life insurance arrangements that provide a benefit to an employee that extends to postretirement periods. The Split-Dollar Life Consensus states that employers should recognize a liability for future benefits based on the substantive agreement with the employee.
PlainsCapital adopted the Split-Dollar Life Consensus on January 1, 2008. The cumulative effect of the adoption of the Split-Dollar Life Consensus reduced the balance of retained earnings at January 1, 2008, by $0.7 million.
Business combinations
In December 2007, the FASB issued the Business Combinations Topic of the ASC. The Business Combinations Topic replaces previously issued guidance regarding business combinations, and applies to all transactions and other events in which one entity obtains control over one or more other businesses. Departing from the cost-allocation process of previous guidance, the Business Combinations Topic requires an acquirer to recognize the assets acquired, the liabilities assumed, and any noncontrolling interest in the acquiree at the acquisition date, measured at their fair values as of that date. In particular, this provision would prohibit an acquirer of a financial institution from carrying over the acquired entity’s allowance for loan losses. In addition, contingent consideration is recognized and measured at fair value at the acquisition date, and acquisition related costs are expensed as incurred. The Business Combinations Topic also distinguishes between assets acquired and liabilities assumed arising from contractual contingencies as of the acquisition date and assets or liabilities arising from all other contingencies, requiring different treatment for each type of contingency. The Business Combinations Topic is effective for PlainsCapital on January 1, 2009. To the extent business combinations occur on or after the effective date, PlainsCapital’s accounting for those transactions will be significantly affected by the provisions of the Business Combinations Topic. The First Southwest acquisition closed prior to the effective date and is being accounted for in accordance with previously issued guidance regarding business combinations.
F-92
Table of Contents
Index to Financial Statements
PlainsCapital Corporation and subsidiaries
Notes to consolidated interim financial statements Unaudited (continued)
Disclosures about derivative instruments and hedging activities
In March 2008, the FASB issued new guidance regarding disclosures in the Derivatives and Hedging Topic of the ASC (Derivative Disclosure Guidance). The Derivative Disclosure Guidance requires expanded disclosure to provide greater transparency about (i) how and why an entity uses derivative instruments, (ii) how derivative instruments and related hedge items are accounted for under the Derivatives and Hedging Topic, and (iii) how derivative instruments and related hedged items affect an entity’s financial position, results of operations and cash flows. To meet those objectives, the Derivative Disclosure Guidance requires qualitative disclosures about objectives and strategies for using derivatives, quantitative disclosures about fair value amounts of gains and losses on derivative instruments and disclosures about credit risk-related contingent features in derivative agreements. The Derivative Disclosure Guidance became effective for PlainsCapital January 1, 2009 and did not have a significant effect on its financial position, results of operations, or cash flows.
Fair value determination
In April 2009, the FASB issued guidance (“Fair Value Determination Guidance”) in the Fair Value Measurements and Disclosures Topic of the ASC regarding the determination of fair value in instances where market conditions result in either inactive markets for assets and liabilities or disorderly transactions within markets. The Fair Value Determination Guidance affirms that the objective of fair value when the market for an asset is not active is the price that would be received to sell the asset in an orderly transaction, and clarifies and includes additional factors for determining whether there has been a significant decrease in market activity for an asset when the market for that asset is not active. The Fair Value Determination Guidance requires an entity to base its conclusion about whether a transaction was not orderly on the weight of the evidence and expands certain disclosure requirements. The Fair Value Determination Guidance became effective for PlainsCapital in the quarter ended June 30, 2009, and its adoption did not have a significant effect on PlainsCapital’s financial position, results of operations, or cash flows.
Other-than-temporary impairments
In April 2009, the FASB issued guidance in the Investments-Debt and Equity Securities Topic of the ASC regarding the recognition and presentation of Other-Than-Temporary Impairments (“OTTI Guidance”). The OTTI Guidance (i) changes existing guidance for determining whether an impairment is other than temporary to debt securities and (ii) replaces the existing requirement that the entity’s management assert it has both the intent and ability to hold an impaired security until recovery with a requirement that management assert: (a) it does not have the intent to sell the security; and (b) it is more likely than not it will not have to sell the security before recovery of its cost basis. Under the OTTI Guidance, declines in the fair value of held-to-maturity and available-for-sale securities below their cost that are deemed to be other than temporary are reflected in earnings as realized losses to the extent the impairment is related to credit losses. The amount of the impairment related to other factors is recognized in
F-93
Table of Contents
Index to Financial Statements
PlainsCapital Corporation and subsidiaries
Notes to consolidated interim financial statements Unaudited (continued)
other comprehensive income. The OTTI Guidance became effective for PlainsCapital in the quarter ended June 30, 2009, and its adoption did not have a significant effect on PlainsCapital’s financial position, results of operations, or cash flows.
Interim disclosure about fair value of financial instruments
In April 2009, the FASB amended the Fair Value of Financial Instruments Subsection of the ASC to require an entity to provide disclosures about fair value of financial instruments in interim financial information (“Fair Value Disclosure Amendment”). The Fair Value Disclosure Amendment requires a publicly traded company to include disclosures about the fair value of its financial instruments whenever it issues summarized financial information for interim reporting periods. In addition, entities must disclose, in the body or in the accompanying notes of its summarized financial information for interim reporting periods and in its financial statements for annual reporting periods, the fair value of all financial instruments for which it is practicable to estimate that value, whether recognized or not recognized in the statement of financial position. The Fair Value Disclosure Amendment became effective for PlainsCapital in the quarter ended June 30, 2009, and its adoption did not have a significant effect on PlainsCapital’s financial position, results of operations, or cash flows. PlainsCapital has included the disclosures required by the Fair Value Disclosure Amendment in Note 16.
F-94
Table of Contents
Index to Financial Statements
15,000,000 shares
Common stock
Prospectus
J.P. Morgan
Sole book-running manager
| Fox-Pitt Kelton Cochran Caronia Waller | ||||
| Keefe, Bruyette & Woods | ||||
| Stephens Inc. | ||||
, 2009
Table of Contents
Index to Financial Statements
Part II—Information not required in prospectus
| Item 13. | Other expenses of issuance and distribution |
The following table sets forth the expenses (other than underwriting compensation expected to be incurred) in connection with this offering. All of such amounts (except the SEC registration fee and FINRA filing fee) are estimated. All of the fees and expenses below will be paid by PlainsCapital.
| SEC registration fee |
$ | 15,401 | |
| Listing fee |
125,000 | ||
| FINRA filing fee |
28,100 | ||
| Printing and engraving costs |
200,000 | ||
| Legal fees and expenses |
875,000 | ||
| Accounting fees and expenses |
300,000 | ||
| Transfer Agent and Registrar fees and expenses |
10,000 | ||
| Miscellaneous |
6,499 | ||
| Total |
$ | 1,550,000 | |
| Item 14. | Indemnification of directors and officers |
Limitation of personal liability of directors and indemnification
Indemnification and insurance
The Texas Business Organizations Code (the “TBOC”) permits a corporation to eliminate in its charter all monetary liability of the corporation’s directors to the corporation or its shareholders for conduct in the performance of such director’s duties. However, Texas law does not permit any limitation of liability of a director for: (i) breaching a duty of loyalty to a corporation or its shareholders; (ii) failing to act in good faith; (iii) engaging in intentional misconduct or a known violation of the law; (iv) engaging in a transaction from which the director obtains an improper benefit; or (v) violating applicable statutes which expressly provide for the liability of a director. Our certificate of formation provides that a director of the corporation will not be liable to the corporation or its shareholders to the fullest extent permitted by Texas law.
Sections 8.101 and 8.103 of the TBOC provide that a corporation may indemnify a person who was, is, or is threatened to be a named defendant or respondent in a proceeding because the person is or was a director only if a determination is made that such indemnification is permissible under the TBOC: (i) by a majority vote of the directors who at the time of the vote are disinterested and independent, regardless of whether such directors constitute a quorum; (ii) by a majority vote of a board committee designated by a majority of disinterested and independent directors and consisting solely of disinterested and independent directors; (iii) by special legal counsel selected by the board of directors or a committee of the board of directors as set forth in (i) or (ii); or (iv) by the shareholders in a vote that excludes the shares held by directors who are not disinterested and independent. The power to indemnify applies only if such person acted in good faith and, in the case of conduct in the person’s official capacity as a director, in a manner he reasonably believed to be in the best interest of the corporation, and, in all other cases, that the person’s conduct was not opposed to the best interest of the corporation, and with respect to any criminal action or proceeding, that such person had no reasonable cause to believe his conduct was unlawful.
II-1
Table of Contents
Index to Financial Statements
Section 8.104 of the TBOC provides that the corporation may pay or reimburse, in advance of the final disposition of the proceeding, reasonable expenses incurred by a present director who was, is, or is threatened to be made a named defendant or respondent in a proceeding after the corporation receives a written affirmation by the director of his good faith belief that he has met the standard of conduct necessary for indemnification under Section 8.101 and a written undertaking by or on behalf of the director to repay the amount paid or reimbursed if it is ultimately determined that he has not met that standard or if it is ultimately determined that indemnification of the director is not otherwise permitted under the TBOC. Section 8.105 also provides that reasonable expenses incurred by a former director or officer, or a present or former employee or agent of the corporation, who was, is, or is threatened to be made a named defendant or respondent in a proceeding may be paid or reimbursed by the corporation, in advance of the final disposition of the action, as the corporation considers appropriate.
Section 8.105 of the TBOC provides that a corporation may indemnify and advance expenses to a person who is not a director, including an officer, employee, or agent of the corporation as provided by: (i) the corporation’s governing documents; (ii) an action by the corporation’s governing authority; (iii) resolution by the shareholders; (iv) contract; or (v) common law. As consistent with section 8.105, a corporation may indemnify and advance expenses to persons who are not directors to the same extent that a corporation may indemnify and advance expenses to directors.
Our certificate of formation provides that, to the fullest extent and under the circumstances permitted by Chapter 8, (i) we must indemnify and advance expenses to directors and officers and (ii) we may purchase and maintain insurance on behalf of our directors and officers.
Pursuant to the Merger Agreement with First Southwest, we have agreed to maintain in effect, for six years from the closing date of the merger, directors’ and officers’ liability insurance covering those persons covered by the directors’ and officers’ liability insurance maintained by First Southwest on the closing date of the merger with the same coverage as may be provided from time to time by us to our then existing directors and officers, but we are not obligated to pay more than 110% of the last annual premium paid for such insurance.
| Item 15. | Recent sales of unregistered securities |
In the past three years, we issued the following securities in transactions that were not registered under the Securities Act:
On December 19, 2008, we sold 87,631 shares of Series A Preferred Stock and a warrant to purchase 4,382 shares of our Series B Preferred Stock to the U.S. Treasury for approximately $87.6 million. The shares and warrant were sold under Rule 506 of the Securities Act in reliance upon an exemption from registration for transactions not involving a public offering under Section 4(2) of the Securities Act. Further, on December 19, 2008, the U.S. Treasury exercised its warrant pursuant to a “cashless” exercise, and we issued 4,382 shares of our Series B Preferred Stock to the U.S. Treasury under Rule 506 of the Securities Act in reliance upon an exemption from registration for transactions not involving a public offering under Section 4(2) of the Securities Act.
On December 31, 2008, we acquired First Southwest pursuant to the Merger Agreement. Upon completion of the merger, each share of First Southwest common stock outstanding immediately before the merger (other than shares as to which statutory dissenters’ appraisal rights have been properly exercised and perfected and subject to other customary exceptions as specified in the
II-2
Table of Contents
Index to Financial Statements
Merger Agreement) automatically converted into the right to receive 2.82596085 shares of our Original Common Stock. Further, each option to acquire First Southwest common stock outstanding and unexercised immediately before the merger was converted into a substitute stock option to acquire our Original Common Stock. Upon completion of the merger on December 31, 2008, we issued 5,092,677 shares of our Original Common Stock and stock options to purchase 285,366 shares of our Original Common Stock to the former stockholders of First Southwest and placed 1,697,430 shares of our Original Common Stock in escrow for the benefit of former stockholders of First Southwest pursuant to Rule 506 of the Securities Act in reliance upon an exemption from registration for transactions not involving a public offering under Section 4(2) of the Securities Act. This exemption from registration was available because each certificate representing shares of our common stock issued pursuant to the Merger Agreement contains a legend indicating that our common stock had not been registered under the Securities Act and, prior to receiving any merger consideration, each former stockholder of First Southwest executed an investment representation letter to us indicating that such stockholder was receiving our shares with investment intent. Based upon these investment representation letters, we believed immediately prior to the time of sale (and continue to believe) that (i) no more than 35 non-accredited investors participated in the offering and (ii) each non-accredited investor participating in the offering either alone or with his purchaser representative had such knowledge and experience in financial and business matters to be capable of evaluating the merits and risks of the investment in the offering. 1,697,430 of the shares of Original Common Stock issued are currently held in escrow, and 71,322 shares underlying the substitute stock options could be held in escrow if exercised prior to the applicable release date, by an escrow agent and remain subject to the earnout provisions contained in the Merger Agreement.
We have periodically granted stock option awards to key employees pursuant to our Stock Option Plans. Additionally, we have granted restricted stock awards to key employees. During the past three years, we issued 350,991 shares of our Original Common Stock upon the exercise of outstanding stock options at prices ranging from $3.17 to $12.53 per share and a total of 528,000 shares of restricted Original Common Stock. These grants were awarded pursuant to the exemption from compliance with the registration requirements of the Securities Act provided by Rule 701 thereof. The vesting of these 528,000 restricted shares of our Original Common Stock will be accelerated upon the listing of our Common Stock on the NYSE. See “Management’s discussion and analysis of financial condition and results of operations—Stock-based compensation expense in connection with this offering.”
| Item 16. | Exhibits |
A list of exhibits filed herewith is contained in the Exhibit Index that immediately precedes such exhibits and is incorporated by reference herein.
| Item 17. | Undertakings |
The undersigned registrant hereby undertakes that:
| (1) | For purposes of determining any liability under the Securities Act of 1933, as amended, the information omitted from the form of prospectus filed as part of this registration statement in reliance upon Rule 430A and contained in a form of prospectus filed by the registrant pursuant to Rule 424(b)(1) or (4) or 497(h) under the Securities Act of 1933, as amended, shall be deemed to be part of this registration statement as of the time it was declared effective. |
II-3
Table of Contents
Index to Financial Statements
| (2) | For the purpose of determining any liability under the Securities Act of 1933, as amended, each post-effective amendment that contains a form of prospectus shall be deemed to be a new registration statement relating to the securities offered therein, and the offering of such securities at that time shall be deemed to be the initial bona fide offering thereof. |
Insofar as indemnification for liabilities arising under the Securities Act of 1933, as amended, may be permitted to directors, officers and controlling persons of the registrant pursuant to the foregoing provisions, or otherwise, the registrant has been advised that in the opinion of the Securities and Exchange Commission such indemnification is against public policy as expressed in the Securities Act of 1933, as amended, and is, therefore, unenforceable. In the event that a claim for indemnification against such liabilities (other than the payment by the registrant of expenses incurred or paid by a director, officer or controlling person of the registrant in the successful defense of any action, suit or proceeding) is asserted by such director, officer or controlling person in connection with the securities being registered, the registrant will, unless in the opinion of its counsel the matter has been settled by controlling precedent, submit to a court of appropriate jurisdiction the question whether such indemnification by it is against public policy as expressed in the Securities Act of 1933, as amended, and will be governed by the final adjudication of such issue.
II-4
Table of Contents
Index to Financial Statements
Signatures
Pursuant to the requirements of the Securities Act of 1933, the registrant has duly caused this registration statement to be signed on its behalf by the undersigned, thereunto duly authorized in the City of Dallas, State of Texas, on November 2, 2009.
| PLAINSCAPITAL CORPORATION | ||
| By: | /s/ Alan B. White | |
| Name: | Alan B. White | |
| Title: | President and Chief Executive Officer | |
| (Principal Executive Officer) | ||
II-5
Table of Contents
Index to Financial Statements
Pursuant to the requirements of the Securities Act of 1933, as amended, this Registration Statement has been signed by the following persons in the capacities indicated on the 2nd day of November, 2009.
| Signature |
Title | |
| /s/ Alan B. White Alan B. White |
President and Chief Executive Officer and Director (Principal Executive Officer) | |
| * Allen Custard |
Executive Vice President and Chief Financial Officer (Principal Financial Officer) | |
| * Jeff Isom |
Executive Vice President of Finance and Accounting (Principal Accounting Officer) | |
| * Charlotte Jones Anderson |
Director | |
| * Tracy A. Bolt |
Director | |
| * Hill A. Feinberg |
Director | |
| * Lee Lewis |
Director | |
| * Andrew J. Littlefair |
Director | |
| * Michael T. McGuire |
Director | |
| * Haag Sherman |
Director | |
| * Robert Taylor, Jr. |
Director | |
|
*By: |
/s/ Alan B. White Alan B. White Attorney-in-Fact |
II-6
Table of Contents
Index to Financial Statements
Exhibit index
| EXHIBIT NO. |
||||
| 1.1# | – |
Form of Underwriting Agreement. | ||
| 3.1 | – |
Third Amended and Restated Certificate of Formation of PlainsCapital Corporation (previously filed as Exhibit 3.1 to the Quarterly Report on Form 10-Q filed on October 21, 2009, File No. 000-53629, and incorporated herein by reference). | ||
| 3.2 | – |
Amended and Restated Bylaws of PlainsCapital Corporation, (previously filed as Exhibit 3.1 to the Current Report on Form 8-K filed on August 31, 2009, File No. 000-53629, and incorporated herein by reference). | ||
| 4.1 | – |
Letter Agreement and Securities Purchase Agreement—Standard Terms incorporated therein, dated as of December 19, 2008, between Plains Capital Corporation and the United States Department of the Treasury (previously filed as Exhibit 4.1 to the Registration Statement on Form 10 filed on April 17, 2009, File No. 000-53629, and incorporated herein by reference). | ||
| 4.2 | – |
Amended and Restated Declaration of Trust, dated as of July 31, 2001, by and among State Street Bank and Trust Company of Connecticut, National Association, Plains Capital Corporation, and Alan B. White, George McCleskey, and Jeff Isom as Administrators (previously filed as Exhibit 4.2 to the Registration Statement on Form 10 filed on April 17, 2009, File No. 000-53629, and incorporated herein by reference). | ||
| 4.3 | – |
First Amendment to Amended and Restated Declaration of Trust, dated as of August 7, 2006, between Plains Capital Corporation and U.S. Bank National Association (previously filed as Exhibit 4.3 to the Registration Statement on Form 10 filed on April 17, 2009, File No. 000-53629, and incorporated herein by reference). | ||
| 4.4 | – |
Indenture, dated as of July 31, 2001, between Plains Capital Corporation and State Street Bank and Trust Company of Connecticut, National Association (previously filed as Exhibit 4.4 to the Registration Statement on Form 10 filed on April 17, 2009, File No. 000-53629, and incorporated herein by reference). | ||
| 4.5 | – |
First Supplemental Indenture, dated as of August 7, 2006, between Plains Capital Corporation and U.S. Bank National Association (previously filed as Exhibit 4.5 to the Registration Statement on Form 10 filed on April 17, 2009, File No. 000-53629, and incorporated herein by reference). | ||
| 4.6 | – |
Amended and Restated Floating Rate Junior Subordinated Deferrable Interest Debenture of Plains Capital Corporation, dated as of August 7, 2006, by Plains Capital Corporation in favor of U.S. Bank National Association (previously filed as Exhibit 4.6 to the Registration Statement on Form 10 filed on April 17, 2009, File No. 000-53629, and incorporated herein by reference). | ||
| 4.7 | – |
Guarantee Agreement, dated as of July 31, 2001, between Plains Capital Corporation and State Street Bank and Trust Company of Connecticut, National Association, as trustee (previously filed as Exhibit 4.7 to the Registration Statement on Form 10 filed on April 17, 2009, File No. 000-53629, and incorporated herein by reference). | ||
II-7
Table of Contents
Index to Financial Statements
| EXHIBIT NO. |
||||
| 4.8 | – |
First Amendment to Guarantee Agreement, dated as of August 7, 2006, between Plains Capital Corporation and U.S. Bank National Association (previously filed as Exhibit 4.8 to the Registration Statement on Form 10 filed on April 17, 2009, File No. 000-53629, and incorporated herein by reference). | ||
| 4.9 | – |
Amended and Restated Declaration of Trust, dated as of March 26, 2003, by and among U.S. Bank National Association, Plains Capital Corporation, and Alan B. White, George McCleskey, and Jeff Isom as Administrators (previously filed as Exhibit 4.9 to the Registration Statement on Form 10 filed on April 17, 2009, File No. 000-53629, and incorporated herein by reference). | ||
| 4.10 | – |
Indenture, dated as of March 26, 2003, between Plains Capital Corporation and U.S. Bank National Association (previously filed as Exhibit 4.10 to the Registration Statement on Form 10 filed on April 17, 2009, File No. 000-53629, and incorporated herein by reference). | ||
| 4.11 | – |
Floating Rate Junior Subordinated Deferrable Interest Debenture of Plains Capital Corporation, dated as of March 26, 2003, by Plains Capital Corporation in favor of U.S. Bank National Association (previously filed as Exhibit 4.11 to the Registration Statement on Form 10 filed on April 17, 2009, File No. 000-53629, and incorporated herein by reference). | ||
| 4.12 | – |
Guarantee Agreement, dated as of March 26, 2003, between Plains Capital Corporation and U.S. Bank National Association, as trustee (previously filed as Exhibit 4.12 to the Registration Statement on Form 10 filed on April 17, 2009, File No. 000-53629, and incorporated herein by reference). | ||
| 4.13 | – |
Amended and Restated Declaration of Trust, dated as of September 17, 2003, by and among U.S. Bank National Association, Plains Capital Corporation, and Alan B. White, George McCleskey, and Jeff Isom as Administrators (previously filed as Exhibit 4.13 to the Registration Statement on Form 10 filed on April 17, 2009, File No. 000-53629, and incorporated herein by reference). | ||
| 4.14 | – |
Indenture, dated as of September 17, 2003, between Plains Capital Corporation and U.S. Bank National Association (previously filed as Exhibit 4.14 to the Registration Statement on Form 10 filed on April 17, 2009, File No. 000-53629, and incorporated herein by reference). | ||
| 4.15 | – |
Floating Rate Junior Subordinated Deferrable Interest Debenture of Plains Capital Corporation, dated as of September 17, 2003, by Plains Capital Corporation in favor of U.S. Bank National Association (previously filed as Exhibit 4.15 to the Registration Statement on Form 10 filed on April 17, 2009, File No. 000-53629, and incorporated herein by reference). | ||
| 4.16 | – |
Guarantee Agreement, dated as of September 17, 2003, between Plains Capital Corporation and U.S. Bank National Association, as trustee (previously filed as Exhibit 4.16 to the Registration Statement on Form 10 filed on April 17, 2009, File No. 000-53629, and incorporated herein by reference). | ||
II-8
Table of Contents
Index to Financial Statements
| EXHIBIT NO. |
||||
| 4.17 | – |
Amended and Restated Trust Agreement, dated as of February 22, 2008, by and among Plains Capital Corporation, Wells Fargo Bank, N.A., Wells Fargo Delaware Trust Company, and Alan B. White, DeWayne Pierce, and Jeff Isom as Administrative Trustees (previously filed as Exhibit 4.17 to the Registration Statement on Form 10 filed on April 17, 2009, File No. 000-53629, and incorporated herein by reference). | ||
| 4.18 | – |
Junior Subordinated Indenture, dated as of February 22, 2008, between Plains Capital Corporation and Wells Fargo Bank, N.A. (previously filed as Exhibit 4.18 to the Registration Statement on Form 10 filed on April 17, 2009, File No. 000-53629, and incorporated herein by reference). | ||
| 4.19 | – |
Plains Capital Corporation Floating Rate Junior Subordinated Note due 2038, dated as of February 22, 2008, by Plains Capital Corporation in favor of Wells Fargo Bank, N.A., as trustee of the PCC Statutory Trust IV (previously filed as Exhibit 4.19 to the Registration Statement on Form 10 filed on April 17, 2009, File No. 000-53629, and incorporated herein by reference). | ||
| 4.20 | – |
Guarantee Agreement, dated as of February 22, 2008, between Plains Capital Corporation and Wells Fargo Bank, N.A. (previously filed as Exhibit 4.20 to the Registration Statement on Form 10 filed on April 17, 2009, File No. 000-53629, and incorporated herein by reference). | ||
| 4.21 | – |
Registration Rights Agreement, dated as of December 31, 2008, between Plains Capital Corporation and Hill A. Feinberg, as Stockholders’ Representative (previously filed as Exhibit 4.21 to Amendment No. 1 to the Registration Statement on Form 10 filed on June 26, 2009, File No. 000-53629, and incorporated herein by reference). | ||
| 4.22# | – |
Specimen stock certificate for Common Stock offered hereby. | ||
| 5.1* | – |
Opinion of Haynes and Boone, LLP. | ||
| 10.1 | – |
Agreement and Plan of Merger, dated as of November 7, 2008, by and among Plains Capital Corporation, PlainsCapital Bank, First Southwest Holdings, Inc., and Hill A. Feinberg as Stockholders’ Representative (previously filed as Exhibit 10.1 to the Registration Statement on Form 10 filed on April 17, 2009, File No. 000-53629, and incorporated herein by reference). | ||
| 10.2 | – |
First Amendment to Agreement and Plan of Merger, dated as of December 8, 2008, by and among Plains Capital Corporation, PlainsCapital Bank, First Southwest Holdings, Inc., and Hill A. Feinberg as Stockholders’ Representative (previously filed as Exhibit 10.2 to the Registration Statement on Form 10 filed on April 17, 2009, File No. 000-53629, and incorporated herein by reference). | ||
| 10.3 | – |
Second Amendment to Agreement and Plan of Merger, dated as of December 8, 2008, by and among Plains Capital Corporation, PlainsCapital Bank, FSWH Acquisition LLC, First Southwest Holdings, Inc., and Hill A. Feinberg as Stockholders’ Representative (previously filed as Exhibit 10.3 to the Registration Statement on Form 10 filed on April 17, 2009, File No. 000-53629, and incorporated herein by reference). | ||
| 10.4 | – |
Amended and Restated Employment Agreement, dated as of January 1, 2009, between Plains Capital Corporation and Alan White (previously filed as Exhibit 10.4 to the Registration Statement on Form 10 filed on April 17, 2009, File No. 000-53629, and incorporated herein by reference). | ||
II-9
Table of Contents
Index to Financial Statements
| EXHIBIT NO. |
||||
| 10.5 | – |
First Amendment to Amended and Restated Employment Agreement, dated as of March 2, 2009, between Plains Capital Corporation and Alan White (previously filed as Exhibit 10.5 to the Registration Statement on Form 10 filed on April 17, 2009, File No. 000-53629, and incorporated herein by reference). | ||
| 10.6 | – |
Employment Agreement, effective as of December 31, 2008, by and among First Southwest Holdings, LLC, Plains Capital Corporation and Hill A. Feinberg (previously filed as Exhibit 10.6 to the Registration Statement on Form 10 filed on April 17, 2009, File No. 000-53629, and incorporated herein by reference). | ||
| 10.7 | – |
First Amendment to Employment Agreement, dated as of March 2, 2009, by and among First Southwest Holdings, LLC, Plains Capital Corporation and Hill A. Feinberg (previously filed as Exhibit 10.7 to the Registration Statement on Form 10 filed on April 17, 2009, File No. 000-53629, and incorporated herein by reference). | ||
| 10.8 | – |
Employment Agreement, dated as of January 1, 2009, between Plains Capital Corporation and Jerry L. Schaffner (previously filed as Exhibit 10.8 to the Registration Statement on Form 10 filed on April 17, 2009, File No. 000-53629, and incorporated herein by reference). | ||
| 10.9 | – |
First Amendment to Employment Agreement, dated as of March 2, 2009, between Plains Capital Corporation and Jerry L. Schaffner (previously filed as Exhibit 10.9 to the Registration Statement on Form 10 filed on April 17, 2009, File No. 000-53629, and incorporated herein by reference). | ||
| 10.10 | – |
Employment Agreement, dated as of January 1, 2009, between Plains Capital Corporation and Jeff Isom (previously filed as Exhibit 10.10 to the Registration Statement on Form 10 filed on April 17, 2009, File No. 000-53629, and incorporated herein by reference). | ||
| 10.11 | – |
First Amendment to Employment Agreement, dated as of March 2, 2009, between Plains Capital Corporation and Jeff Isom (previously filed as Exhibit 10.11 to the Registration Statement on Form 10 filed on April 17, 2009, File No. 000-53629, and incorporated herein by reference). | ||
| 10.12 | – |
Plains Capital Corporation Incentive Stock Option Plan, dated October 16, 1996 (the “1996 Incentive Stock Option Plan”) (previously filed as Exhibit 10.12 to the Registration Statement on Form 10 filed on April 17, 2009, File No. 000-53629, and incorporated herein by reference). | ||
| 10.13 | – |
Plains Capital Corporation Incentive Stock Option Plan, dated March 25, 1998 (the “1998 Incentive Stock Option Plan”) (previously filed as Exhibit 10.13 to the Registration Statement on Form 10 filed on April 17, 2009, File No. 000-53629, and incorporated herein by reference). | ||
| 10.14 | – |
Plains Capital Corporation Incentive Stock Option Plan, dated April 18, 2001 (the “2001 Incentive Stock Option Plan”) (previously filed as Exhibit 10.14 to the Registration Statement on Form 10 filed on April 17, 2009, File No. 000-53629, and incorporated herein by reference). | ||
| 10.15 | – |
Plains Capital Corporation Incentive Stock Option Plan, dated March 25, 2003 (the “2003 Incentive Stock Option Plan”) (previously filed as Exhibit 10.15 to the Registration Statement on Form 10 filed on April 17, 2009, File No. 000-53629, and incorporated herein by reference). | ||
II-10
Table of Contents
Index to Financial Statements
| EXHIBIT NO. |
||||
| 10.16 | – |
Plains Capital Corporation 2005 Incentive Stock Option Plan, dated April 20, 2005 (previously filed as Exhibit 10.16 to the Registration Statement on Form 10 filed on April 17, 2009, File No. 000-53629, and incorporated herein by reference). | ||
| 10.17 | – |
Amended and Restated Plains Capital Corporation 2007 Nonqualified and Incentive Stock Option Plan, dated December 31, 2008 (previously filed as Exhibit 10.17 to the Registration Statement on Form 10 filed on April 17, 2009, File No. 000-53629, and incorporated herein by reference). | ||
| 10.18 | – |
PNB Financial Bank Supplemental Executive Pension Plan, effective as of January 1, 2008 (previously filed as Exhibit 10.18 to the Registration Statement on Form 10 filed on April 17, 2009, File No. 000-53629, and incorporated herein by reference). | ||
| 10.19 | – |
First Amendment to Plains Capital Bank Supplemental Executive Pension Plan, effective as of March 19, 2009 (previously filed as Exhibit 10.19 to the Registration Statement on Form 10 filed on April 17, 2009, File No. 000-53629, and incorporated herein by reference). | ||
| 10.20 | – |
Employee Stock Ownership Plan, effective January 1, 2004 and as amended and restated as of January 1, 2006 (previously filed as Exhibit 10.20 to the Registration Statement on Form 10 filed on April 17, 2009, File No. 000-53629, and incorporated herein by reference). | ||
| 10.21 | – |
First Amendment to Plains Capital Corporation Employees’ Stock Ownership Plan, effective as of January 1, 2007 (previously filed as Exhibit 10.21 to the Registration Statement on Form 10 filed on April 17, 2009, File No. 000-53629, and incorporated herein by reference). | ||
| 10.22 | – |
Second Amendment to Plains Capital Corporation Employees’ Stock Ownership Plan, dated as of December 1, 2008 (previously filed as Exhibit 10.22 to the Registration Statement on Form 10 filed on April 17, 2009, File No. 000-53629, and incorporated herein by reference). | ||
| 10.23 | – |
Form of Restricted Stock Award Agreement for restricted stock awards issued to Messrs. Isom, Schaffner and White on December 17, 2008 (previously filed as Exhibit 10.23 to the Registration Statement on Form 10 filed on April 17, 2009, File No. 000-53629, and incorporated herein by reference). | ||
| 10.24 | – |
Form of Restricted Stock Award Agreement for restricted stock awards issued to Messrs. Custard and Feinberg, effective as of December 31, 2008 (previously filed as Exhibit 10.24 to Amendment No. 2 to the Registration Statement on Form 10 filed on July 10, 2009, File No. 000-53629, and incorporated herein by reference). | ||
| 10.25 | – |
Form of Stock Option Agreement under the 1996 Incentive Stock Option Plan (previously filed as Exhibit 10.25 to the Registration Statement on Form 10 filed on April 17, 2009, File No. 000-53629, and incorporated herein by reference). | ||
| 10.26 | – |
Form of Stock Option Agreement under the 1998 Incentive Stock Option Plan (previously filed as Exhibit 10.26 to the Registration Statement on Form 10 filed on April 17, 2009, File No. 000-53629, and incorporated herein by reference). | ||
| 10.27 | – |
Form of Stock Option Agreement under the 2001 Incentive Stock Option Plan (previously filed as Exhibit 10.27 to the Registration Statement on Form 10 filed on April 17, 2009, File No. 000-53629, and incorporated herein by reference). | ||
II-11
Table of Contents
Index to Financial Statements
| EXHIBIT NO. |
||||
| 10.28 | – |
Form of Stock Option Agreement under the 2003 Incentive Stock Option Plan (previously filed as Exhibit 10.28 to the Registration Statement on Form 10 filed on April 17, 2009, File No. 000-53629, and incorporated herein by reference). | ||
| 10.29 | – |
Form of Stock Option Agreement under the Plains Capital Corporation 2005 Incentive Stock Option Plan (previously filed as Exhibit 10.29 to the Registration Statement on Form 10 filed on April 17, 2009, File No. 000-53629, and incorporated herein by reference). | ||
| 10.30 | – |
Form of Stock Option Agreement under the Amended and Restated Plains Capital Corporation 2007 Nonqualified and Incentive Stock Option Plan (previously filed as Exhibit 10.30 to the Registration Statement on Form 10 filed on April 17, 2009, File No. 000-53629, and incorporated herein by reference). | ||
| 10.31 | – |
Amended and Restated Subordinate Credit Agreement, dated as of December 19, 2007, between JP Morgan Chase Bank, N.A. and Plains Capital Corporation (previously filed as Exhibit 10.31 to the Registration Statement on Form 10 filed on April 17, 2009, File No. 000-53629, and incorporated herein by reference). | ||
| 10.32 | Renewal, Extension and Modification Agreement, dated as of June 19, 2009, between JPMorgan Chase Bank, NA and Plains Capital Corporation (previously filed as Exhibit 10.32 to the Quarterly Report on Form 10-Q filed on October 21, 2009, File No. 000-53629, and incorporated herein by reference). | |||
| 10.33 | Third Amended and Restated Subordinate Promissory Note, dated as of June 19, 2009, by Plains Capital Corporation in favor of JPMorgan Chase Bank, NA (previously filed as Exhibit 10.33 to the Quarterly Report on Form 10-Q filed on October 21, 2009, File No. 000-53629, and incorporated herein by reference). | |||
| 10.34 | – |
Amended and Restated Loan Agreement, dated as of October 1, 2001, between Plains Capital Corporation and Bank One, NA (previously filed as Exhibit 10.33 to the Registration Statement on Form 10 filed on April 17, 2009, File No. 000-53629, and incorporated herein by reference). | ||
| 10.35 | – |
First Amendment to Amended and Restated Loan Agreement, dated as of August 1, 2002, between Plains Capital Corporation and Bank One, NA (previously filed as Exhibit 10.34 to the Registration Statement on Form 10 filed on April 17, 2009, File No. 000-53629, and incorporated herein by reference). | ||
| 10.36 | – |
Second Amendment to Amended and Restated Loan Agreement, dated as of August 1, 2003, between Plains Capital Corporation and Bank One, NA (previously filed as Exhibit 10.35 to the Registration Statement on Form 10 filed on April 17, 2009, File No. 000-53629, and incorporated herein by reference). | ||
| 10.37 | – |
Third Amendment to Amended and Restated Loan Agreement, dated as of June 1, 2004, between Plains Capital Corporation and Bank One, NA (previously filed as Exhibit 10.36 to the Registration Statement on Form 10 filed on April 17, 2009, File No. 000-53629, and incorporated herein by reference). | ||
| 10.38 | – |
Fourth Amendment to Amended and Restated Loan Agreement, dated as of November 21, 2005, between Plains Capital Corporation and JPMorgan Chase Bank, NA (previously filed as Exhibit 10.37 to the Registration Statement on Form 10 filed on April 17, 2009, File No. 000-53629, and incorporated herein by reference). | ||
II-12
Table of Contents
Index to Financial Statements
| EXHIBIT NO. |
||||
| 10.39 | – |
Fifth Amendment to Amended and Restated Loan Agreement, dated as of October 16, 2006, between Plains Capital Corporation and JPMorgan Chase Bank, NA (previously filed as Exhibit 10.38 to the Registration Statement on Form 10 filed on April 17, 2009, File No. 000-53629, and incorporated herein by reference). | ||
| 10.40 | – |
Sixth Amendment to Amended and Restated Loan Agreement, dated as of December 19, 2007, between Plains Capital Corporation and JPMorgan Chase Bank, NA (previously filed as Exhibit 10.39 to the Registration Statement on Form 10 filed on April 17, 2009, File No. 000-53629, and incorporated herein by reference). | ||
| 10.41 | – |
Seventh Amendment to Amended and Restated Loan Agreement, dated as of June 19, 2009, between Plains Capital Corporation and JPMorgan Chase Bank, NA (previously filed as Exhibit 10.41 to the Quarterly Report on Form 10-Q filed on October 21, 2009, File No. 000-53629, and incorporated herein by reference). | ||
| 10.42 | – |
Commercial Pledge and Security Agreement, dated as of November 1, 2000, by Plains Capital Corporation for the benefit of Bank One, Texas N.A. (previously filed as Exhibit 10.40 to the Registration Statement on Form 10 filed on April 17, 2009, File No. 000-53629, and incorporated herein by reference). | ||
| 10.43 | – |
Fourth Amended and Restated Promissory Note, dated as of June 19, 2009, by Plains Capital Corporation in favor of JPMorgan Chase Bank, NA (previously filed as Exhibit 10.43 to the Quarterly Report on Form 10-Q filed on October 21, 2009, File No. 000-53629, and incorporated herein by reference). | ||
| 10.44 | – |
Loan Agreement, dated as of September 22, 2004, between Bank One, NA and Plains Capital Corporation (previously filed as Exhibit 10.42 to the Registration Statement on Form 10 filed on April 17, 2009, File No. 000-53629, and incorporated herein by reference). | ||
| 10.45 | – |
Renewal, Extension and Modification Agreement, dated as of June 19, 2009, between JPMorgan Chase Bank, NA and Plains Capital Corporation (previously filed as Exhibit 10.45 to the Quarterly Report on Form 10-Q filed on October 21, 2009, File No. 000-53629, and incorporated herein by reference). | ||
| 10.46 | – |
Amended and Restated Promissory Note, dated as of June 19, 2009, by Plains Capital Corporation in favor of JPMorgan Chase Bank, NA (previously filed as Exhibit 10.46 to the Quarterly Report on Form 10-Q filed on October 21, 2009, File No. 000-53629, and incorporated herein by reference). | ||
| 10.47 | – |
Loan Agreement, dated as of October 27, 2004, between Plains Capital Corporation and Bank One, NA (previously filed as Exhibit 10.44 to the Registration Statement on Form 10 filed on April 17, 2009, File No. 000-53629, and incorporated herein by reference). | ||
| 10.48 | – |
Renewal, Extension and Modification Agreement, dated as of June 19, 2009, between Plains Capital Corporation and JPMorgan Chase Bank, NA (previously filed as Exhibit 10.48 to the Quarterly Report on Form 10-Q filed on October 21, 2009, File No. 000-53629, and incorporated herein by reference). | ||
| 10.49 | – |
Third Amended and Restated Promissory Note, dated as of June 19, 2009, by Plains Capital Corporation in favor of JPMorgan Chase Bank, NA (previously filed as Exhibit 10.49 to the Quarterly Report on Form 10-Q filed on October 21, 2009, File No. 000-53629, and incorporated herein by reference). | ||
II-13
Table of Contents
Index to Financial Statements
| EXHIBIT NO. |
||||
| 10.50 | – |
Credit Agreement, dated as of October 13, 2006, between Plains Capital Corporation and JPMorgan Chase Bank, N.A. (previously filed as Exhibit 10.47 to the Registration Statement on Form 10 filed on April 17, 2009, File No. 000-53629, and incorporated herein by reference). | ||
| 10.51 | – |
Renewal, Extension and Modification Agreement, dated as of June 19, 2009, between Plains Capital Corporation and JPMorgan Chase Bank, NA (previously filed as Exhibit 10.51 to the Quarterly Report on Form 10-Q filed on October 21, 2009, File No. 000-53629, and incorporated herein by reference). | ||
| 10.52 | – |
Second Amended and Restated Promissory Note, dated as of June 19, 2009, by PlainsCapital Corporation in favor of JPMorgan Chase Bank, NA (previously filed as Exhibit 10.52 to the Quarterly Report on Form 10-Q filed on October 21, 2009, File No. 000-53629, and incorporated herein by reference). | ||
| 10.53 | – |
Office Lease, dated as of February 7, 2007, between Plains Capital Corporation and Block L Land, L.P. (previously filed as Exhibit 10.49 to the Registration Statement on Form 10 filed on April 17, 2009, File No. 000-53629, and incorporated herein by reference). | ||
| 10.54 | – |
First Amendment to Office Lease, dated as of April 3, 2007, between Plains Capital Corporation and Block L Land, L.P. (previously filed as Exhibit 10.50 to the Registration Statement on Form 10 filed on April 17, 2009, File No. 000-53629, and incorporated herein by reference). | ||
| 10.55 | – |
Second Amendment to Office Lease, dated as of November 14, 2008, between PlainsCapital Corporation and H/H Victory Holdings, L.P. (previously filed as Exhibit 10.51 to the Registration Statement on Form 10 filed on April 17, 2009, File No. 000-53629, and incorporated herein by reference). | ||
| 10.56 | – |
Employment Agreement, dated as of December 18, 2008, by and among Plains Capital Corporation, First Southwest Holdings, LLC and W. Allen Custard III (previously filed as Exhibit 10.1 to the Current Report on Form 8-K filed on July 8, 2009, File No. 000-53629, and incorporated herein by reference). | ||
| 10.57 | – |
First Amendment to Employment Agreement, dated as of March 2, 2009, by and among Plains Capital Corporation, First Southwest Holdings, LLC and W. Allen Custard III (previously filed as Exhibit 10.2 to the Current Report on Form 8-K filed on July 8, 2009, File No. 000-53629, and incorporated herein by reference). | ||
| 10.58 | – |
PlainsCapital Corporation 2009 Long-Term Incentive Plan (previously filed as Exhibit 10.1 to the Current Report on Form 8-K filed on August 31, 2009, File No. 000-53629, and incorporated herein by reference). | ||
| 10.59 | – |
Waiver Letter, dated as of October 16, 2009, from JP Morgan Chase Bank, NA to PlainsCapital Corporation (previously filed as Exhibit 10.59 to our Quarterly Report on Form 10-Q filed on October 21, 2009, File No. 000-53629, and incorporated herein by reference). | ||
| 21.1# | – |
Subsidiaries of PlainsCapital Corporation. | ||
| 23.1* | – |
Consent of Ernst & Young LLP. | ||
| 23.2* | – |
Consent of Haynes and Boone, LLP (contained in Exhibit 5.1). | ||
| 24.1 | – |
Power of Attorney (included in the signature page of the Registration Statement filed on August 26, 2009). | ||
| 24.2# | – |
Power of Attorney. | ||
| * | Filed herewith. |
| # | Incorporated by reference to the same numbered exhibit to Amendment No. 1 to the Registration Statement on Form S-1 (File No. 333-161548) filed on October 21, 2009. |
II-14