Attached files
| file | filename |
|---|---|
| 8-K - FORM 8-K - EXCO RESOURCES INC | d8k.htm |
 EXCO’s State of the Company and Corporate Governance Discussion Boston, MA November 2, 2009 Exhibit 99.1 |
 2 Forward Looking Statements This presentation contains forward-looking statements, as defined in Section 27A of the Securities Act
and Section 21E of the Securities Exchange Act of 1934, or the Exchange Act. These forward-looking statements relate to, among other things, the following: our future financial and operating performance and results; our business strategy; market prices; our future use of derivative financial instruments; and our plans and forecasts. We have based these forward-looking statements on our current
assumptions, expectations and projections about future events. We use the words "may," "expect," "anticipate,"
"estimate," "believe," "continue," "intend," "plan," "budget" and other similar words to identify forward-looking statements. You should read statements that contain these words carefully because they discuss future expectations, contain projections of results
of operations or of our financial condition and/or state other "forward-looking" information. We do not undertake any obligation to update or revise publicly any forward-looking statements, except as required
by law. These statements also involve risks and uncertainties that could cause our actual results or financial condition to materially differ from our expectations in this presentation, including, but not
limited to: fluctuations in prices of oil and natural gas; imports of foreign oil and natural gas, including liquefied natural gas; future capital requirements and availability of financing; continued disruption of credit and capital markets and the ability of financial institutions to honor their
commitments, such as the events which occurred during the third quarter of 2008 and thereafter, for an extended period of time;
estimates of reserves and economic assumptions; geological concentration of our reserves; risks associated with drilling and operating wells; exploratory risks, including our Marcellus and Huron shale plays in Appalachia and our Haynesville/Bossier
shale play in East Texas/North Louisiana; risks associated with operation of natural gas pipelines and gathering systems; discovery, acquisition, development and replacement of oil and natural gas reserves; cash flow and liquidity; timing and amount of future production of oil and natural gas; availability of drilling and production equipment; marketing of oil and natural gas; developments in oil-producing and natural gas-producing countries; title to our properties; competition; litigation; general economic conditions, including costs associated with drilling and operation of our properties;
environmental or other governmental regulations, including legislation to reduce emissions of greenhouse
gases; receipt and collectibility of amounts owed to us by purchasers of our production and counterparties to our
derivative financial instruments; decisions whether or not to enter into derivative financial instruments; events similar to those of September 11, 2001; actions of third party co-owners of interests in properties in which we also own an interest;
fluctuations in interest rates; and our ability to effectively integrate companies and properties that we acquire.. |
 3 Forward Looking Statements (continued) We believe that it is important to communicate our expectations of future performance to our
investors. However, events may occur in the future that we are unable to accurately predict, or over which we have no control. You are cautioned not to place undue reliance on a forward-looking statement. When considering our
forward-looking statements, keep in mind the risk factors and other cautionary statements in this presentation, and the risk factors included in the Annual Reports on Form 10-K and our Quarterly Reports on Form 10-Q.
Our revenues, operating results, financial condition and ability to borrow funds or obtain additional
capital depend substantially on prevailing prices for oil and natural gas, the availability of capital from our revolving credit facilities and liquidity from capital markets. Declines in oil or natural gas prices may materially
adversely affect our financial condition, liquidity, ability to obtain financing and operating results. Lower oil or natural gas prices also may reduce the amount of oil or natural gas that we can produce economically. A decline in
oil and/or natural gas prices could have a material adverse effect on the estimated value and estimated quantities of our oil and natural gas reserves, our ability to fund our operations and our financial condition, cash
flow, results of operations and access to capital. Historically, oil and natural gas prices and markets have been volatile, with prices fluctuating widely, and they are likely to continue to be volatile. The SEC has generally permitted oil and natural gas companies, in filings made with the SEC, to disclose
only proved reserves that a company has demonstrated by actual production or conclusive formation tests to be economically and legally producible under existing economic and operating conditions. We use the terms
“probable”, “possible”, “potential” or “unproved” to describe volumes of reserves potentially recoverable through additional drilling or recovery techniques that the SEC’s guidelines prohibit us from including in
filings with the SEC. These estimates are by their nature more speculative than estimates of proved reserves and accordingly are subject to substantially greater risk of being actually realized by the company. While
we believe our calculations of unproved drillsites and estimation of unproved reserves have been appropriately risked and are reasonable, such calculations and estimates have not been reviewed by third party engineers or
appraisers. Investors are urged to consider closely the disclosure in our Annual Report on Form 10-K for the year ended December 31, 2008 which is available on our website at www.excoresources.com under the Investor
Relations tab or by calling us at 214-368-2084. |
 4 Welcome Doug Miller Chairman and CEO State of the Industry Boone Pickens Chairman, BP Capital, L.P. EXCO Plans Doug Miller Financial Review Steve Smith President & CFO Operations Review Hal Hickey Vice President and COO Corporate Governance Doug Ramsey Vice President - Finance and Treasurer Officer and Director Compensation Doug Ramsey Questions and Answers Doug Miller Agenda |
 5 Company Overview (1) Significant shale upside with a solid base of conventional assets (1) The reserve estimates provided throughout this document are effective as of 10/1/09, and
reflect all divestitures announced year-to-date and expected shallow Appalachia and Mid-Continent divestitures, and reflect a strip price adjusted for differentials and excluding hedge effects. Strip pricing ($ per Mcf / $ per Bbl): $3.75/ $70.00, $5.50/$75.00, $6.50/$80.00 for Q4 2009, 2010, 2011 respectively and
$7.00/$80.00 thereafter • 1.2 Tcfe of Proved Reserves – 235 Mmcfe/d of current net production, reserve life of 14.3 years and 68% Proved Developed – 120 Bcfe of shale assets booked as proved with potential for significant reserve adds in year-end reserve report • Significant Unproved Upside – 1.8 Tcfe of probable and possible reserves – 8.6 – 14.2 Tcfe of potential reserves – 4,800 – 7,900 shale locations – 5,300 low-risk development locations – ~1.0 million net acres • 44,000 net acres in the Haynesville play and pursuing additional acquisition and leasing opportunities • 348,000 net acres in the Marcellus play • Successfully shifted focus from acquisitions to developing shale acreage – Haynesville operated production reached a high of 185 Mmcf/d gross in less than a year |
 6 Keys to EXCO’s Strategy • Capital discipline – Continue to spend within cash flow – Maintain liquidity • Held-by-production acreage – Enables the most efficient execution of field development • Appropriate development pace – Focus on efficiency and effectiveness to achieve maximum returns • Focus on midstream and takeaway – Must control infrastructure to maximize value Right Assets Right People Right Strategy We have a significant position in two of the most prolific resource plays in North America along with a focused core of non-shale assets We have a dedicated, industry leading technical staff and a management team with a track record of delivering results We are financially and operationally positioned to effectively grow and develop our assets, even in the current industry cycle Equity Value Growth |
 7 Delivering What We Promise Executing on our 2009 strategic plans Joint venture partner – Joint venture with BG Group positions EXCO for dramatic upstream and midstream growth – Received $1.0 billion of cash and $400 million carry on future deep drilling Asset sales – Closed ~$440 million in divestitures through Q3 2009, with additional $685 million (1) to close in Q4 2009 – Estimated full year 2009 divestitures will exceed $1.1 billion (1) Debt reduction (2) – Reduced debt by approximately $2.0 billion or ~67% – Increased liquidity to nearly $850 million Shale focus – Through Q3 2009, ~60% of our drilling capital has been spent on shale projects
– Built up technical staff while moving towards Haynesville development and Marcellus
evaluation – Examining possible Appalachia joint venture (1) Prior to customary purchase price adjustments (2) Pro forma for expected shallow Appalachia and Mid-Continent divestitures
|
 8 Looking Forward Plans and expectations for 2010 • Focus on our shale assets – Haynesville and Bossier shales in East Texas / North Louisiana – Marcellus shale in Pennsylvania and West Virginia • Significantly increase our acreage position in both shale areas • Continue to emphasize free cash flow generation • Grow net production from 235 Mmcfe/d to 370 – 420 Mmcfe/d by the end of 2010 • Grow proved reserves from 1.2 Tcfe to 1.5 – 1.6 Tcfe by the end of 2010 |
 Financial Review Steve Smith |
 10 Financial Snapshot Significant liquidity with tremendous organic growth (1) September 30, 2009 cash includes $14.5 million of deposits related to Q4
divestitures (2) Subject to normal pre and post closing purchase price adjustments (3) Includes $69.9 million of restricted cash (4) Excludes unamortized bond premium (5) Net of $15.2 million in letters of credit (6) Pro forma for expected shallow Appalachia and Mid-Continent divestitures Remaining 2009 As of September 30, 2009 ($ in thousands) Actual (1) Divestitures (2) Pro Forma Cash (3) 125,664 $ (14,500) $ 111,164 $ Bank debt (L + 175 - 250bps) 1,239,645 (685,000) 554,645 Senior notes (7 1/4%) (4) 444,720 - 444,720 Total debt 1,684,365 $ (685,000) $ 999,365 $ Net debt 1,558,701 $ 888,201 $ Borrowing base 1,700,000 $ 1,300,000 $ Unused borrowing base (5) 445,153 $ 730,153 $ Unused borrowing base plus cash (5) 570,817 $ 841,317 $ (dollars in millions) September 30, 2009 2010E 2014E Production (Mmcfe/d) 235 290 - 340 1,100+ Proved reserves (Tcfe) 1.2 1.5 - 1.6 5.5 - 6.0 Capital expenditures (6) $445 - $495 $1,100+ EBITDA (6) $700 - $750 $2,200+ |
 11 Summary Financial Highlights (1) 2009 projection based actuals for Q1-Q3 and guidance for Q4 (2) Non-GAAP measure - please see the Investor Relations section of our website (www.excoresources.com) under the Non-GAAP reconciliations for reconciliations for 2007 and 2008 (3) Cash flow before changes in working capital (4) 2009 PF for Appalachia and Mid-Continent divestitures (5) Excludes unamortized bond premium Year Ended Year Ended Estimated ($ in millions) December 31, 2007 December 31, 2008 Full Year 2009 (1) Oil and natural gas revenues (before effects of derivative financial instruments) 846.1 $ 1,404.8 $ 545.9 $ Adjusted EBITDA (2) 765.6 $ 978.3 $ 705.8 $ Adjusted net income (2) 128.8 $ 129.1 $ 177.2 $ Cash flow (2)(3) 599.8 $ 841.5 $ 598.1 $ Total production (Bcfe) 121.3 144.5 127.8 Daily production (Mmcfe) 332 395 350 Productive wells drilled (gross) 495 467 n/a Drilling success rate 98% 98% n/a Total acreage (gross) (millions) 1.8 2.1 n/a Financial Position September 30, 2009 Total assets 5,956 $ 4,822 $ 2,631 $ Long term debt, less current maturities Revolving bank credit facility (4) 1,644 $ 2,267 $ 555 $ Senior unsecured term loan - 300 - Senior notes (7 1/4%) (5) 445 445 445 Total long-term debt, less current maturities 2,089 $ 3,012 $ 1,000 $ 7% convertible preferred stock 1,992 $ - $
- $ Common shareholders equity 1,116 $ 1,333 $ 609 $ |
 12 Production Profile and Proved Reserve Growth Drilling program funded within cash flow Proved Reserves (Tcfe) 2010E 2011E 2012E 2013E 2014E Low 1.5 2.8 3.9 4.9 5.2 High 1.6 3.0 4.6 5.4 5.7 Projected Average Production - 200 400 600 800 1,000 1,200 1,400 2010E 2011E 2012E 2013E 2014E Base Conventional Wedge Haynesville Wedge Marcellus Wedge |
 13 Derivatives Position • Pro forma production currently 235 Mmcfe/d • Total of 132 Bcfe hedged at $8.95 per Mcfe • PEPL basis swaps for the remainder of 2009; 10 Mmcf/d swapped at NYMEX minus $1.10 • Expect to monetize a portion of our derivative portfolio in light of recent
divestitures (1) Based on production guidance NYMEX Contract Contract Equivalent Contract natural gas price per NYMEX oil price per Per day price per Percent (in thousands, except price) Mmbtu Mmbtu Bbls Bbl Hedged Equivalent hedged (1) Q4 2009 23,450 8.08 398 80.66 280.9 8.58 112% 2010 66,298 7.62 1,568 104.64 207.4 8.84 64% 2011 12,775 7.48 1,095 113.10 53.0 11.34 10% 2012 5,490 5.91 92 109.30 16.5 7.03 2% 2013 5,475 5.99 - - 15.0 5.99 1% Total 113,488 7.54 $ 3,152 104.68 $ 8.95 $ |
 Operations Review Hal Hickey |
 15 (1) Pro forma for full year 2009 divestitures (2) SEC 12/31/07 total proved reserves, at $6.80/Mcf spot natural gas price and $95.92/Bbl
spot oil price, adjusted for historical differentials and excluding hedge effects (3) SEC 12/31/08 total proved reserves, at $5.71/Mcf spot natural gas price and $44.60/Bbl
spot oil price, adjusted for historical differentials and excluding hedge effects (4) Includes proved, probable and possible reserves (5) Based upon proved reserves and current net production annualized EXCO Snapshot Our 2009 divestitures and JV’s reduce net production by approximately 175
Mmcfe/d and proved reserves by approximately 890 Bcfe December 31, 2007 December 31, 2008 September 30, 2009 (1) Average daily sales (Mmcfe/d) 377 395 235 Proved reserves (Bcfe) (2)(3) 1,865 1,940 1,224 Total reserves (Bcfe) (4) 4,192 6,169 3,074 Total reserves + potential (Bcfe) 4,192 16,810 - 23,078 11,615 - 17,211 Reserve life (years) (5) 13.6 13.5 14.3 Drilling locations (gross) Shale - 9,000 7,900 Non-shale 10,002 11,853 5,300 Approximate net acreage (thousands) 1,498 1,815 910 Well count Gross 10,312 13,213 7,897 Net 8,543 11,175 6,656 Employees 689 880 ~700 Rigs drilling (gross) 22 12 12 |
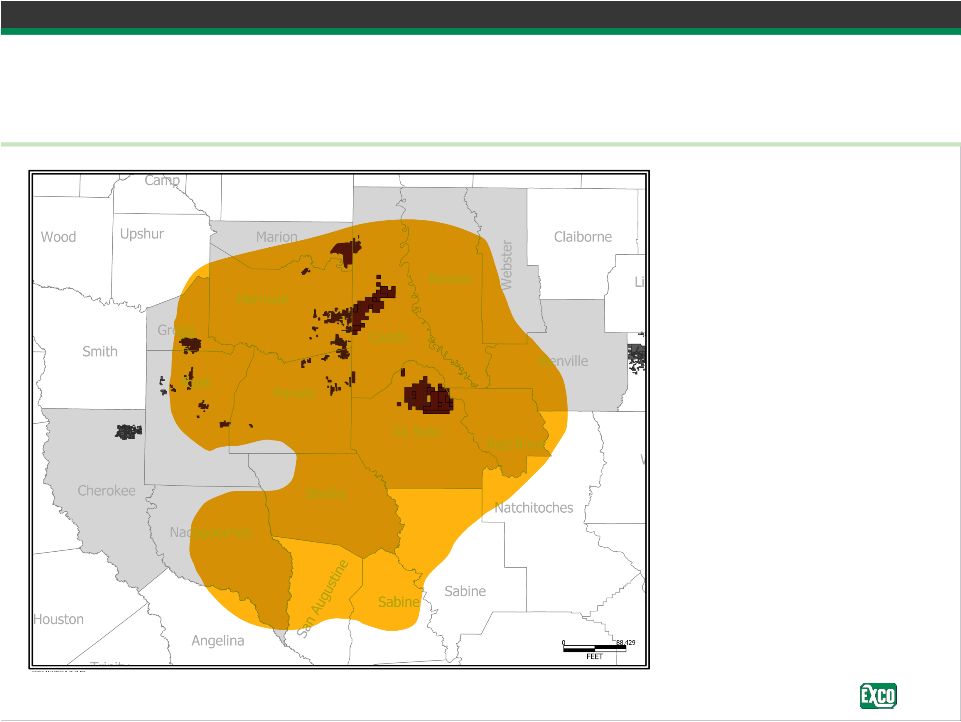
 16 Reserve Base Pro forma for BG transaction and 2009 divestiture program (1) Proved Reserves = 1.2 Tcfe 3P Reserves = 3.0 Tcfe 3P+ Reserves = 11.6 – 17.2 Tcfe Current Production = 235 Mmcfe/d Gross acreage: 1,107,000 Net acreage: 910,000 Proved: 0.3 Tcfe 3P: 0.5 Tcfe 3P+: 7.5 – 13.1 Tcfe Production: 37 Mmcfe/d Gross acreage: 714,000 Net acreage: 640,000 Permian Proved: 0.1 Tcfe 3P: 0.1 Tcfe 3P+: 0.3 Tcfe Production: 20 Mmcfe Gross acreage: 143,000 Net acreage: 102,000 East Texas / North Louisiana Proved: 0.8 Tcfe 3P: 2.4 Tcfe 3P+: 3.8 Tcfe Production: 178 Mmcfe Gross acreage: 250,000 Net acreage: 168,000 Appalachia (1) Pro forma for expected shallow Appalachia and Mid-Continent divestitures
|
 17 Joint Venture With BG Group Strategic partner with shared vision • Sold 50% interest in Area of Mutual Interest (AMI) – 580 Bcfe of proved reserves and 155 Mmcfe/d within AMI • Cash flow implications – Haynesville development will be accelerated, but capital expenditures will be
reduced – In addition to the $727 million (1) in cash at closing for the upstream assets, BG Group has committed $400 million to pay 75% of EXCO’s deep drilling and completion costs • BG Group will pay 87.5% of first $1.1 billion of capital investment for its 50%
ownership • EXCO will pay 12.5% of the first $1.1 billion of capital investment for its 50%
ownership – As a result, EXCO will generate significant free cash flow for future years – Resulting F&D on “carried” wells could be $0.25 - $0.50 per Mcf • Midstream structure – East Texas/North Louisiana Midstream assets were contributed to a newly formed
LLC – BG Group purchased 50% of new LLC for $269 million (1) – Planning is underway for expansions from 2010 to 2012 • Vernon upstream and midstream assets are not included in BG Group transaction (1) Subject to normal post closing purchase price adjustments
|
 18 Our People Key driver of our future growth • Outstanding growth in technical and support staff – Focus on people has resulted in a tremendous technical staff buildup in the last two
years – Technical headcount has increased 70% since January 2008 • Relentless focus on Environmental, Health and Safety (EHS) efforts and results
• BG Group Secondees – Plans for 7 or more upstream and 5 or more midstream secondees – Provide business and technical capabilities to complement our existing personnel
– Highly skilled with extensive experience throughout the world • Our technical staff is supplemented with world-class consultants – Geoscience, drilling, completion, and midstream |
 19 Haynesville Assets and Efforts • 44,000 net Haynesville acres – Actively working to acquire 14,000 – 15,000 net acres to the joint venture – Significant additional opportunities continue to be identified • 2009 Haynesville activity – Initiate drilling of 42 operated horizontal wells – Plan to have 11 operated rigs by year end – Drilled 11 of the top 25 highest IP wells – Average IP exceeds 22 Mmcf/d on first 18 operated horizontal wells • 2010 Haynesville/Bossier plans – Plan to run 14 operated rigs through 2010 – Plan to drill 125 horizontal wells (102 operated) |
 20 EXCO Haynesville Production East Texas / North Louisiana 0 20,000 40,000 60,000 80,000 100,000 120,000 140,000 160,000 180,000 200,000 EXCO Operated Horizontal Haynesville Shale Production Currently 18 wells producing; nine completions expected in Q4 2009 with an additional 24 completions in Q1 2010 185 Mmcf/d Gross Production 3/24/08: CHK announces Haynesville as significant play 12/4/08: XCO turns first horizontal well to sales 3/14/08: XCO TD’s first Haynesville vertical well 8/16/08: XCO spuds first horizontal well |
 21 Haynesville Operations Snapshot • Production: 213 Mmcf/d gross, 40.7 Mmcf/d net on 10/16/2009 – Operated: 160.2 Mmcf/d gross, 37 Mmcf/d net – OBO: 52.6 Mmcf/d gross, 3.7 Mmcf/d net – Cumulative gross Haynesville production: 24.3 Bcfe • Drilling: 10 operated horizontal rigs now drilling – 4 additional operated rigs will arrive between Q4 2009 and January 2010 – Total of 14 operated rigs throughout 2010 – Spud to rig release has dropped from 70 – 75 days initially to as low as 39 days recently • Completion: – In Q3 achieved average operated IP rate in excess of 23 Mmcf/d in DeSoto Parish with
IP rates from 20.5 to 30.1 Mmcf/d; one Caddo Parish completion IP’d at 10.4 Mmcf/d – Fracing our 19 and 20 operated horizontal wells; preparing to complete three additional operated wells – Three non-operated horizontal wells are in the completion phase • Total Program: 56 spud, 45 TD’d, 37 flowing to sales – 46 horizontal wells spud (33 operated / 13 non-operated) – 27 horizontal wells flowing to sales (18 operated / 9 non-operated) – 10 vertical wells flowing to sales (10 operated / 0 non-operated) th th |
 22 Bossier The next frontier Top Bossier Top Haynesville Top Limestone +/- 10,000’ +/- 11,500’ +/- 11,900’ • Potential net gas in place on the JV acreage is ~17 Tcf • Recovery factor to be determined |
 23 EXCO Midstream Operations East Texas/North Louisiana – Positioned for Growth |
 24 Midstream – TGGT Holdings, LLC (TGGT) East Texas/North Louisiana – Positioned for Growth • Current TGGT Assets – Strategically positioned for industry activity – September revenue throughput averaged 535 Mmcf/d; EXCO equity revenue throughput of 268 Mmcf/d • Talco System – 625 miles of gathering lines supported by long-term contracts with producers
– Eleven gathering systems and six gas conditioning skids – September revenue throughput averaged 339 Mmcf/d – 80% equity production and 20% third party production • TGG System – 110 mile intrastate pipeline of 20”, 16” & 12” pipe – 390 Mmcf/d capacity without compression – 530 Mmcf/d capacity with compression – September revenue throughput averaged 196 Mmcf/d – Access to four cryogenic plants and 12 interstate pipelines – 13% equity production and 87% third party production • Haynesville Header System – Construction began early July 2009 on 29 mile intrastate pipeline of 36” pipe – Expected to be fully operational by first quarter 2010 – Completed 5 miles of construction and testing to date – Estimated ultimate capacity could exceed 1.8 Bcf/d |
 25 Midstream – TGGT Holdings, LLC (TGGT) Throughput by System 0.0 0.3 0.5 0.8 1.0 1.3 1.5 1.8 2.0 2.3 2.5 2.8 3.0 3.3 3.5 3.8 4.0 4.3 4.5 Q4 2009 2010 2011 2012 2013 2014 TGG Legacy TGG Header Talco |
 26 Marcellus Opportunity • Largest areal extent of the major shale plays – EXCO has 348,000 net acres in the play • Approximately 223,000 net acres in the over-pressured fairway • 70% of acreage is HBP • Key PA average WI 100%, average NRI 84% • Massive reserve potential – ~7 – 12 Tcf potential on EXCO acreage • Drilling activity and acreage value increasing in the play – Increased service company presence • Proximity to Northeast markets • Attractive returns Marcellus Fairway OH KY WV VA PA Marcellus Fairway |
 27 Marcellus Development Strategy Identified six distinct geologic regions • Southwest – 53,000 net acres • Southeast – 18,000 net acres • Central – 69,000 net acres • North – 41,000 net acres • Northeast – 42,000 net acres • Northwest – minimal acreage • Shale thickness • Reservoir properties • Pressure • Maturity • Gas analysis • Faulting and fracturing Marcellus Leasehold Regional Distinctions Geologic Regions of the Marcellus |
 28 • Drill verticals to test the play: – Obtain additional reservoir data (core, pressure data, etc.) – Test drilling, completion, and production techniques – Identify horizontal drilling targets • Acquire seismic – Identify geologic hazards – Identify favorable, naturally fractured areas to target • Solidify land position – HBP / Term – Continue to fill in existing acreage positions • Identify and develop access to gas markets • Increase permit inventory for large scale development • Prepare to implement horizontal program • Identify and capture growth opportunities Current Marcellus Activity Preparing to implement horizontal program 2009 Drilling Program |
 29 Non-shale 31% Haynesville 28% Marcellus 35% Corporate 6% 2010 Capital Focus Preliminary capital plan 63% Shale Haynesville capital is net of $240 million of EXCO capital carried by BG Group
(1) Includes Horizontal Cotton Valley, Vernon, and Sugg Ranch capital (dollars in millions) 2010E Haynesville Drilling 65 $ Land 25 Seismic 5 Exploration 15 Other 15 Total Haynesville 125 Marcellus Drilling 75 Land 20 Seismic 15 Midstream 30 Other 15 Total Marcellus 155 Non-shale (1) Drilling 85 Land 3 Seismic 7 Midstream 5 Exploration 10 Other 25 Total Non-shale 135 Corporate and other 25 Total capital 440 $ |
 Corporate Governance Doug Ramsey |
 31 Board and Executive Leadership • Experience – Board and executive officers average 32 years of industry experience • Substantial Equity Ownership – 33.8% of common stock owned by directors (including affiliated funds) and named
executive officers • 9 Member Board – 2 inside directors, 7 outside directors • Independence – All 7 outside directors are independent • Committees – Lead Director: Bobby Stillwell – Audit: Jeff Benjamin (Chair), Earl Ellis, Jeff Serota – Compensation: Bobby Stillwell (Chair), Jeff Benjamin, Vince Cebula, Earl Ellis,
Jim Ford, Jeff Serota – Nominating and Corporate Governance: Vince Cebula (Chair), Jeff Benjamin, Jim Ford,
Jeff Serota, Bobby Stillwell |
 32 Board of Directors • Independent Directors – Jeff Benjamin, 48 • Senior Advisor to Cyrus Capital Partners, LP – Vince Cebula, 45 • Managing Director, Jefferies Capital Partners – Earl Ellis, 68 • Chairman and CEO, Whole Harvest Products • Former Managing Partner, Benjamin Jacobson & Sons, LLC, a NYSE Specialist
Firm – Jim Ford, 41 • Managing Director, Oaktree Capital Management, L.P. – Boone Pickens 81 • Chairman and CEO, BP Capital LP – Jeff Serota, 43 • Managing Director, Ares Management, LLC – Bobby Stillwell, 72 • General Counsel, BP Capital LP • Former Partner of Baker Botts LLP • Inside Directors – Doug Miller, 62 • Chairman and CEO, EXCO Resources, Inc. – Steve Smith, 68 • President and CFO, EXCO Resources, Inc. |
 33 Named Executive Officers • Douglas H. Miller, 62 – Chairman and Chief Executive Officer • Stephen F. Smith, 68 – President and Chief Financial Officer • Harold L. Hickey, 53 – Vice President and Chief Operating Officer • J. Douglas Ramsey, Ph.D., 49 – Vice President – Finance, Treasurer and Special Assistant to the Chairman • William L. Boeing, 54 – Vice President, General Counsel and Secretary |
 34 Corporate Governance Ratings • RiskMetrics Group (formerly ISS) Corporate Governance Quotient (CGQ) at October 15, 2009 – Outperform 83.0% of the Russell 3000 – Outperform 74.7% of the Energy group • Corporate Governance Highlights – 7 of 9 directors are independent under NYSE rules – Full board elected annually – Procedure for directors who receive a majority vote withheld to tender their
resignation – No poison pill – Shareholders may call special meetings or act by written consent – No "super-majority" voting requirements added to charter or bylaws
– Incentive Plan administered by Compensation Committee composed solely of independent
directors – Dilution from Incentive Plan was not excessive in 2009 per ISS/RMG standards – Incentive Plan requires shareholder approval prior to increasing the amount of securities that can be issued and repricing any options 1) Actual CGQ percentages reflect EXCO outperforming 65.3% of the Russell 3000 and 62.6% of the Energy
group. CGQ percentages shown above reflect that EXCO’s Compensation Committee and
Nominating and Corporate Governance Committee are composed solely of independent outside directors in accordance with NYSE and SEC requirements. Under RiskMetrics Group’s policies, Mr. Robert L.
Stillwell (a member of such committees) is an “affiliated” outside director because
EXCO paid investment banking fees to Scotia Waterous in 2009 to market and sell certain oil and natural gas properties and Mr. Stilwell’s son works as an associate for Scotia. Mr. Stillwell had no interest in such fees and his
son’s only interest was that of an employee of Scotia generally. Mr. Stillwell’s son
received no special bonus or other compensation related to fees received from EXCO. 1 |
 35 Board Compensation • Board – Non-employee directors receive $25,000 annual retainer in cash or EXCO common
stock at director’s election – Employee directors are not separately compensated for director service – One time option grant of 50,000 shares upon joining the board – Reasonable out-of-pocket expenses for meeting attendance • Committees – Audit: Chair - $50,000 per year, Member - $5,000 per year – Compensation: Chair - $10,000 per year, Member - $5,000 per year – Nominating and Corporate Governance: Chair - $10,000 per year, Member - $5,000 per year – All committees consist of independent directors under applicable NYSE and SEC rules |
 36 Named Executive Officer Compensation • Named Executive Officers have not received salary or bonus increases since April 2007 • Executive salaries and bonuses range from the 25th to the 50th percentile of those paid
by peer companies • EXCO has retained Hewitt Associates to review executive compensation levels for
2010 |
 37 Ownership Table As of October 15, 2009 1) Includes 401(k) holdings of EXCO shares. Includes common stock held by our
directors and their affiliated investment funds. 2) Beneficial
ownership of the shares included in the affiliated column are disclaimed by Messrs. Benjamin, Ford and Serota for proxy purposes. 3) Calculated based on 211,657,189 shares of common stock outstanding on October
15, 2009. Name Position Direct Affiliated (2) Total Percent (3) Granted Vested Weighted Average Exercise Price Doug Miller Chairman and CEO 4,565,644 0 4,565,644 2.2% 1,925,000 1,810,000 8.36 $ Steve Smith President and CFO 579,405 0 579,405 0.3% 543,300 458,300 9.49 $ Hal Hickey VP and COO 262,273 0 262,273 0.1% 266,700 215,450 10.04 $ Doug Ramsey VP - Finance, Treasurer and Special 748,980 0 748,980 0.4% 266,700 215,450 10.04 $ Assistant to the Chairman Lanny Boeing VP, General Counsel and Secretary 5,100 0 5,100 0.0% 606,200 549,650 12.39 $ Jeff Benjamin Outside Director 477,329 5,999,997 6,477,326 3.1% 50,000 50,000 7.50 $ Vince Cebula Outside Director 0 0 0 0.0% 50,000 37,500 16.58 $ Earl Ellis Outside Director 568,777 0 568,777 0.3% 50,000 50,000 7.50 $ Jim Ford Outside Director 0 34,778,946 34,778,946 16.4% 50,000 25,000 13.96 $ Boone Pickens Outside Director 10,619,100 0 10,619,100 5.0% 50,000 50,000 7.50 $ Jeff Serota Outside Director 0 12,892,787 12,892,787 6.1% 50,000 37,500 16.58 $ Bobby Stillwell Outside Director 81,559 0 81,559 0.0% 50,000 50,000 7.50 $ All named executive officers and directors of 17,908,167 53,671,730 71,579,897 33.8% 3,957,900 3,548,850 EXCO as a group (12 persons) Options Common Stock Ownership (1) |
 38 Stock Option Grants • Policy – New Hires: • In 2009, we shifted our policy from granting options to all new employees to granting
options on a discretionary basis to selected new employees. This shift
significantly reduced our burn rate. – Annual Option Bonus: • In 2008, 150 selected employees received option bonus grants equal to 10% of their base
salary in number of shares and such options were issued only after
compensation committee approval. • In 2008, remaining 750 employees received additional cash bonuses pursuant to a cash
bonus plan with vesting provisions similar to option grants. Weighted Average Percent of Strike Price Outstanding Shares Per Share Stock Authorized 23,000,000 NA 10.9% Granted 18,019,150 $14.32 8.5% Exercised 2,397,661 $12.92 1.1% Cancelled 1,575,075 $16.06 0.7% Net outstanding 14,046,414 $14.31 6.6% Net vested 8,938,540 $13.74 4.2% Available for issue 6,555,925 Option Plan Snapshot as of October 26, 2009 |
 39 Other Employee Benefits • EXCO’s officers participate in employee benefit plans including the 401(k) plan and
medical, dental, vision, life and disability insurance on the same basis as the
rest of EXCO’s employees • EXCO matches 100% of employee contributions to the 401(k) plan up to IRS limits
• No pension plan or other special executive compensation arrangements other than
annual executive health checkup at Cooper Clinic • No special executive officer severance or change of control benefits. Under
EXCO’s severance plan, all employees receive 1 year of base salary if
employment is terminated within six months after change of control
|