Attached files
| file | filename |
|---|---|
| 8-K - FORM 8-K - PPL Corp | form8k.htm |
| EX-99.1 - EXHIBIT 99.1 - PPL Corp | form8k-exhibit99_1.htm |

EEI
Financial Conference
Hollywood,
Florida
November
1-4, 2009
Exhibit
99.2

1
Cautionary
Statements and Factors That
May Affect Future Results
May Affect Future Results
Any
statements made in this presentation
about future operating results or other future
events are forward-looking statements under
the Safe Harbor Provisions of the Private
Securities Litigation Reform Act of 1995.
Actual results may differ materially from such
forward-looking statements. A discussion of
factors that could cause actual results or
events to vary is contained in the Appendix to
this presentation and in the Company’s SEC
filings.

2
Investment
Highlights
• Significant
increase in financial performance
– Earnings expected
to increase substantially in 2010 driven by transition to market based
electricity prices after approximately 10 years of fixed generation rates
electricity prices after approximately 10 years of fixed generation rates
– Dividends continue
to be viewed as an important component of shareowner return
– Investment grade
credit ratings are a key competitive asset
• Highly attractive
baseload oriented generation fleet
– Competitively
positioned nuclear, hydro and efficient coal
– Attractive nuclear
and hydro uprate/expansion projects equating to 208 additional MWs
– Potential benefit
from carbon regulation
– Underlying value
strongly and positively correlated to a recovery in natural gas
prices
• Disciplined
multiyear hedging program has created significant value
– 99% for 2009, 99%
for 2010, 89% for 2011 and 58% for 2012 of expected baseload
volumes
– Protects against
further weakness in energy prices and allows for upside participation if
near-
term recovery occurs
term recovery occurs
• Focused on growth
in rate regulated businesses
– Achieved formula
rate mechanism for Transmission tariffs at a ROE of 11.64%
– Highly attractive
Susquehanna-Roseland RTEP project; PPL EU’s portion is expected to cost
about $500 million at an approved 12.89% ROE
about $500 million at an approved 12.89% ROE
– Significant
Distribution Capex to support performance of existing network
– WPD DPCR5: Initial
OFGEM proposal constructive; final proposal in November

PPL’s
Generation Portfolio
3
Morony
Ryan
Cochrane
Rainbow
Black
Eagle
Kerr
Thompson
Falls
Holter
Hauser
Madison
Mystic
Lake
Corette
Colstrip
Montour
Keystone
Conemaugh
Lake
Wallenpaupack
Wallenpaupack
Susquehanna
Martins
Creek
Lower
Mount Bethel
Ironwood
Brunner
Island
Island
Safe
Harbor
Holtwood
Hydro
Coal
Nuclear
Gas/Oil
Coal
Nuclear
Gas/Oil
Key
Montana
Generating
capacity - 1,287 MW
Madison
Morony
Mystic Lake
Rainbow
Ryan
Thompson Falls
Morony
Mystic Lake
Rainbow
Ryan
Thompson Falls
Other
generating stations
(1) PPL has signed
agreements to sell Shoreham, Edgewood and
the PPL
Maine hydro assets.
PPL’s
Generation
Portfolio 3 MoronyRyanCochrane Rainbow Black
Eagle Kerr Thompson
Falls Holter Hauser Madison Mystic
Lake
Corette Colstrip Montour Keystone Conemaugh Lake Wallenpaupack Susquehanna Martins
Creek Lower Mount
Bethel Ironwood Brunner Island Safe
Harbor Holtwood HydroCoal Nuclear Gas/Oil Key Montana Generating
capacity – 1,287 MW Black
EagleCochrane ColstripCorette Hauser Holter Kerr Madison MoronyMystic
LakeRainbow RyanThompson Falls Other generating
stations University Park, IL – 540 MW Wallingford, CT –
225 MW Shoreham and Edgewood, Long Island, NY – 159 MW
(1) Nine Hydroelectric Facilities, ME – 39 MW
(1) Wyman, ME – 51 MW PennsylvaniaGenerating capacity –
10,894 MW Brunner Island Holtwood Lake
WallenpaupackLower Mount Bethel Martins
Creek Montour SusquehannaConemaughKeystoneSafe
Harbor Ironwood (1) PPL has signed agreements to sell Shoreham,
Edgewood and the PPL Maine hydro assets.

4
Note:
As of 9/30/2009
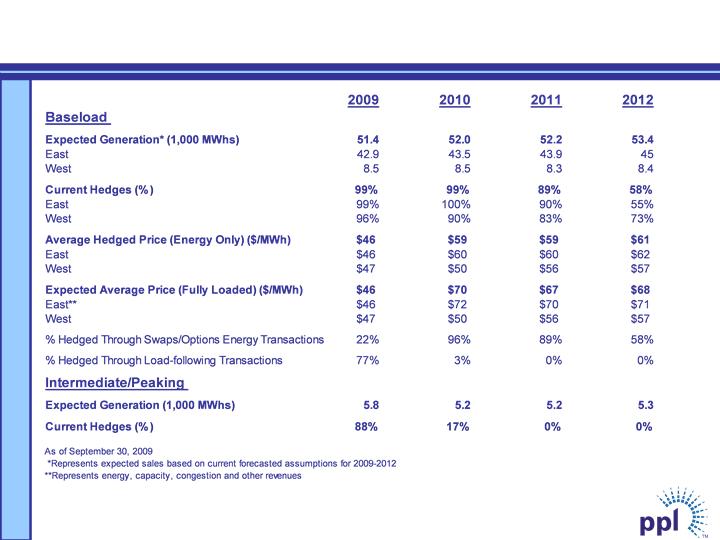
…provides
higher level of earnings and cash flow predictability
2010 2011 2012
99%
Band
1
Band
2
89%
Band
3
58%
{
Target
Range
Range
Actual
Hedge
Level
Hedge
Level
Hedges
Swaps/Options 96% 89% 58%
Load-following 3% 0% 0%
Multi-year Hedging
Program…

Note: As of
9/30/2009
2009 2010 2011 2012
Uranium 100% 100% 100% 100%
Coal
East 100%
97%
83%
60%
West 100% 100% 100%
90%
Total 100% 98% 88% 68%
$35
$40
$45
$50
$55
Balance
of 2009
2010
2011
max
collar price
fixed
base price
min
collar price
Weighted
Average
$/Ton
at
Mine (1)
7%
11%
%
Diesel Surcharge
78%
5%
0%
%
Collars
88%
89%
%
Fixed Base Price (2)
22%
0%
5
(1) Base prices for
East wholly owned plants, which include Montour & Brunner Island but not
Keystone & Conemaugh.
(2) Excludes contracts
subject to mining-related oil surcharges and/or price
collars.
Current Fuel Hedge
Positions

PPL
Electric Utilities
• Transmission and
Distribution business
with 1.4 million customers in Pennsylvania
with 1.4 million customers in Pennsylvania
• Attractive rate
base investment
opportunities to support infrastructure and
reliability
opportunities to support infrastructure and
reliability
• Superior customer
service
• Constructive
regulatory relationships
6

Millions
$3,006
$3,442
$3,907
$4,290
$4,679
$2,809
7
CAGR
Distribution
= 6.8%
Transmission
= 19.7%
PPL
Electric Utilities Rate Base

Attractive
Transmission Development Project 8 • PPL Electric to
build Pennsylvania portion of the 150-mile Susquehanna to Roseland,
NJ 500 kV transmission line. New Jersey portion of the
line to be built by PSEG. • Project needed for reliability
and is part of PJM’s Regional Transmission Expansion
Plan (RTEP) • PJM-directed completion date June
2012 • Cost of PPL’s portion of the line is estimated
at $500 million • Formula rate mechanism for
transmission – Settlement agreement approved by FERC for
11.64% ROE* including RTO adder • PPL rate structure for RTEP
project – 12.89% ROE* – CWIP in rate base –
Recovery of costs if terminated *ROE increases to 11.68% including
RTO adder and to 12.93% for RTEP projects in June 2010

Western
Power Distribution
• Electricity
Distribution company
that delivers electricity to 2.6
million end users in the United
Kingdom
that delivers electricity to 2.6
million end users in the United
Kingdom
• No commodity
exposure
• Highly attractive
regulatory
construct
construct
• Final proposal for
DCPR5
expected in November
expected in November
9

Forecast
10
|
* Earnings
from ongoing operations - See Appendix for the per share reconciliation of
reported earnings and earnings from ongoing operations.
|
|
|
$2.02
$3.50
Per
Share
$1.90
$1.60
$3.10
Strong Expected
Earnings Growth


(1) Market prices based
on the average of broker quotes as of 9/30/2009
(2) 24-hour
average
(3) NYMEX and TZ6NNY
forward gas prices on 9/30/2009
(4) Market Heat Rate =
PJM on-peak power price divided by TZ6NNY gas price
A-1
Market
Prices
Market
Prices (1) Market prices based on the average of broker quotes
as of 9/30/2009 (2) 24-hour average (3) NYMEX and TZ6NNY
forward gas prices on 9/30/2009 (4) Market Heat Rate = PJM on-peak
power price divided by TZ6NNY gas price Actual 2008 2009
2010 2011 2012 $81 $44 $59 $63 $65 $49 $32 $39 $41
$43 $69 $38 $48 $52 $53 $65 $36 $52 $56 $57 $51
$29 $41 $45 $45 $59 $33 $47 $51 $51 $8.84 $4.04 $6.21
$6.87 $7.02 $9.85 $4.79 $7.01 $7.69 $7.80 8.2 9.2 8.4 8.2
8.3 $82.00 $158.24 $181.39 $136.79 $123.63 89.6% 89.5%
91.6% 88.6% 91.1% (Per MWD) EQA HEAT
RATE(4) TZ6NNY PJM
MARKET ATC(2) NYMEX GAS(3) CAPACITY
PRICES Mid-Columbia Forward(1) On-Peak Off-Peak ATC(2) ELECTRIC PJM On-Peak Off-Peak A-1

Market
Segment
Baseload
63%
Peaking
18%
Intermediate
19%
Installed
Capacity
MW
Coal
34%
Gas/Oil
38%
Nuclear
18%
Hydro
8%
QFs
2%
Diverse and
Balanced Fleet
Geography
Production
GWh
PJM
85%
WECC
11%
Coal
49%
Gas/Oil
10%
10%
Nuclear
32%
Hydro
9%
NEPOOL
3%
NYISO
1%
Baseload
oriented fleet augmented by attractive load-following capabilities
A-2
Note: As of
September 30, 2009

PPL
has proactively complied with current environmental regulations on an economic
basis
(1)
Colstrip is located in Montana
(2)
Keystone & Conemaugh: PPL is a minority owner and does not
operate
A-3
Environmental
Control Equipment
Environmental
Control Equipment Keystone(2) Conemaugh(2) Control
Device Removes Unit 1 Unit 2 Unit 3 Unit 1 Unit 2 Unit 3 & 4 Unit 3 & 4
Unit 1 & 2 Unit 1 & 2 Low Nox Burners NOx SCR
NOx Scrubbers SO2 Brunner Island Montour
Colstrip(1) = Installed = Potential = Under
Construction PPL has proactively complied with current environmental
regulations on an economic basis (1) Colstrip is located in
Montana (2) Keystone & Conemaugh: PPL is a minority owner and
does not operate A-3
A-4
Supply
Segment Asset Hedge Positions

2009 2010
Expected Gross Margin $35 Mil $35 Mil
Expected Gross Margin $35 Mil $35 Mil
Geographic
Diversity
2009 2010
NEPOOL
24%
MISO
2%
PJM
74%
PJM
71%
NEPOOL
27%
MISO
2%
A-5
Supply Segment
Marketing and Trading Overview

A-6
Pennsylvania
Electricity Distribution Rate Regulation
• Retail
distribution of electricity and natural gas are regulated by the
Pennsylvania Public Utility Commission
Pennsylvania Public Utility Commission
– Pennsylvania
deregulated the generation of electricity in 1997
– Transmission and
wholesale sales of electricity are regulated by the Federal
Energy Regulatory Commission
Energy Regulatory Commission
• Retail
distribution rates are set by a combination of base rate
proceedings and automatic adjustment clauses
proceedings and automatic adjustment clauses
• Base rate
proceedings
– Initiated by a
utility filing or, rarely, through a Commission investigation
– Based upon the
traditional cost of service, rate of return model
– The utility must
have the opportunity to earn a "fair rate of return“ on used and
useful rate base
useful rate base
– The utility must
file historic data; may file future data
– The Commission
must enter an order within nine months of the utility's filing or the
proposed rates go into effect subject to refund
proposed rates go into effect subject to refund
• Automatic
adjustment clauses
– Specifically
authorized in the Public Utility Code
– Limited by court
decision to expense items, not capital costs
– Usually based on a
forecast of costs with an annual reconciliation to actual costs
– Have been used to
recover the costs of: energy, stranded investment,
transmission and universal service
transmission and universal service

PPL
Electric Utilities 2011 to mid-2013
Procurement Plan
Procurement Plan
A-7
• Residential load
to be supplied under 12- and 24-month
load-following contracts, 5- and 10-year fixed block
products, and spot purchases
load-following contracts, 5- and 10-year fixed block
products, and spot purchases
• Small commercial
and industrial to be supplied under 12-
and 24-month load-following contracts, and spot
purchases
and 24-month load-following contracts, and spot
purchases
• Large commercial
and industrial load to be supplied
under hourly pricing products and an optional fixed-price
product
under hourly pricing products and an optional fixed-price
product

A-8
August 11,
2009 July
19, 2011
October 20,
2009
October 18, 2011
January 19,
2010
January 9, 2012
April
20, 2010 April
3, 2012
July
20, 2010 July
17, 2012
October 19,
2010
October 16, 2012
April
18, 2011
January 22, 2013
P
P
P
Completed
PPL
Electric Utilities 2011 to mid-2013
Procurement Plan Schedule
Procurement Plan Schedule
• Due dates for
bids:

A-9
UK
Electricity Distribution Regulation
• Electricity and
natural gas supply and distribution are regulated by the UK’s Office of
Gas and Electricity Markets (OFGEM)
Gas and Electricity Markets (OFGEM)
• Electricity
distribution revenues are set every five years through a Distribution
Price
Control Review (DPCR) process
Control Review (DPCR) process
– Price control is
based on a forward looking assessment of income sufficient to finance
an
efficient business
efficient business
– Revenues must
cover operating and capital costs at an efficient level for the service
territory
• Efficiency is
determined through a detailed comparative analysis of all UK
electricity
distribution companies
distribution companies
– Typically, the
DPCR results in a one-time price reduction followed by annual adjustments
for
inflation less an efficiency factor
inflation less an efficiency factor
• An incentive /
penalty arrangement exists for reliability and customer service
levels
• The revenue that a
company can earn in each of the five years is the sum of:
– The Regulator’s
view of efficient operating costs,
– A return on the
value of Regulated Asset Base (“RAB”), and
– A return of
capital being the depreciation of the RAB
• The DPCR is
currently in process with the next five-year period beginning April 1,
2010
2010

A-10
$1,503
$1,299
$1,888
$2,185
$1,933
$1,845
Capital
Expenditures by Segment

Millions
A-11
Note: See
Appendix for reconciliation of cash from operations to free cash flow before
dividends
Free
Cash Flow before Dividends Forecast

(1) Reported as of
9/30/2009
A-12
Domestic
facilities consist of a diverse bank group, with no bank and its
affiliates providing an aggregate commitment of more than 15% of the total
committed capacity.
affiliates providing an aggregate commitment of more than 15% of the total
committed capacity.
Liquidity
Profile
Liquidity Profile (1)
Reported as of 9/30/2009 A-12 Institution Facility Expiration
Date Total Facility (Millions) Letters of Credit
Outstanding (1) (Millions) Drawn (1) (Millions)
Availability (Millions) PPL Energy Supply 5-year Credit
Facility Jun-2012 $3,225 $455 $285 $2,485 Bilateral Credit Facility
Mar-2010 200 4 0 196 5-year Structured Credit Facility Mar-2011 300 230 0
70 364-day Credit Facility Sep-2010 400 0 0 400 $4,125 $689 $285
$3,151 PPL Electric Utilities 5-year Credit Facility May-2012 $190 $5 $0
$185 Asset-backed Credit Facility Jul-2010 150 0 0 150 $340 $5 $0
$335 WPD 3-year Credit Facility Jul-2012 £210 £0 £54 £156 5-year
Credit Facility Jan-2013 150 0 127 23 Uncommitted Credit Facilities 60 0
21 39 Letter of Credit Facility Mar-2010 3 3 0 0 £423 £3 £202 £218
Domestic facilities consist of a diverse bank group, with no bank and its
affiliates providing an aggregate commitment of more than 15% of the total
committed capacity.

A-13
PPL
Energy Supply Collateral Profile

Note: As of
9/30/2009
A-14
(1) PPL Capital Funding
$201 million maturity paid off in March 2009
(2) PPL Electric
Utilities $486 million maturity paid off in August 2009
Debt
Maturities
Debt
Maturities Note: As of 9/30/2009 A-14 2009 2010 2011
2012 2013 PPL Energy Supply $0 $0 $500 $0 $737 PPL
Capital Funding 0 (1) 0 0 0 0 PPL Electric Utilities 0 (2) 0 0 0 500
WPD Group 0 0 0 0 0 Total $0 $0 $500 $0 $1,237
(Millions) (1) PPL Capital Funding $201 million maturity paid off in
March 2009 (2) PPL Electric Utilities $486 million maturity paid
off in August 2009

(Millions)
A-15
|
|
2008
|
2009
|
2010
|
|
Cash from
Operations
|
$
595
|
$741
|
$1,437
|
|
Increase/(Decrease)
in cash due to:
|
|
|
|
|
Capital
Expenditures
|
(939)
|
(753)
|
(892)
|
|
Investment
in Energy Project
|
(203)
|
|
|
|
Asset
Sales
|
|
216
|
39
|
|
Other
Investing Activities-net
|
(58)
|
(15)
|
(61)
|
|
Free Cash
Flow before Dividends
|
($605)
|
$189
|
$523
|
|
|
|
|
|
Actual Projected
Note: Asset
Sales in 2009 include the anticipated proceeds from the announced pending sale
of most of the Maine generating assets
and all of the Long Island generating assets. Closing of the sale of the Maine assets is expected on or about November 1,
2009. Closing on the sale of the Long Island assets is expected later in 2009 or in the first quarter of 2010. Asset sales in
2010 include the anticipated proceeds from the announced pending sale of the remaining Maine generating assets.
Supply Segment
Reconciliation of Cash from Operations
to Free Cash Flow before Dividends
to Free Cash Flow before Dividends

(Millions)
A-16
|
|
2008
|
2009
|
2010
|
|
Cash from
Operations
|
$
643
|
$561
|
$250
|
|
Less
Transition Bond Repayment
Increase/(Decrease)
in cash due to:
|
(293)
|
|
|
|
Capital
Expenditures
|
(286)
|
(295)
|
(568)
|
|
Asset
Sales & Other
|
303
|
|
|
|
Free Cash
Flow before Dividends
|
$367
|
$266
|
($318)
|
|
|
|
|
|
Note: Asset
Sales in 2008 includes the net proceeds from the sale of gas and propane
businesses
Actual Projected
PA
Delivery Segment Reconciliation of Cash from
Operations to Free Cash Flow before Dividends
Operations to Free Cash Flow before Dividends

(Millions)
A-17
|
|
2008
|
2009
|
2010
|
|
Cash from
Operations
|
$
279
|
$230
|
$248
|
|
Increase/(Decrease)
in cash due to:
|
|
|
|
|
Capital
Expenditures
|
(278)
|
(251)
|
(428)
|
|
Free Cash
Flow before Dividends
|
$ 1
|
($ 21)
|
($180)
|
|
|
|
|
|
Actual Projected
International
Delivery Segment Reconciliation of Cash
from Operations to Free Cash Flow before Dividends
from Operations to Free Cash Flow before Dividends

A-18
Reconciliation of
PPL’s Reported Earnings and
Earnings from Ongoing Operations
Earnings from Ongoing Operations
Reconciliation of PPL’s Reported Earnings and Earnings
from Ongoing Operations Forecast Actual High Low
2009 2009 2008 2007 Earnings from Ongoing Operations per share
of common stock $1.90 $1.60 $2.02 $2.60 Special items (net of
taxes): Unrealized gains (losses) from energy-related, non-trading
economic hedges (0.45) (0.45) 0.67 0.08 Unrealized losses from
foreign currency economic hedges (0.01) (0.01) Adjustments -nuclear
decommissioning trust investments (0.04) Sale of Latin American businesses
0.67 Sale of telecommunication operations (0.06) Sale of gas and
propane businesses (0.01) (0.11) Settlement of Wallingford cost-based
rates 0.09 Impairment of transmission rights (0.04) Change in U.K.
tax rate 0.14 Workforce reductions (0.03) (0.03) (0.02) Synfuel tax
adjustment (0.04) Montana basin seepage litigation (0.01)
Impairments & other impacts - emission allow ances (0.04) (0.04)
(0.07) Impairments - assets held for sale & other (0.10) (0.10) (0.05)
Taxes - Latin American businesses (0.06) (0.06) Changes in tax
accounting method (0.07) (0.07) (0.76) (0.76) 0.45 0.75
Reported Earnings per share of common stock $1.14 $0.84 $2.47 $3.35
Note: Per share amounts are based on diluted shares outstanding.

Credit
Ratings
A-19
|
|
Moody’s
|
Standard
& Poor’s
|
Fitch
|
|
PPL
Corporation
|
|
|
|
|
Issuer
Rating
|
Baa2
|
BBB
|
BBB
|
|
Outlook
|
NEGATIVE
|
NEGATIVE
|
STABLE
|
|
|
|
|
|
|
PPL
Energy Supply
|
|
|
|
|
Issuer
Rating
|
|
BBB
|
BBB
|
|
Tax-Exempt
Bonds*
|
Aaa
|
AAA
|
|
|
Senior
Notes
|
Baa2
|
BBB
|
BBB+
|
|
Outlook
|
STABLE
|
NEGATIVE
|
STABLE
|
|
|
|
|
|
|
PPL
Capital Funding
|
|
|
|
|
Issuer
Rating
|
|
|
BBB
|
|
Senior
Unsecured Debt
|
Baa2
|
BBB-
|
BBB
|
|
Subordinated
Debt
|
Baa3
|
BB+
|
BBB-
|
|
Outlook
|
NEGATIVE
|
|
STABLE
|
|
|
|
|
|
|
PPL
Electric Utilities
|
|
|
|
|
Issuer
Rating
|
Baa1
|
A-
|
BBB
|
|
First
Mortgage Bonds
|
A3
|
A-
|
A-
|
|
Tax-Exempt
Bonds**
|
A3/Baa1
|
A/A-
|
|
|
Senior
Secured Debt
|
A3
|
A-
|
A-
|
|
Commercial
Paper
|
P-2
|
A-2
|
F-2
|
|
Preferred
Stock
|
Baa3
|
BBB
|
BBB
|
|
Preference
Stock
|
Baa3
|
BBB
|
BBB
|
|
Outlook
|
NEGATIVE
|
NEGATIVE
|
STABLE
|
* Letter
of Credit-Backed Security
** Includes
both Insured and Non-Insured Securities

Credit Ratings
(cont.)
A-20
Commercial
Paper
A-
BBB+
Baa1
Senior
Unsecured Debt
F2
A-2
P-2
Commercial
Paper
POSITIVE
NEGATIVE
STABLE
Outlook
BBB+
BBB+
Baa1
Issuer
Rating
A-
BBB+
Baa1
Senior
Unsecured Debt
F2
A-2
Commercial
Paper
POSITIVE
NEGATIVE
STABLE
Outlook
Western
Power Distribution (South West) PLC
BBB+
BBB+
Issuer
Rating
Western
Power Distribution (South Wales) PLC
POSITIVE
NEGATIVE
STABLE
Outlook
POSITIVE
Outlook
BBB
Issuer
Rating
WPD
Holdings LLP
BBB-
BBB-
Baa3
Issuer
Rating
BBB
BBB-
Baa3
Senior
Unsecured Debt
A-3
Commercial
Paper
WPD
Holdings Limited
BBB
BBB-
Baa3
Pass-Through
Certificates
STABLE
STABLE
Outlook
PPL
Montana
Fitch
Standard
& Poor’s
Moody’s

A-21
PPL
Corporation
(NYSE:
PPL) is a Fortune 500 company with headquarters in Allentown, Pa. The
Company’s diversified
corporate strategy is to achieve growth in energy supply margins while limiting volatility in both cash flows and earnings and to
achieve stable, long-term growth in regulated delivery businesses through efficient operations and strong customer and
regulatory relations. The strategy is carried out through four principal subsidiaries:
PPL
EnergyPlus, which markets
energy in key U. S. markets.
PPL
Generation, which operates
more than 12,000 megawatts of electricity generating capacity in Pennsylvania,
Montana,
Maine, Illinois, New York and Connecticut, with an additional 208 megawatts of planned uprate projects.
Maine, Illinois, New York and Connecticut, with an additional 208 megawatts of planned uprate projects.
PPL
Electric Utilities, which delivers
electricity to 1.4 million customers in Pennsylvania.
PPL
Global, which delivers
electricity to 2.6 million customers in the United Kingdom.
Security
Ratings
Moody’s S&P Fitch
PPL
Corp.
Corporate
Credit Rating Baa2 BBB BBB
PPL
Capital Funding, Inc.
Senior
Unsecured Debt Baa2 BBB- BBB
PPL
Electric Utilities Corp.
First
Mortgage Bonds A3 A- A-
Senior
Secured Bonds A3 A- A-
PPL
Energy Supply
Senior
Unsecured Notes Baa2 BBB BBB+
WPD
Holdings Limited
Senior
Unsecured Debt Baa3 BBB- BBB
WPD
Operating Cos.
Senior
Unsecured Debt Baa1 BBB+ A-
Contacts
Joseph
P. Bergstein, Jr.
Manager-Investor
Relations
Phone: (610)
774-5609
Fax: (610)
774-5106
jpbergstein@pplweb.com
www.pplweb.com
PPL
Facts

A-22
Statements
contained in this presentation, including statements with respect to future
earnings, energy prices,
margins and sales, growth, revenues, expenses, cash flow, asset disposition, marketing performance, hedging,
regulation, corporate strategy and generating capacity and performance, are “forward-looking statements” within
the meaning of the federal securities laws. Although PPL Corporation believes that the expectations and
assumptions reflected in these forward-looking statements are reasonable, these statements are subject to a
number of risks and uncertainties, and actual results may differ materially from the results discussed in the
statements. The following are among the important factors that could cause actual results to differ materially from
the forward-looking statements: market demand and prices for energy, capacity and fuel; weather conditions
affecting customer energy usage and operating costs; competition in power markets; the effect of any business
or industry restructuring; the profitability and liquidity of PPL Corporation and its subsidiaries; new accounting
requirements or new interpretations or applications of existing requirements; operating performance of plants and
other facilities; environmental conditions and requirements and the related costs of compliance, including
environmental capital expenditures and emission allowance and other expenses; system conditions and
operating costs; development of new projects, markets and technologies; performance of new ventures; asset
acquisitions and dispositions; any impact of hurricanes or other severe weather on our business, including any
impact on fuel prices; receipt of necessary government permits, approvals, rate relief and regulatory cost
recovery; capital market conditions and decisions regarding capital structure; the impact of state, federal or
foreign investigations applicable to PPL Corporation and its subsidiaries; the outcome of litigation against PPL
Corporation and its subsidiaries; stock price performance; the market prices of equity securities and the impact
on pension income and resultant cash funding requirements for defined benefit pension plans; the securities and
credit ratings of PPL Corporation and its subsidiaries; political, regulatory or economic conditions in states,
regions or countries where PPL Corporation or its subsidiaries conduct business, including any potential effects
of threatened or actual terrorism or war or other hostilities; foreign exchange rates; new state, federal or foreign
legislation, including new tax legislation; and the commitments and liabilities of PPL Corporation and its
subsidiaries. Any such forward-looking statements should be considered in light of such important factors and in
conjunction with PPL Corporation’s Form 10-K and other reports on file with the Securities and Exchange
Commission.
Forward-Looking
Information Statement

A-23
“Earnings
from ongoing operations” excludes the impact of special items. Special items
include charges or credits that are unusual or
nonrecurring. Special items also include unrealized gains and losses from energy-related, non-trading economic hedges, foreign
currency-related economic hedges and impairments of securities in PPL’s nuclear decommissioning trust funds. The energy-related, non
-trading economic hedges are used to hedge a portion of the economic value of PPL’s generation assets and PPL’s load-following and
retail activities. This economic value is subject to changes in fair value due to market price volatility of the input and output commodities
(e.g., fuel and power). Also included in this special item is the ineffective portion of qualifying cash flow hedges. The foreign currency-
related economic hedges are used to hedge a portion of the net income of the international delivery business segment. This economic
value in U.S. dollars is subject to changes in the British Pound Sterling to U.S. dollar exchange rate. Management believes that the
exclusion of such amounts provides a better matching of ongoing earnings to the actual amounts settled for our underlying hedged
assets. Earnings from ongoing operations should not be considered as an alternative to reported earnings, or net income attributable to
PPL, which is an indicator of operating performance determined in accordance with generally accepted accounting principles (GAAP).
PPL believes that earnings from ongoing operations, although a non-GAAP measure, is also useful and meaningful to investors because
it provides them with PPL’s underlying earnings performance as another criterion in making their investment decisions. PPL’s
management also uses earnings from ongoing operations in measuring certain corporate performance goals. Other companies may use
different measures to present financial performance.
“Free
cash flow before dividends” is derived by deducting capital expenditures and
other investing activities-net, as well as the
repayment of transition bonds, from cash flow from operations. Free cash flow before dividends should not be considered as an
alternative to cash flow from operations, which is determined in accordance with GAAP. PPL believes that free cash flow before
dividends, although a non-GAAP measure, is an important measure to both management and investors since it is an indicator of the
company’s ability to sustain operations and growth without additional outside financing beyond the requirement to fund maturing debt
obligations. Other companies may calculate free cash flow before dividends in a different manner.
"Domestic
Gross Energy Margins" is intended to supplement the investors' understanding of
PPL’s domestic non-trading and trading
activities by combining applicable income statement line items and related adjustments to calculate a single financial measure. PPL
believes that "Domestic Gross Energy Margins" is useful and meaningful to investors because it provides them with the results of PPL's
domestic non-trading and trading activities as another criterion in making their investment decisions. "Domestic Gross Energy Margins"
is not intended to replace "Operating Income," which is determined in accordance with GAAP, as an indicator of overall operating
performance. PPL's management also uses "Domestic Gross Energy Margins" in measuring certain corporate performance goals used
in determining variable compensation. Other companies may use different measures to present the results of their non-trading and
trading activities.
Definitions of
Non-GAAP Financial Measures