Attached files
| file | filename |
|---|---|
| 8-K - FORM 8-K - Energy Future Holdings Corp /TX/ | d8k.htm |
| EX-99.1 - PRESS RELEASE - Energy Future Holdings Corp /TX/ | dex991.htm |
 EFH
Corp. Q3 09 Investor Call October 30, 2009 Exhibit 99.2 |
 1 Safe Harbor Statement This presentation contains forward-looking statements, which are subject to various
risks and uncertainties. Discussion of risks and uncertainties that
could cause actual results to differ materially from management's current
projections, forecasts, estimates and expectations is contained in EFH Corp.'s
filings with the Securities and Exchange Commission (SEC). In addition
to the risks and uncertainties set forth in EFH Corp.'s SEC filings, the
forward-looking statements in this presentation regarding the company’s long- term hedging program could be affected by, among other things: any change in the ERCOT
electricity market, including a regulatory or legislative change, that results
in wholesale electricity prices not being largely driven by natural gas
prices; any decrease in market heat rates as the long-term hedging program
generally does not mitigate exposure to changes in market heat rates; the
unwillingness or failure of any hedge counterparty or the lender under the
commodity collateral posting facility to perform its obligations under a long-term hedge agreement or the facility, as applicable; or any other unforeseen event that results
in the inability to continue to use a first lien to secure a substantial
portion of the hedges under the long-term hedging program. In
addition, the forward-looking statements in this presentation regarding
the company’s new generation plants could be affected by, among other
things, any adverse judicial rulings with respect to the plants’ construction permits. Regulation G This presentation includes certain non-GAAP financial measures. A reconciliation of
these measures to the most directly comparable GAAP measures is included in
the appendix to this presentation. |
    2 Today’s Agenda Paul Keglevic Executive Vice President & CFO Financial and Operational Overview Q3 09 Review Q&A |
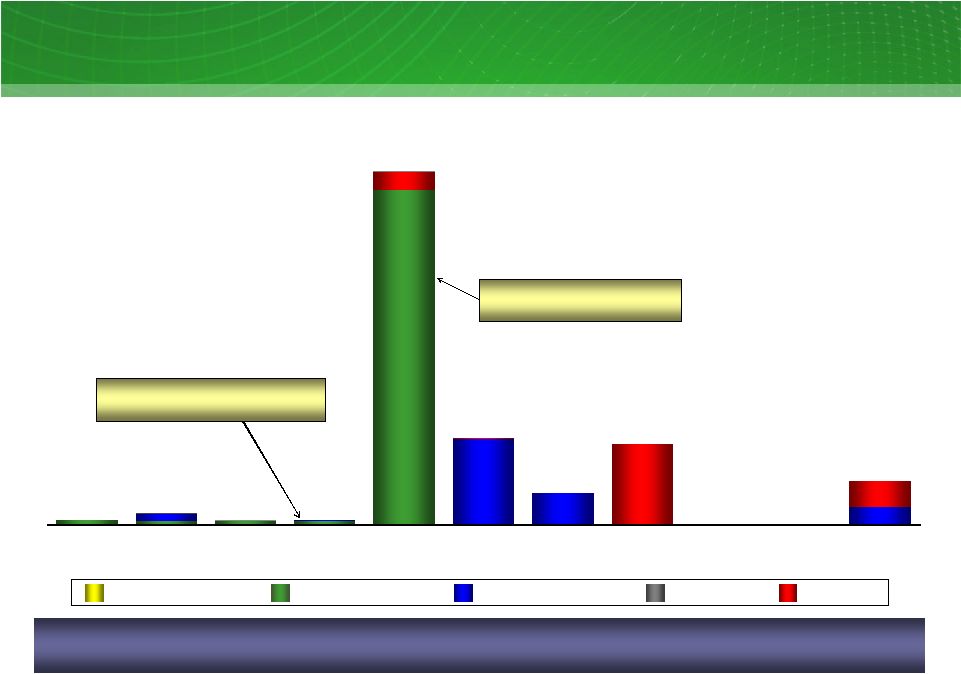
 3 (21) 18 322 (23) (3,955) 3,617 Q3 08 (322) - Impairment of emissions allowances 31 10 Adjusted (non-GAAP) operating income (loss) attributable to EFH Corp. 113 90 Unrealized mark-to-market net losses (gains) on interest rate swaps 2 (2) (80) Q3 09 (16) Other (noncash) 3,953 Unrealized commodity-related mark-to-market net gains Items excluded from adjusted (non-GAAP) operating earnings (after tax): (3,697) GAAP net income (loss) attributable to EFH Corp. Change Factor Consolidated: reconciliation of GAAP net income (loss) to adjusted (non-GAAP) operating results 1 Q3 08 vs. Q3 09; $ millions, after tax 1 See Appendix for Regulation G reconciliations and definition. 2 Q3 08 includes $17 million (after tax) representing a reserve established against
accounts receivable (excluding termination-related costs) from affiliates of Lehman Brothers Holdings, Inc. arising from commodity hedging and trading activities, all of
which were terminated in September 2008. Q3 09 includes $16 million (after tax) representing a write-off of rate case disallowed regulatory assets and $14
million (after tax) arising from the reversal of a use tax accrual recorded in purchase accounting related to periods prior to the October 2007 merger. EFH Corp. Adjusted (Non-GAAP) Operating Results 2 |
 4 (323) - 323 Impairment of emissions allowances 90 90 - Goodwill impairment charge (noncash) 8 (502) (510) Adjusted (non-GAAP) operating loss attributable to EFH Corp. (319) (342) (23) Unrealized mark-to-market net gains on interest rate swaps 31 142 (983) YTD 08 (29) 2 Other (noncash) (601) (459) Unrealized commodity-related mark-to-market net losses (gains) Items excluded from adjusted (non-GAAP) operating earnings (after tax): 1,190 207 GAAP net income (loss) attributable to EFH Corp. Change YTD 09 Factor Consolidated: reconciliation of GAAP net income (loss) to adjusted (non-GAAP) operating
results¹ YTD 08 vs. YTD 09; $ millions, after tax EFH Corp. Adjusted (Non-GAAP) Operating Results 1 See Appendix for Regulation G reconciliations and definition. 2 YTD 08 includes $17 million (after tax) representing a reserve established against accounts receivable
(excluding termination-related costs) from affiliates of Lehman Brothers Holdings, Inc.
arising from commodity hedging and trading activities, all of which were terminated in September 2008. YTD 09 includes $16 million (after tax) representing a write-off of rate case disallowed regulatory assets and $14 million
(after tax) arising from the reversal of a use tax accrual recorded in purchase accounting
related to periods prior to the October 2007 merger. 2 |
 5 Consolidated: key drivers of the change in EFH Corp. (non-GAAP) operating
results Q3 09 vs. Q3 08; $ millions, after tax (4) Higher depreciation & amortization exp. driven by amort. of intangibles arising from
purchase accounting (14) Higher interest expense primarily due to increased amortization of interest rate hedge
losses 43 Higher margin from asset management and retail activities 9 Higher output from nuclear-fueled plants (13) Higher SG&A expense primarily due to higher retail bad debt expense (3) All other 13 Effect on retail business of Hurricane Ike in 2008 19 Lower purchased power costs during plant outages 81 Contribution margin 48 Total improvement - Competitive business Regulated business: (26) Net income attributable to noncontrolling interests Competitive business 1 : 9 Higher results primarily due to favorable resolution of income tax matters (2) Higher net operating expenses primarily due to new generation plants 31 Total change in adjusted (non-GAAP) operating results Better (Worse) Than Q3 08 Description/Drivers 1 Competitive business consists of Competitive Electric segment and Corp. &
Other. EFH Corp. Adjusted (Non-GAAP) Operating Results
|
 6 Consolidated: key drivers of the change in EFH Corp. (non-GAAP) operating
results YTD 09 vs. YTD 08; $ millions, after tax (55) Higher interest expense primarily due to increased amortization of interest rate hedge
losses 35 Higher output from nuclear-fueled plants 68 Higher margin from asset management and retail activities (22) Total decrease – Regulated business Regulated business: (43) Higher SG&A expense due to higher retail bad debt expense and increased costs related
to outsourcing transition and the new retail customer care system (22) Higher depreciation & amortization exp. driven by amort. of intangibles arising from
purchase accounting 13 Effect on retail business of Hurricane Ike in 2008 31 Lower amortization of intangibles arising from purchase accounting 58 Lower purchased power costs during plant outages (5) All other 200 Contribution margin 84 Total improvement - Competitive business (17) Lower results due to milder weather and a weaker economy (54) Net income attributable to non-controlling interests Competitive business : (5) Higher interest and depreciation expense, partially offset by favorable income tax
adjustments 4 All other 8 Total change in adjusted (non-GAAP) operating results Better (Worse) Than YTD 08 Description/Drivers 1 Competitive business consists of Competitive Electric segment and Corp. &
Other. EFH Corp. Adjusted (Non-GAAP) Operating Results 1 |
 7 TCEH EFH Corp. Adjusted EBITDA (Non-GAAP) YTD 09 YTD 08 3,819 3,596 1 See Appendix for Regulation G reconciliations and definition. Includes $4 million,
$(1) million, $11 million and $15 million in Q3 08, Q3 09, YTD 08 and YTD 09, respectively, of Corp. & Other Adjusted EBITDA. EFH Corp. Adjusted EBITDA (non-GAAP) 1 Q3 08 vs. Q3 09 and YTD 08 vs. YTD 09; $ millions Oncor Q3 09 Q3 08 1,512 1,402 1,086 994 427 404 2,760 2,564 1,044 1,021 8% 6% Q3 09 and YTD 09 Adjusted EBITDA variances were driven by the same key drivers
impacting (non-GAAP) operating
results. |
 8 19,519 18,602 52,932 49,593 13,092 13,415 30,927 30,596 Oncor Operational Results Electricity distribution points of delivery End of period, thousands of meters Electric energy billed volumes; GWh Q3 08 Q3 09 Q3 08 Q3 09 5% decline in Q3 SMB & LCI volumes Growth below ERCOT estimated CAGR of 1.9% Q3 09 Highlights Lower energy volumes due to a weaker economy and milder weather Higher SAIDI 1 due to ninth wettest Septe mber on record Execution of AMS plan – approximately 310,000 advanced meters installed through September 9 of 14 CREZ-related Certificates of Convenience and Necessity filed with the PUC SAIDI (nonstorm) 1 ; Minutes Q3 08 Q3 09 91.0 82.6 September 09 weather-related interruptions 1 System Average Interruption Duration Index (nonstorm) is the average number of minutes
electric service is interrupted per consumer in a year. 2 SMB – small business; LCI – large commercial and industrial Residential SMB & LCI2 2% QTR 1% YTD 08 YTD 09 32,017 32,611 80,189 83,859 3,116 3,142 10% |
 9 4% QTR TXU Energy Operational Results Lowered prices and started new campaign YTD business customer growth offset economic impacts Q3 08 Q3 09 Total residential customers End of period, thousands Q3 09 Q2 09 Retail electricity sales volumes by customer class; GWh 1,911 1,876 Q3 09 Highlights Higher residential sales volumes reflect the effect of Hurricane Ike in 2008 and warmer weather in South Texas Business load growth attributable to new customers offset reduced customer usage as a result of a weaker economy Lower residential customer counts reflect competitive activity in the marketplace Implemented new Legislative and PUC requirements related to marketing and customer protections Lowered prices in August and started new advertising campaign in early October TXU Energy HQ earned EPA’s Energy
Star award 1 Small business customers 2 Large commercial and industrial customers YTD 09 2% QTR SMB 1 LCI 2 Residential YTD 08 38,906 39,445 15,377 15,995 22,153 22,312 4,049 10,951 10,905 5,802 9,098 9,348 4,038 2,598 2,241 6,228 |
 10 Luminant Operational Results Nuclear-fueled generation; GWh 15,512 5,219 YTD 08 Q3 08 Coal-fueled generation; GWh¹ 12,240 12,115 YTD 09 Q3 08 Strong performance from the nuclear fleet 4% QTR YTD available generation increased ~300GWh Q3 09 Highlights Solid safety performance Continued strong nuclear operations Higher Q3 09 availability of coal units of ~140 GWh, offset by increased economic backdown Economic backdown of coal units increased by ~260 GWh and ~1,000 GWh in Q3 09 and YTD 09, respectively Q3 09 YTD 08 33,697 32,820 4,996 14,448 Q3 09 YTD 09 1 Q3 09 and YTD 09 exclude 94 GWh of generation from Sandow 5 and Oak Grove 1. |
 11 EFH Corp. Liquidity Management 4,380 5,814 8,050 3 EFH Corp. (excluding Oncor) available liquidity As of 9/30/09; $ millions 4 5 • Liquidity reflected in the table does not include the unlimited capacity available under the Commodity Collateral Posting Facility for ~ 650 million MMBtu of natural gas hedges 4,100 4,085 2,700 938 1,736 1,250 791 459 482 1,703 Facility Limit LOCs/Cash Borrowings Availability Cash and Equivalents 2 TCEH Letter of Credit Facility 1 TCEH Revolving Credit Facility TCEH Delayed Draw Term Loan Facility Short Term Investments EFH Corp. and TCEH have sufficient liquidity to meet their anticipated short-term
needs, but will continue to monitor market conditions to ensure financial
flexibility. Facility to be used for issuing letters of credit for general corporate purposes.
Cash borrowings of $1.250 billion were drawn on this facility in October 2007, and, except for $115 million related to a letter of credit drawn in June 2009, have been retained as restricted cash. Outstanding
letters of credit are supported by the restricted cash. Facility availability includes
$141 million of undrawn commitments from a subsidiary of Lehman Brothers that has filed for bankruptcy. These funds are only available from the fronting banks and the swingline lender, and exclude $26 million of requested draws not funded by the Lehman
subsidiary. Facility was used to fund expenditures for constructing certain new generation
facilities and environmental upgrades of existing generation facilities. Reported availability of zero excludes $15 million of commitments from the Lehman subsidiary. Includes $417 million cash and $65 million letter of credit investment, maturing on 3/31/10, in collateral
funding transactions with counterparties to certain interest rate swaps and commodity hedging
transactions. Pursuant to the Public Utility Commission of Texas (PUC) rules, TCEH
is required to maintain available liquidity to assure adequate credit worthiness of TCEH’s retail electric provider subsidiaries, including the ability to return customer deposits, if necessary. As a result, at
9/30/09, the total availability under the TCEH credit facilities should be further reduced by $237 million. 1 2 3 4 5 |
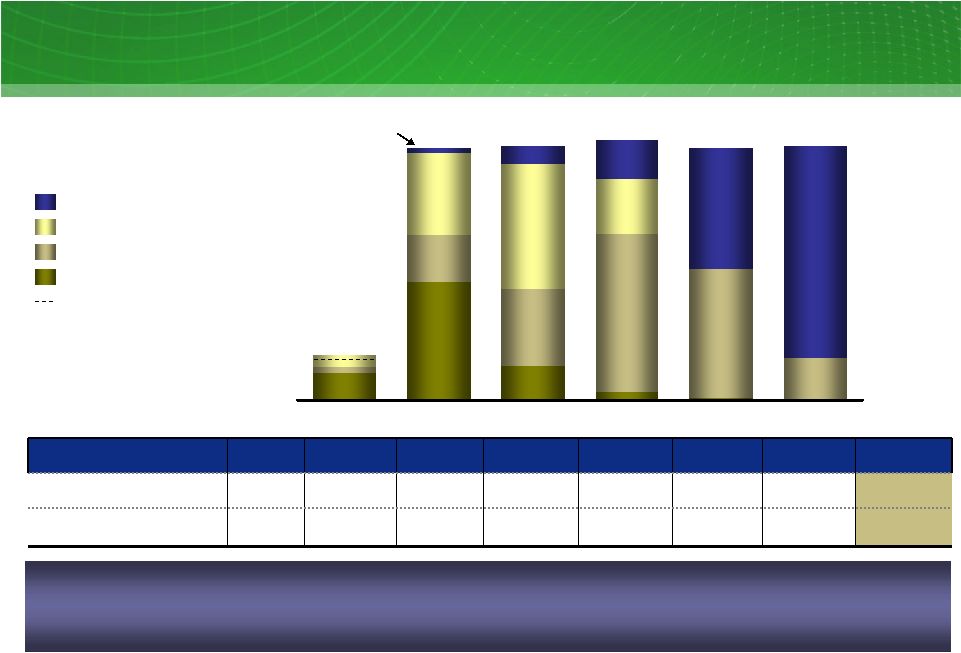
 12 Current Maturity Profile The Credit Amendment approved in Q3 09 increases 2 nd lien debt capacity by $4 billion and provides unlimited 1 st lien capacity necessary to extend 2014 1 st lien maturities. 19,353 1,848 1,028 1,516 5,000 4,655 1,006 2010 2011 2012 2013 2014 2015 2016 2017 2018 2019 2020+ 309 664 251 305 2 20,401 2 5,023 1,870 4,694 11 TCEH-Secured EFH Corp EFCH TCEH-Revolver TCEH-Unsecured 2,558 EFH Corp. debt maturities 1 (excluding Oncor), 2010-2020 and thereafter As of 9/30/09; $ millions 11 $2.70 billion Revolving Credit Facility expires in 2013 $1.25 billion LOC Facility expires in 2014 1 Includes amortization of the $4.1 billion Delayed Draw Term Loan and additional debt issued in May 2009 related to the PIK election of the EFH and TCEH Toggle Notes. 2 Excludes borrowings under the TCEH Revolving Credit Facility maturing in 2013, the Deposit Letter of Credit Facility maturing in 2014 and unamortized discounts and premiums. |
    13 Today’s Agenda John Young President & CEO Financial and Operational Overview Q3 09 Review Q&A |
 14 14 Luminant Solid-Fuel Development Program Sandow Power Plant Unit 5 Rockdale, Texas Oak Grove Power Plant Robertson County, Texas Texas lignite Texas lignite Primary fuel ~86% ~99% Percent complete at 9/30/09 N/A August 09 Initial synchronization Late 2009 800 MW Unit 1 Unit 2 Estimated net capacity 800 MW Substantial completion date Mid 2010 Estimated net capacity 581 MW Primary fuel Texas lignite Initial synchronization July 2009 Substantial completion date September 30, 2009 Luminant’s construction of three new lignite-fueled generating units continues to
track on budget, with Sandow 5 achieving substantial completion on Sept 30 th . 1 Substantial completion date is the contractual milestone when Luminant takes over operations of the unit from the EPC contractor. 1 1 |
    15 Today’s Agenda EFH Corp. Senior Executive Team Financial and Operational Overview Q3 09 Review Q&A |
 16 Questions & Answers |
 Appendix – Additional Slides and Regulation G Reconciliations |
 18 18 18 Unrealized Mark-To-Market Impact Of Hedging – QTR Unrealized mark-to-market impact of hedging program 9/30/09 vs. 6/30/09; mixed measures, pre-tax Factor Measure 2009 2010 2011 2012 2013 2014 Total or Avg. 6/30/09 Natural gas hedges mm MMBtu ~112 ~341 ~496 ~492 ~300 ~94 ~1,835 Wtd avg hedge price $/MMBtu ~$7.99 ~$7.80 ~$7.56 ~$7.36 ~$7.19 ~$7.80 Natural gas prices $/MMBtu ~$4.39 ~$6.06 ~$6.89 ~$7.16 ~$7.30 ~$7.43 Cum. MtM gain at 6/30/09 $ billions ~$0.4 ~$0.7 ~$0.1 ~$0.1 ~$0.0 ~$0.2 ~$1.5 9/30/09 Natural gas hedges mm MMBtu ~58 ~298 ~466 ~492 ~300 ~97 ~1,711 Wtd avg hedge price $/MMBtu ~$8.05 ~$7.80 ~$7.56 ~$7.36 ~$7.19 ~$7.80 Natural gas prices $/MMBtu ~$4.75 ~$6.21 ~$6.87 ~$7.00 ~$7.06 ~$7.17 Cum. MtM gain at 9/30/09 $ billions ~$0.2 ~$0.7 ~$0.1 ~$0.2 ~$0.0 ~$0.2 ~$1.4 Q3 09 MtM gain/(loss) $ billions ~($0.2) ~$0.0 ~$0.0 ~$0.1 ~$0.0 ~$0.0 ~($0.1) Increases in natural gas prices during the third quarter 2009 resulted in a ~$100 million
(~$65 million after tax) unrealized mark-to-market net loss in GAAP
income for Q3 09. 1 Weighted average prices are based on sales
prices of forward natural gas sales positions in the long-term hedging
program based on NYMEX Henry Hub (excluding the impact of offsetting purchases for rebalancing and pricing point basis transactions). Where
collars are reflected, sales price represents the collar floor price.
9/30/09 prices for 2009 represent October 1, 2009 through December 31, 2009
values. 2 MtM values include the effects of all transactions in the long-term hedging program
including offsetting purchases (for re-balancing) and natural gas basis deals. 3 As of 9/30/09. 2009 represents October 1, 2009 through December 31, 2009 volumes. Where
collars are reflected, the volumes are estimated based on the natural gas price sensitivity (i.e., delta position) of the derivatives. The notional volumes for collars are approximately 150 million MMBtu, which corresponds to a delta position of approximately 97 million MMBtu in 2014. 1 2 2 1 3 |
 19 19 19 Unrealized Mark-To-Market Impact Of Hedging - YTD Unrealized mark-to-market impact of hedging program 9/30/09 vs. 12/31/08; mixed measures, pre-tax Factor Measure 2009 2010 2011 2012 2013 2014 Total or Avg. 12/31/08 Natural gas hedges mm MMBtu ~173 ~450 ~502 ~492 ~300 ~101 ~2,018 Wtd avg hedge price $/MMBtu ~$8.16 ~$7.82 ~$7.56 ~$7.36 ~$7.19 ~$7.80 Natural gas prices $/MMBtu ~$6.11 ~$7.13 ~$7.31 ~$7.23 ~$7.15 ~$7.15 Cum. MtM gain at 12/31/08 $ billions ~$0.4 ~$0.3 ~$0.0 ~$0.0 ~$0.0 ~$0.2 ~$0.9 9/30/09 Natural gas hedges mm MMBtu ~58 ~298 ~466 ~492 ~300 ~97 ~1,711 Wtd avg hedge price $/MMBtu ~$8.05 ~$7.80 ~$7.56 ~$7.36 ~$7.19 ~$7.80 Natural gas prices $/MMBtu ~$4.75 ~$6.21 ~$6.87 ~$7.00 ~$7.06 ~$7.17 Cum. MtM gain at 9/30/09 $ billions ~$0.2 ~$0.7 ~$0.1 ~$0.2 ~$0.0 ~$0.2 ~$1.4 YTD 09 MtM gain $ billions ~($0.2) ~$0.4 ~$0.1 ~$0.2 ~$0.0 ~$0.0 ~$0.5 Reductions in natural gas prices during the first nine months of 2009 resulted in a ~$550 million (~$360 million after tax) unrealized mark-to-market net gain in GAAP income for
YTD 09. 1 Weighted average prices are based on sales
prices of forward natural gas sales positions in the long-term hedging
program based on NYMEX Henry Hub (excluding the impact of offsetting purchases for rebalancing and pricing point basis transactions). Where
collars are reflected, sales price represents the collar floor price. 9/30/09 prices for 2009 represent October 1, 2009 through December 31, 2009 values. 2 MtM values include the effects of all transactions in the long-term hedging program
including offsetting purchases (for re-balancing) and natural gas basis deals. 3 As of 9/30/09. 2009 represents October 1, 2009 through December 31, 2009 volumes. Where
collars are reflected, the volumes are estimated based on the natural gas price sensitivity (i.e., delta position) of the derivatives. The notional volumes for collars are approximately 150 million MMBtu, which corresponds to a delta position of approximately 97 million MMBtu in 2014. 1 2 3 1 2 |
 20 20 20 TCEH Natural Gas Exposure TCEH Natural Gas Position 09-14 ; million MMBtu Hedges Backed by Asset First Lien Open Position 64 272 79 109 176 189 290 125 41 279 490 582 586 4 17 367 300 11 97 28 12 91 600 583 587 95 BAL 09 2010 2011 2012 2013 2014 100% Hedge Level Factor Measure BAL09 2010 2011 2012 2013 2014 Total or Average Natural gas hedging program million MMBtu ~39 ~298 ~466 ~492 ~300 ~97 ~1,692 Overall estimated percent of total NG position hedged percent ~109% ~98% ~93% ~85% ~52% ~16% ~71% TXUE and Luminant Net Positions Hedges Backed by CCP 1 2 1 As of 9/30/09. Balance of year 2009 is from November 1, 2009 to December 31, 2009. Assumes
conversion of electricity positions based on a ~8.0 heat rate with natural gas being on the margin ~75-90% of the time (i.e. when other technologies are forecast to be on
the margin, no natural gas position is assumed to be generated). 2 Includes estimated retail/wholesale effects. 2009 position includes ~9 million MMBtu of short gas
positions associated with retail gas puts and proprietary trading positions; excluding these positions, 2009 position is ~99% hedged. TCEH has hedged approximately 71% of its estimated Henry Hub-based natural gas price
exposure from November 1, 2009 through December 31, 2014 . More
than 95% of the natural gas hedges are supported directly by a first lien or
by the TCEH Commodity Collateral Posting |
 21 21 21 EFH Corp. Adjusted EBITDA Sensitivities Commodity Percent Hedged at September 30, 2009 Change BOY Impact $ millions 7X24 market heat rate (MMbtu/MWh) ~96 0.1 MMBtu/MWh ~0 NYMEX gas price ($/MMBtu) >95 $1/MMBtu ~9 Texas gas vs. NYMEX Henry Hub price ($/MMBtu) 3,4 >95 $0.10/MMBtu ~0 Diesel ($/gallon) 5 ~100 $1/gallon ~0 Base coal ($/ton) 6 ~100 $5/ton ~0 Nuclear fuel ($/lb) ~100 $10/lb. ~0 Generation operations Baseload generation (TWh) n.a. 1 TWh ~15 Mine productivity (tons produced) n.a. 1 million tons ~11 Retail operations Balance of 2009 Residential contribution margin ($/MWh) 6 TWh $1/MWh ~6 Residential consumption 6 TWh 1% ~3 Business markets consumption 6 TWh 1% ~2 Impact on EFH Corp. Adjusted EBITDA 1 09E; mixed measures 1 Balance-of-year (BOY) estimate based on commodity positions as of 9/30/09, net
of long-term hedges and wholesale/retail effects, excludes gains and losses incurred prior to September 30, 2009. 2 Simplified representation of heat rate position in a single TWh position. In reality, heat rate impacts are differentiated across baseload plants (linked primarily to changes in North Zone 7x24), natural gas plants (primarily North Zone 5x16) and wind (primarily West Zone
7x24). 3 Assumes conversion of electricity positions based on a ~8.0 market heat rate with
natural gas being on the margin ~75-90% of the time (i.e., when coal is forecast to be on the margin, no natural gas position is assumed to be generated). 4 The percentage hedged represents the amount of estimated natural gas exposure based on Houston Ship Channel (HSC) gas price sensitivity as a proxy for Texas gas price. 5 Includes fuel surcharge on rail transportation. 6 Excludes fuel surcharge on rail transportation. 2 3 Through the balance of 2009, the majority of commodity-related risks are significantly
mitigated. |
 22 22 22 2009 Commodity Prices 3.19% $6.88 $3.38 $70.40 7.94 $8.71 $9.12 Q3 08 Actual Commodity Units Q3 09 Actual YTD 09 Actual BOY 09 NYMEX gas price $/MMBtu $3.15 $3.80 $4.75 HSC gas price $/MMBtu $3.14 $3.58 $4.64 7x24 market heat rate (HSC) MMbtu/MWh 9.45 8.29 7.00 North Zone 7x24 power price $/MWh $29.36 $29.14 $32.23 Gulf Coast ultra-low sulfur diesel 4 $/gallon $1.79 $1.57 $1.84 PRB 8400 coal 5 $/ton $7.05 $8.26 $8.30 LIBOR interest rate 6 percent 0.84% 1.31% 0.63% Commodity prices 1 09E; mixed measures 1 Balance-of-year (BOY) estimate based on commodity prices as of 9/30/09 for
October 2009 through December 2009. 2 Based on NYMEX forward curve: actuals from Platts-GD 3 Based on market clearing price for energy 4 Actuals from Platts-GC ULSD, BOY from Bloomberg 5 Actuals from Platts, BOY from Bloomberg 6 LIBOR 6-month interest rate from Bloomberg 2 3 |
 23 Financial Definitions Refers to the combined results of the Competitive Electric segment and Corporate &
Other. Competitive Business Results Operating revenues less fuel, purchased power costs, and delivery fees, plus or minus net
gain (loss) from commodity hedging and trading activities, which on an
adjusted (non-GAAP) basis, exclude unrealized gains and losses. Contribution Margin (non- GAAP) Net income (loss) from continuing operations before interest expense and related charges,
and income tax expense (benefit) plus depreciation and amortization.
EBITDA (non-GAAP) Generally accepted accounting principles. GAAP The purchase method of accounting for a business combination as prescribed by GAAP,
whereby the purchase price of a business combination is allocated to
identifiable assets and liabilities (including intangible assets) based upon their fair values. The excess of the purchase price over the fair values of assets and liabilities is
recorded as goodwill. Depreciation and amortization due to purchase
accounting represents the net increase in such noncash expenses due to recording the fair market values of property, plant and equipment, debt and other assets and liabilities,
including intangible assets such as emission allowances, customer
relationships and sales and purchase contracts with pricing favorable to market prices at the date of the Merger. Amortization is reflected in revenues, fuel, purchased power
costs and delivery fees, depreciation and amortization, other income and
interest expense in the income statement. Purchase Accounting Net income (loss) adjusted for items representing income or losses that are not
reflective of underlying operating results. These items include
unrealized mark-to-market gains and losses, noncash impairment charges and other charges, credits or gains that are unusual or nonrecurring. EFH Corp. uses adjusted (non-GAAP) operating earnings as a measure of performance and believes that analysis of its business by external users is enhanced by visibility to
both net income (loss) prepared in accordance with GAAP and adjusted
(non-GAAP) operating earnings (losses). Adjusted (non-GAAP)
Operating Results EBITDA adjusted to exclude interest income, noncash items, unusual items, interest
income, income from discontinued operations and other adjustments allowable
under the EFH Corp. Senior Notes bond indenture. Adjusted EBITDA plays an important role in respect of certain covenants contained in the EFH Corp. Senior
Notes. Adjusted EBITDA is not intended to be an alternative to GAAP
results as a measure of operating performance or an alternative to cash flows from operating activities as a measure of liquidity or an alternative to any other measure of financial performance presented in accordance with GAAP, nor is it intended to be used as a measure of free cash flow available for EFH
Corp.’s discretionary use, as the measure excludes certain cash
requirements such as interest payments, tax payments and other debt service requirements. Because not all companies use identical calculations, Adjusted EBITDA may not be comparable to
similarly titled measures of other companies. Adjusted EBITDA (non-GAAP) Definition Measure |
 24 Table 1: EFH Corp. Adjusted EBITDA Reconciliation Q3 08, Q3 09, YTD 08 and YTD 09 $ millions 22 - 221 - - 512 - 325 55 (22) 213 (1,053) 2,277 1,217 2,505 (462) (983) YTD 08 2 (7) (3) 1 26 3 - 79 23 (18) 42 (407) 1,384 456 1,039 (31) (80) Q3 09 9 9 Losses on sale of receivables (7) - Amortization of ”day one” net loss on Sandow 5 power purchase agreement 90 - Impairment of goodwill 3 - EBITDA amount attributable to consolidated unrestricted subsidiaries 54 - Net income attributable to noncontrolling interests 5 503 Impairment of assets and inventory write-down 259 80 Purchase accounting adjustments (30) (9) Interest income 71 20 Amortization of nuclear fuel (713) (6,142) Unrealized net (gain) loss resulting from hedging transactions Adjustments to EBITDA (pre-tax): (1,043) (415) Oncor EBITDA 117 78 Oncor distributions/dividends 2,136 831 Interest expense and related charges 3,883 1,286 254 207 YTD 09 3,617 Net income (loss) attributable to EFH Corp. 2,001 Income tax expense (benefit) 431 Depreciation and amortization 6,880 EBITDA Q3 08 Factor Note: Table and footnotes to this table continue on following page 1 2 3 |
 25 Table 1: EFH Corp. Adjusted EBITDA Reconciliation (continued from previous page)
Q3 08, Q3 09, YTD 08 and YTD 09 $ millions 3,819 926 2,893 100 (10) 65 22 9 9 YTD 09 3,596 807 2,789 100 32 44 38 1 24 YTD 08 1,512 384 1,128 - (21) 23 3 1 (3) Q3 09 1 Severance expense 5 14 Non-cash compensation expense 4 1,076 Adjusted EBITDA per Incurrence Covenant 1,402 Adjusted EBITDA per Restricted Payments Covenant - Expenses incurred to upgrade or expand a generation station 9 326 Add back Oncor adjustments 18 Transaction and merger expenses 7 14 Transition and business optimization costs 6 25 Restructuring and other 8 Q3 08 Factor 1 Includes amortization of the intangible net asset value of retail and wholesale power
sales agreements, environmental credits, coal purchase contracts, nuclear
fuel contracts and power purchase agreements and the stepped-up value of nuclear fuel. Also includes certain credits not recognized in net income due to purchase accounting. 2 Reflects the completion in the first quarter of 2009 of the fair value calculation supporting the goodwill impairment charge that was recorded in the fourth quarter of 2008. 3 Includes impairment of emissions allowances. 4 Accounted for under accounting standards related to stock compensation and exclude
capitalized amounts. 5 Includes amounts incurred related to outsourcing, restructuring and other amounts deemed
to be in excess of normal recurring amounts. 6 Includes professional fees primarily for retail billing and customer care systems
enhancements. 7 Includes costs related to the Merger, the Sponsor management fee, outsourcing transition
costs, costs related to certain growth initiatives and costs related to the
Oncor sale of noncontrolling interests. 8 Includes a litigation accrual and a charge related to the bankruptcy of a subsidiary of
Lehman Brothers Holdings Inc. 9 Reflects noncapital outage costs. |
 26 Table 2: TCEH Adjusted EBITDA Reconciliation Q3 08, Q3 09, YTD 08 and YTD 09 $ millions 1 8 22 - - 221 - 502 - 290 55 (45) 1,347 827 1,756 (425) (811) YTD 08 1 5 9 - - (6,142) - 500 - 68 20 (20) 6,516 296 581 2,010 3,629 Q3 08 5 5 Corp. depreciation, interest and income tax expense included in SG&A 9 2 Losses on sale of receivables (7) (7) Amortization of ”day one” net loss on Sandow 5 power purchase agreement 9 1 Severance expense 5 1 (3) Non-cash compensation expense 4 70 - Impairment of goodwill² 3 1 EBITDA amount attributable to consolidated unrestricted subsidiaries 2 2 Impairment of assets and inventory write-down³ 224 67 Purchase accounting adjustments¹ (40) (21) Interest income 71 23 Amortization of nuclear fuel (713) (3) Unrealized net (gain) loss resulting from hedging transactions Adjustments to EBITDA (pre-tax): 1,331 770 Interest expense and related charges 3,016 862 330 493 YTD 09 (25) Net income (loss) (11) Income tax expense (benefit) 303 Depreciation and amortization 1,037 EBITDA Q3 09 Factor Note: Table and footnotes to this table continue on following page
|
 27 Table 2: TCEH Adjusted EBITDA Reconciliation (continued from previous page)
Q3 08, Q3 09, YTD 08 and YTD 09 $ millions 2,790 8 218 2,564 100 32 1 30 YTD 08 1,108 9 13 1,086 - (22) 1 3 Q3 09 22 12 Transition and business optimization costs 6 3 (6) Transaction and merger expenses 7 21 4 Other adjustments allowed to determine Adjusted EBITDA per Maintenance Covenant 9 2,760 994 Adjusted EBITDA per Incurrence Covenant 2,842 1,051 Adjusted EBITDA per Maintenance Covenant 100 - Expenses incurred to upgrade or expand a generation station 8 61 53 Expenses related to unplanned generation station outages 8 (15) YTD 09 31 Restructuring and other Q3 08 Factor 1 Includes amortization of the intangible net asset value of retail and wholesale power sales agreements, environmental credits, coal purchase contracts, nuclear fuel contracts, power purchase agreements and the stepped up value of nuclear fuel. Also includes certain credits not recognized in net income due to purchase accounting. 2 Reflects the completion in the first quarter of 2009 of the fair value calculation supporting the goodwill impairment charge that was recorded in the fourth quarter of 2008. 3 Includes impairment of emissions allowances. 4 Excludes capitalized amounts. 5 Includes amounts incurred related to outsourcing, restructuring and other amounts deemed
to be in excess of normal recurring amounts. 6 Includes professional fees primarily for retail billing and customer care systems
enhancements. 7 Includes costs related to the Merger, outsourcing transition costs and certain growth
initiatives. 8 Reflects noncapital outage costs. 9 Primarily pre-operating expenses related to Oak Grove and Sandow 5 generation facilities. |
 28 1 Purchase accounting adjustments consist of amounts related to the accretion of an
adjustment (discount) to regulatory assets resulting from purchase
accounting. Table 3: Oncor Adjusted EBITDA Reconciliation Q3 08, Q3 09, YTD 08 and YTD 09 $ millions 1,021 - (33) (34) 1,088 370 229 180 309 YTD 08 404 (1) (11) (12) 428 128 80 81 139 Q3 08 (30) (10) Purchase accounting adjustments ¹ (32) (13) Interest income 1,075 420 EBITDA 1,044 427 Adjusted EBITDA 31 30 Transition and business optimization costs 258 85 Interest expense and related charges 405 140 272 YTD 09 132 Net income 56 Income tax expense 147 Depreciation and amortization Q3 09 Factor |