Attached files
| file | filename |
|---|---|
| 8-K - FORM 8-K - DTE Electric Co | c91577e8vk.htm |
| EX-99.1 - EXHIBIT 99.1 - DTE Electric Co | c91577exv99w1.htm |
Exhibit 99.2

| Business and Financial Update October 30, 2009 |
| 2 Safe Harbor Statement The information contained herein is as of the date of this presentation. Many factors may impact forward-looking statements including, but not limited to, the following: the length and severity of ongoing economic decline resulting in lower demand, customer conservation and increased thefts of electricity and gas; changes in the economic and financial viability of our customers, suppliers, and trading counterparties, and the continued ability of such parties to perform their obligations to the Company; high levels of uncollectible accounts receivable; access to capital markets and capital market conditions and the results of other financing efforts which can be affected by credit agency ratings; instability in capital markets which could impact availability of short and long-term financing; potential for continued loss on investments, including nuclear decommissioning and benefit plan assets and the related increases in future expense and contributions; the timing and extent of changes in interest rates; the level of borrowings; the availability, cost, coverage and terms of insurance and stability of insurance providers; the effects of weather and other natural phenomena on operations and sales to customers, and purchases from suppliers; economic climate and population growth or decline in the geographic areas where we do business; environmental issues, laws, regulations, and the increasing costs of remediation and compliance, including actual and potential new federal and state requirements that could include carbon and more stringent mercury emission controls, a renewable portfolio standard, energy efficiency mandates, and a carbon tax or cap and trade structure; nuclear regulations and operations associated with nuclear facilities; impact of electric and gas utility restructuring in Michigan, including legislative amendments and Customer Choice programs; employee relations and the impact of collective bargaining agreements; unplanned outages; changes in the cost and availability of coal and other raw materials, purchased power and natural gas; volatility in the short-term natural gas storage markets impacting third-party storage revenues; cost reduction efforts and the maximization of plant and distribution system performance; the effects of competition; the uncertainties of successful exploration of gas shale resources and challenges in estimating gas reserves with certainty; impact of regulation by the FERC, MPSC, NRC and other applicable governmental proceedings and regulations, including any associated impact on rate structures; changes in and application of federal, state and local tax laws and their interpretations, including the Internal Revenue Code, regulations, rulings, court proceedings and audits; the amount and timing of cost recovery allowed as a result of regulatory proceedings, related appeals or new legislation; the cost of protecting assets against, or damage due to, terrorism; changes in and application of accounting standards and financial reporting regulations; changes in federal or state laws and their interpretation with respect to regulation, energy policy and other business issues; and binding arbitration, litigation and related appeals. New factors emerge from time to time. We cannot predict what factors may arise or how such factors may cause our results to differ materially from those contained in any forward-looking statement. Any forward-looking statements refer only as of the date on which such statements are made. We undertake no obligation to update any forward-looking statement to reflect events or circumstances after the date on which such statement is made or to reflect the occurrence of unanticipated events. This presentation should also be read in conjunction with the "Forward-Looking Statements" section in each of DTE Energy's and Detroit Edison's 2008 Forms 10-K and 2009 Forms 10-Q (which sections are incorporated herein by reference), and in conjunction with other SEC reports filed by DTE Energy and Detroit Edison. Cautionary Note - The Securities and Exchange Commission permits oil and gas companies, in their filings with the SEC, to disclose only proved reserves that a company has demonstrated by actual production or conclusive formation tests to be economically and legally producible under existing economic and operating conditions. We use certain terms in this presentation such as "probable reserves" that the SEC's guidelines strictly prohibit us from including in filings with the SEC. You are urged to consider closely the disclosure in DTE's 2008 Form 10-K, File No. 1-11607, available from our offices or from our website at www.dteenergy.com. You can also obtain this Form from the SEC by calling 1-800-SEC-0330. |

| 3 Participants Dave Meador, Executive Vice President and CFO Peter Oleksiak, Vice President and Controller Nick Khouri, Vice President and Treasurer Lisa Muschong, Director of Investor Relations |

| 4 Overview 3rd Quarter 2009 Earnings Results Cash Flow and Capital Expenditures Summary |

| Solid utility results Utilities have continued to perform well in a difficult environment Continuous improvement initiatives remain on track Non-utility performance remains on track Energy Trading headed for a strong year Positive signs in the steel industry for Power & Industrial Holding company one-time tax benefits helping to shore up a positive year Balance sheet remains strong Significant improvement in cash flow compared with last year Balance sheet metrics within targeted range Over $1.7 billion of available liquidity as of 9/30/2009 Q3 2009 Overview 5 |

| 2009 Operating Earnings* Guidance 6 ($ millions, except EPS) 2009 Guidance YTD 2009 Revised guidance upwards at our October 19th Analyst Meeting YTD results are tracking in-line with full-year 2009 guidance Strong focus will remain on continuous improvement to ensure we deliver a solid year in a difficult environment * Reconciliation to GAAP reported earnings included in the appendix (millions) |

| 7 Overview 3rd Quarter 2009 Earnings Results Cash Flow and Capital Expenditures Summary |
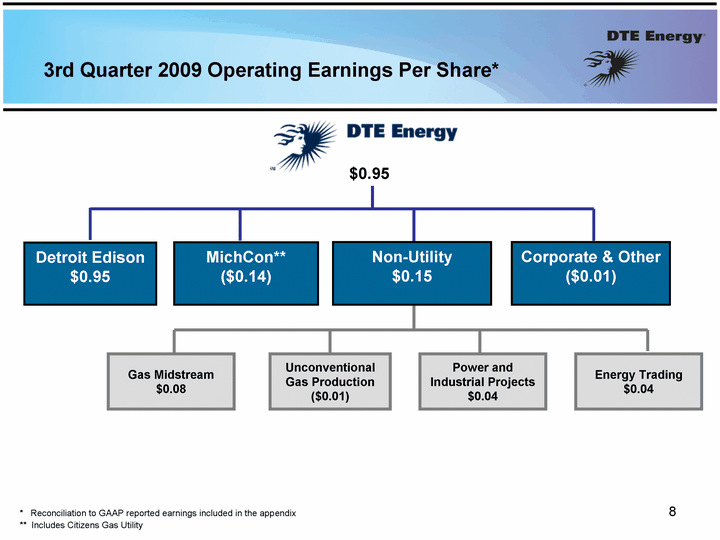
| 8 3rd Quarter 2009 Operating Earnings Per Share* Detroit Edison $0.95 Unconventional Gas Production ($0.01) Non-Utility $0.15 Gas Midstream $0.08 Corporate & Other ($0.01) MichCon** ($0.14) $0.95 Power and Industrial Projects $0.04 * Reconciliation to GAAP reported earnings included in the appendix ** Includes Citizens Gas Utility Energy Trading $0.04 |

| Increased pipeline revenues at Gas Midstream Lower commodity prices for Unconventional Gas Power & Industrial driven by decreased coke production in 2009 and an intercompany interest true-up with Corporate & Other in 2008 Lower realized gains at Energy Trading Corporate & Other driven by one-time tax- related benefit in 2009 and intercompany interest true-up with Power & Industrial in 2008 9 3rd Quarter 2009 Operating Earnings Variance Weaker economy, cooler weather and higher benefit expense; partially offset by rate increases and cost reductions Drivers * Reconciliation to GAAP reported earnings included in the appendix Detroit Edison MichCon Increased benefits expense in Q3 2009 and a tax refund in 2008 Operating Earnings* ($ millions, except EPS) 3Q 2008 3Q 2009 Change Non-Utility (millions) |
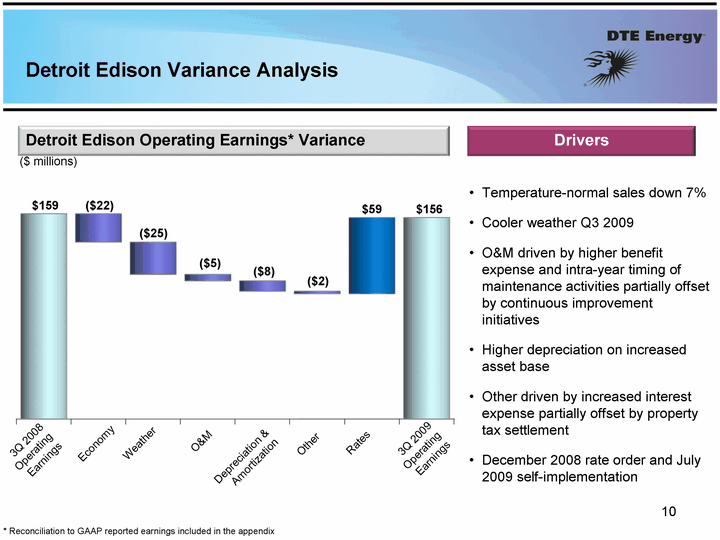
| 10 Detroit Edison Variance Analysis * Reconciliation to GAAP reported earnings included in the appendix 3Q 2008 Operating Earnings ($25) ($22) $159 3Q 2009 Operating Earnings Economy ($2) ($ millions) Detroit Edison Operating Earnings* Variance Drivers $156 Temperature-normal sales down 7% Cooler weather Q3 2009 O&M driven by higher benefit expense and intra-year timing of maintenance activities partially offset by continuous improvement initiatives Higher depreciation on increased asset base Other driven by increased interest expense partially offset by property tax settlement December 2008 rate order and July 2009 self-implementation ($5) O&M Rates $59 Weather Other ($8) Depreciation & Amortization |
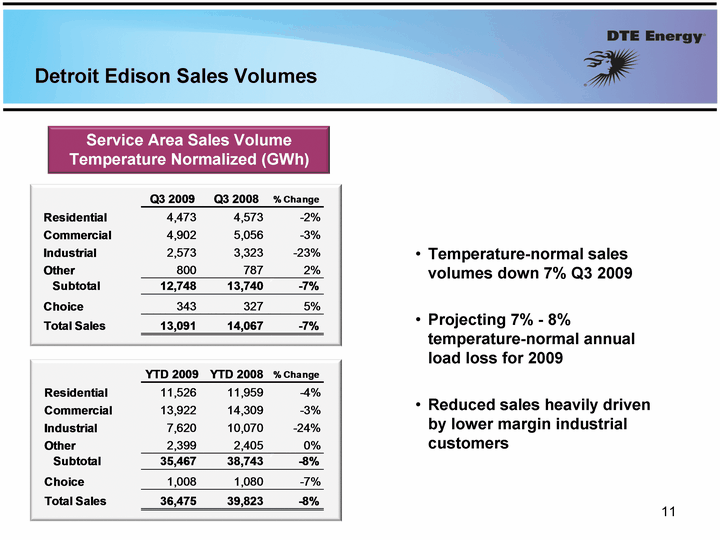
| Detroit Edison Sales Volumes 11 Temperature-normal sales volumes down 7% Q3 2009 Projecting 7% - 8% temperature-normal annual load loss for 2009 Reduced sales heavily driven by lower margin industrial customers Service Area Sales Volume Temperature Normalized (GWh) |

| 12 MichCon Variance Analysis Seasonal third quarter loss is typical Higher benefit expense partially offset by continuous improvement initiatives Other driven by higher depreciation and interest in 2009 and a tax refund in Q3 2008 ($ millions) MichCon Operating Earnings* Variance Drivers ($13) ($5) * Reconciliation to GAAP reported earnings included in the appendix ($23) ($5) O&M 3Q 2009 Operating Earnings 3Q 2008 Operating Earnings Other |
| 13 Overview 3rd Quarter 2009 Earnings Results Cash Flow and Capital Expenditures Summary |

| 14 YTD September 2009 Cash Flow * Reconciliation to GAAP reported cash flow included in the appendix DTE Energy Cash Flow ($ billions) Drivers Free cash flow YTD is $900 million compared with ($400) million last year Positive cash at nearly every business line Expect flat 4th quarter cash from operations due to pension contribution, federal tax payments, and normal MichCon seasonality Expect year-end balance sheet metrics to be within targeted ranges Over $1.7 billion of available liquidity as of 9/30/2009 |

| 15 YTD September 2009 Capital Expenditures DTE Energy Capital Expenditures ($ millions) Drivers Total capital YTD is $231 million below prior year, ~20% lower Detroit Edison approximately flat YTD MichCon decrease driven by lower routine capital and completion of storage expansion project in 2008 Non-utility spending reflects lower Unconventional Gas drilling and timing of Power and Industrial projects |

| 16 Overview 3rd Quarter 2009 Earnings Results Cash Flow and Capital Expenditures Summary |

| 5%-6% Average Annual EPS Growth Attractive Dividend Investment Thesis 17 Strong regulated growth plan Regulatory framework now very constructive Dedicated funding and earnings mechanisms for renewables and energy optimization Non-utility businesses provide diversification of geography and earnings Track record of strong performance in challenging environment Strong balance sheet supports growth Our dividend, at $2.12 per share, is well supported and provides an attractive yield at current prices |

| 18 Contact Us DTE Energy Investor Relations www.dteenergy.com/investors 313-235-8030 |
| Appendix |
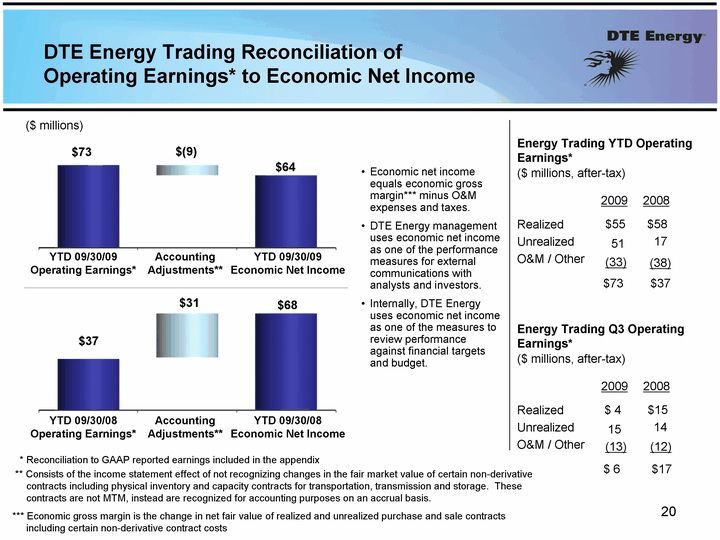
| DTE Energy Trading Reconciliation of Operating Earnings* to Economic Net Income ** Consists of the income statement effect of not recognizing changes in the fair market value of certain non-derivative contracts including physical inventory and capacity contracts for transportation, transmission and storage. These contracts are not MTM, instead are recognized for accounting purposes on an accrual basis. ($ millions) YTD 09/30/09 Economic Net Income Accounting Adjustments** YTD 09/30/09 Operating Earnings* $73 $(9) $64 Economic net income equals economic gross margin*** minus O&M expenses and taxes. DTE Energy management uses economic net income as one of the performance measures for external communications with analysts and investors. Internally, DTE Energy uses economic net income as one of the measures to review performance against financial targets and budget. * Reconciliation to GAAP reported earnings included in the appendix *** Economic gross margin is the change in net fair value of realized and unrealized purchase and sale contracts including certain non-derivative contract costs 20 Energy Trading Q3 Operating Earnings* Realized Unrealized O&M / Other 2008 2009 $15 $ 4 15 14 (12) (13) ($ millions, after-tax) $17 $ 6 Energy Trading YTD Operating Earnings* Realized Unrealized O&M / Other 2008 2009 $58 $55 51 17 (38) (33) ($ millions, after-tax) $37 $73 $37 $31 $68 YTD 09/30/08 Operating Earnings* YTD 09/30/08 Economic Net Income Accounting Adjustments** |

| Net Production Rate (Mmcfe/day) Gross Producing Wells 168 Reserves (Bcfe) Acreage Position (000's Acres) Net Undeveloped Acres Net Developed Acres Barnett Shale Operating Metrics 15 9/30/09 47 62 14 46 YE2008 60 9/30/09 YE2008 156 15 9/30/09 YE2008 16 21 YE2008 YE2007 Probable Proven 192 144 336 265 167 432 Continue to prudently manage and develop Barnett assets Invest $20 - $25M Drill 10 - 15 wells Produce 5 Bcfe net Focus on cost reduction & production optimization Drilled 6 new wells Net Production of 4 Bcfe Capital Expenditures $16 million Production down slightly due to deferred well completions 2009 YTD Results 2009 Goals |

| 22 2009 Capital Expenditures & Cash Flow Guidance Capital Expenditures Summary ($ millions) * Reconciliation to GAAP reported cash flow included in the appendix Cash Flow Summary ($ billions) Plan to issue $60 - $80 million of equity in 2009 to fund Dividend Reinvestment and employee benefit programs |

| 23 Reconciliation of 3Q 2009 Reported to Operating Earnings Use of Operating Earnings Information - DTE Energy management believes that operating earnings provide a more meaningful representation of the company's earnings from ongoing operations and uses operating earnings as the primary performance measurement for external communications with analysts and investors. Internally, DTE Energy uses operating earnings to measure performance against budget and to report to the Board of Directors. |
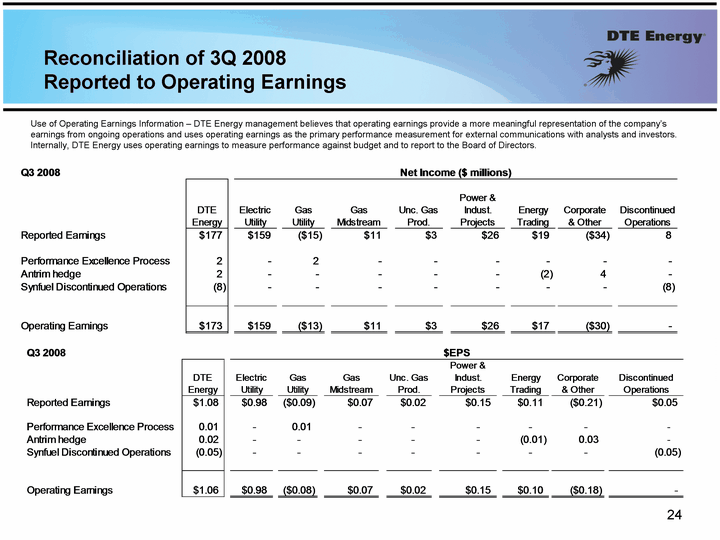
| Reconciliation of 3Q 2008 Reported to Operating Earnings Use of Operating Earnings Information - DTE Energy management believes that operating earnings provide a more meaningful representation of the company's earnings from ongoing operations and uses operating earnings as the primary performance measurement for external communications with analysts and investors. Internally, DTE Energy uses operating earnings to measure performance against budget and to report to the Board of Directors. 24 |

| 25 Reconciliation of YTD September 2009 Reported to Operating Earnings Use of Operating Earnings Information - DTE Energy management believes that operating earnings provide a more meaningful representation of the company's earnings from ongoing operations and uses operating earnings as the primary performance measurement for external communications with analysts and investors. Internally, DTE Energy uses operating earnings to measure performance against budget and to report to the Board of Directors. |

| 26 Reconciliation of YTD September 2008 Reported to Operating Earnings Use of Operating Earnings Information - DTE Energy management believes that operating earnings provide a more meaningful representation of the company's earnings from ongoing operations and uses operating earnings as the primary performance measurement for external communications with analysts and investors. Internally, DTE Energy uses operating earnings to measure performance against budget and to report to the Board of Directors. |

| 27 Reconciliation of 2009 Reported to Operating Earnings Use of Operating Earnings Information - DTE Energy management believes that operating earnings provide a more meaningful representation of the company's earnings from ongoing operations and uses operating earnings as the primary performance measurement for external communications with analysts and investors. Internally, DTE Energy uses operating earnings to measure performance against budget and to report to the Board of Directors. In this presentation, DTE Energy provides 2009 guidance for operating earnings. It is likely that certain items that impact the company's 2009 reported results will be excluded from operating results. A reconciliation to the comparable 2009 reported earnings/net income guidance is not provided because it is not possible to provide a reliable forecast of specific line items. These items may fluctuate significantly from period to period and may have a significant impact on reported earnings. |

| 28 Reconciliation of Cash from Operations to Adjusted Cash from Operations * accounted for in the investing activities section of the statement of cash flows Adjusted Cash From Operations Use of Adjusted Cash From Operations - DTE Energy management believes that adjusted cash from operations provide a more meaningful representation of the company's cash from ongoing operations and uses adjusted cash from operations as a primary performance measurement for external communications with analysts and investors. Internally, DTE Energy uses adjusted cash from operations to measure performance against budget and to report to the Board of Directors. |