Attached files
| file | filename |
|---|---|
| 8-K - FORM 8-K - infoGROUP Inc. | d69807e8vk.htm |
Exhibit 99.1
| Welcome to infoGROUP’sShareholder Day October 29, 2009 |
| Corporate Overview infoGROUPis the leading provider of data driven and interactive resources that enables targeted sales, effective marketing and insightful research solutions. |
| ·Large, proprietary databases •Large, diverse client base •Broad product portfolio/digital presence ·Market research capabilities •Attractive margins and cash flow •Positioned to take advantage of potential growth opportunities infoGROUPpossesses a tremendous set of assets and creates enormous value in the information and marketing services industry sector |
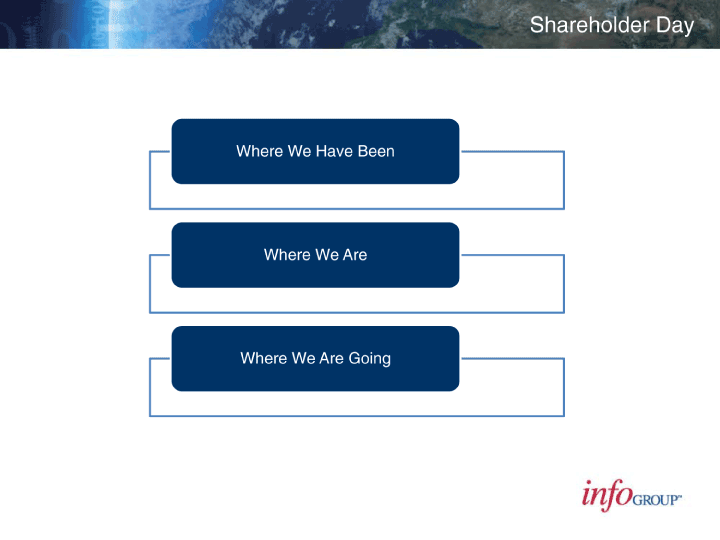
| Shareholder Day Where We Have Been Where We AreWhere We Are Going |
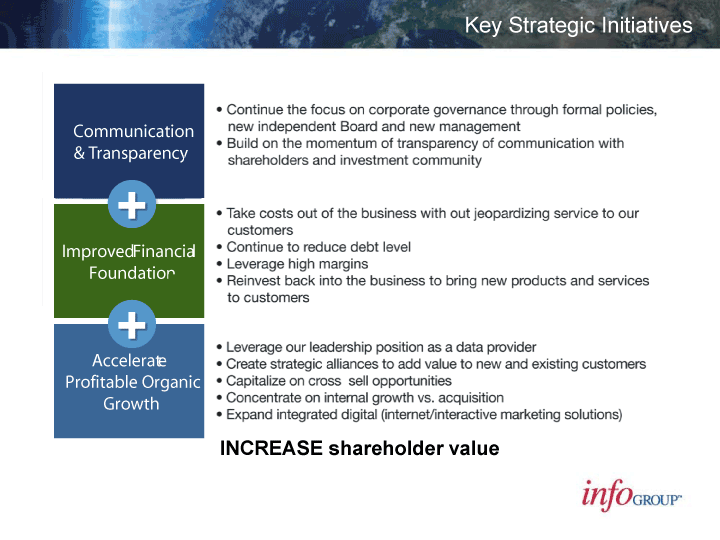
| Key Strategic Initiatives INCREASE shareholder valueAccelerateProfitable OrganicGrowthImproved FinancialFoundationCommunication& Transparency + + |
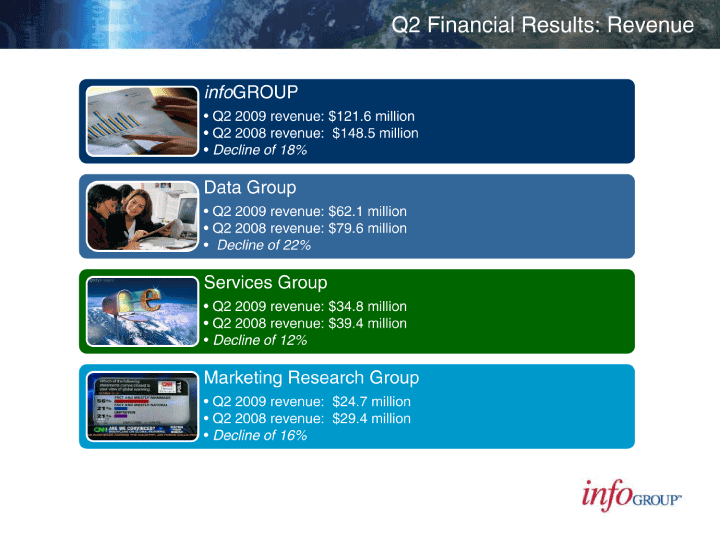
| Q2 Financial Results: RevenueinfoGROUP •Q2 2009 revenue: $121.6 million •Q2 2008 revenue: $148.5 million •Decline of 18% Data Group •Q2 2009 revenue: $62.1 million •Q2 2008 revenue: $79.6 million ·Decline of 22% Services Group •Q2 2009 revenue: $34.8 million •Q2 2008 revenue: $39.4 million ·Decline of 12% Marketing Research Group •Q2 2009 revenue: $24.7 million •Q2 2008 revenue: $29.4 million •Decline of 16% |
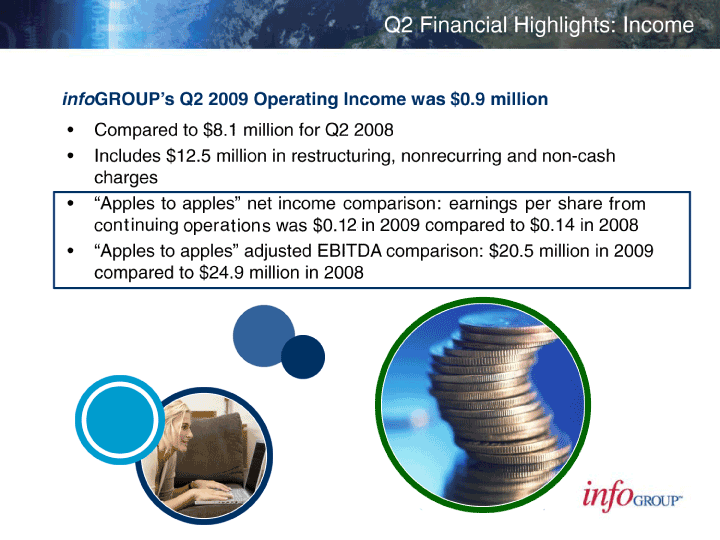
| Q2 Financial Highlights: Income infoGROUP’sQ2 2009 Operating Income was $0.9 million •Compared to $8.1 million for Q2 2008 •Includes $12.5 million in restructuring, nonrecurring and non-cash charges •“Apples to apples” net income comparison: earnings per share was $0.14 in 2009 compared to $0.17 in 2008 •“Apples to apples” adjusted EBITDA comparison: $20.5 million in 2009 compared to $24.9 million in 2008 |
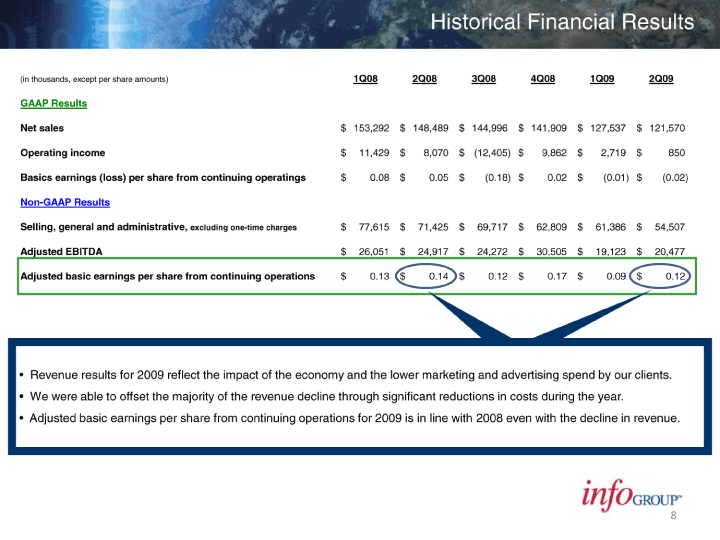
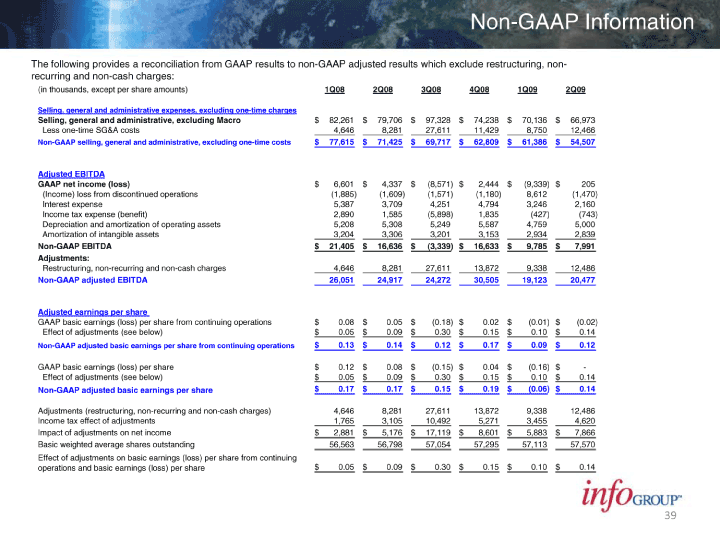
| Historical Financial Results •Revenue results for 2009 reflect the impact of the economy and the lower marketing and advertising spend by our clients. •We were able to offset the majority of the revenue decline through significant reductions in costs during the year. •Adjusted basic earnings per share from continuing operations for 2009 is in line with 2008 even with the decline in revenue. (in thousands, except per share amounts)1Q082Q083Q084Q081Q092Q09GAAP ResultsNet sales153,292$ 148,489$ 144,996$ 141,909$ 127,537$ 121,570$ Operating income11,429$ 8,070$ (12,405)$ 9,862$ 2,719$ 850$ Basics earnings (loss) per share from continuing operatings0.08$ 0.05$ (0.18)$ 0.02$ (0.01)$ (0.02)$ Non-GAAP ResultsSelling, general and administrative, excluding one-time charges77,615$ 71,425$ 69,717$ 62,809$ 61,386$ 54,507$ Adjusted EBITDA26,051$ 24,917$ 24,272$ 30,505$ 19,123$ 20,477$ Adjusted basic earnings per share from continuing operations0.13$ 0.14$ 0.12$ 0.17$ 0.09$ 0.12$ |
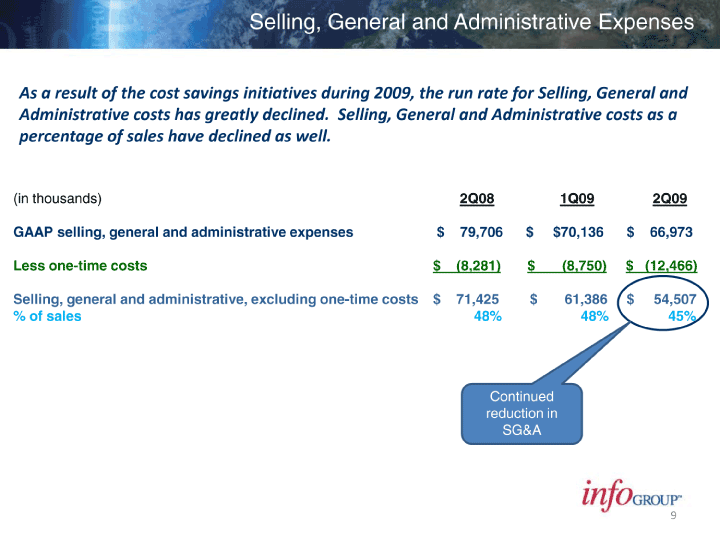
| Selling, General and Administrative Expenses As a result of the cost savings initiatives during 2009, the run rate for Selling, General and Administrative costs has greatly declined. Selling, General and Administrative costs as a percentage of sales have declined as well. (in thousands) GAAP selling, general and administrative expenses Less one-time costs Selling, general and administrative, excluding one-time costs % of sales 2Q081Q092Q09 $ 79,706 $ $70,136 $ 66,973 $ (8,281)$ (8,750)$ (12,466) $ 71,425 $ 61,386 $ 54,507 48%48%45% Continued reduction in SG&A |
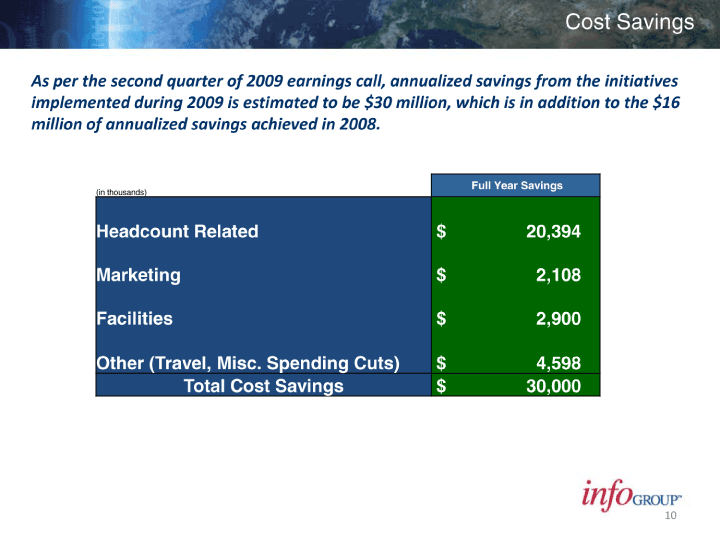
| Cost Savings As per the second quarter of 2009 earnings call, annualized savings from the initiatives implemented during 2009 is estimated to be $30 million, which is in addition to the $16 million of annualized savings achieved in 2008. (in thousands) Full Year Savings Headcount Related $ 20,394 Marketing $ 2,108 Facilities $ 2,900 Other (Travel, Misc. Spending Cuts) $ 4,598 Total Cost Savings $ 30,000 |
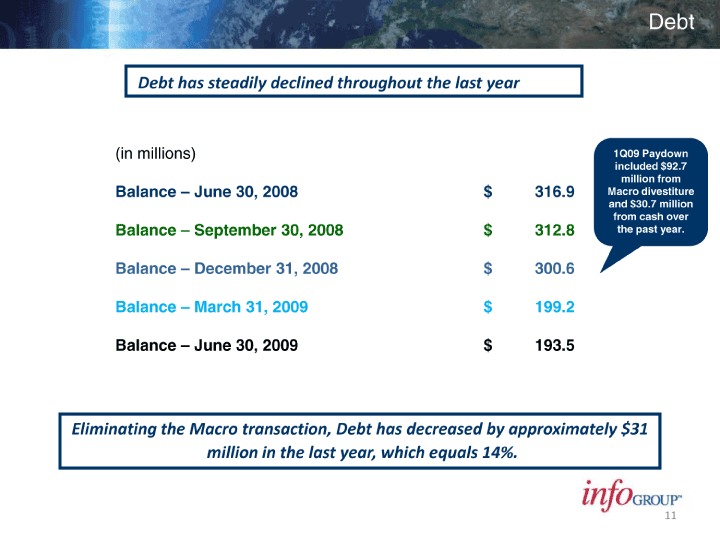
| Debt Debt has steadily declined throughout the last yearEliminating the Macro transaction, Debt has decreased by approximately $31 million in the last year, which equals 14%. 1Q09 Paydownincluded $92.7 million from Macro divestiture and $30.7 million from cash over the past year. (in millions) Balance -June 30, 2008 Balance -September 30, 2008 Balance -December 31, 2008 Balance -March 31, 2009 Balance -June 30, 2009$316.9$312.8$300.6$199.2$193.5 |
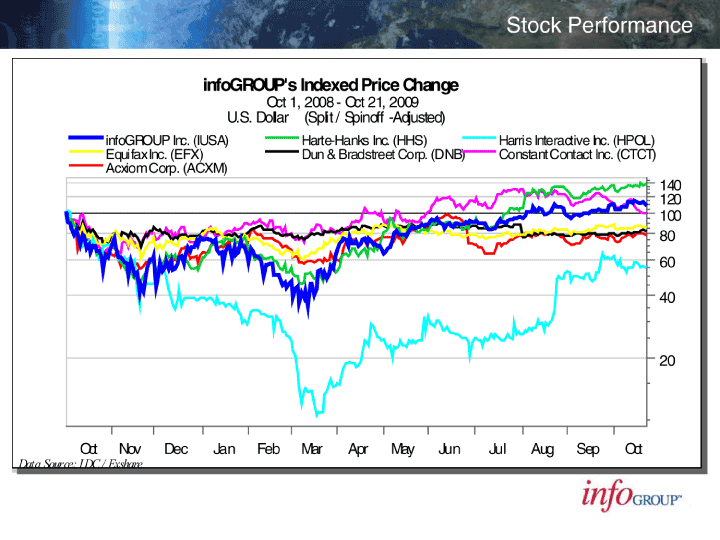
| OctNovDecJanFebMarAprMayJunJulAugSepOct20406080100120140infoGROUP Inc. (IUSA)Harte-Hanks Inc. (HHS)Harris Interactive Inc. (HPOL)Equifax Inc. (EFX)Dun & Bradstreet Corp. (DNB)Constant Contact Inc. (CTCT)Acxiom Corp. (ACXM)infoGROUP’s Indexed Price Change Oct 1, 2008 — Oct 21, 2009U.S. Dollar (Split / Spinoff -Adjusted)Data Source: IDC / ExshareStock Performance |
| Shareholder Day Where We Have Been Where We Are Where We Are Going |
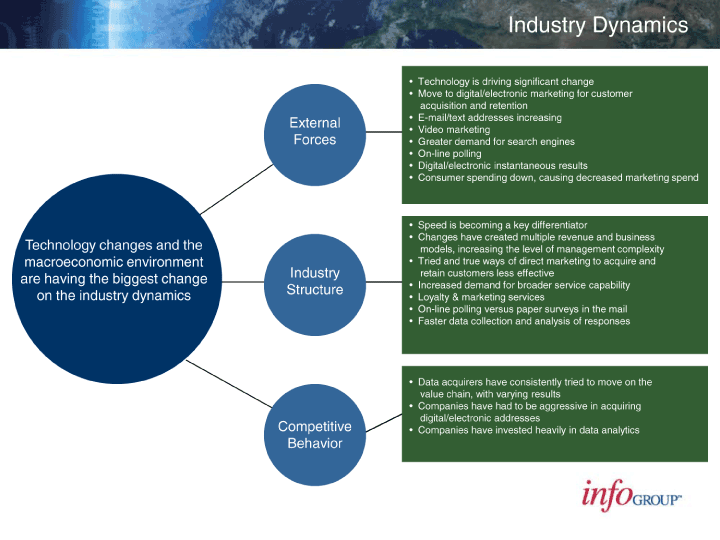
| Shareholder Day Where We Have Been Where We Are Where We Are Going |
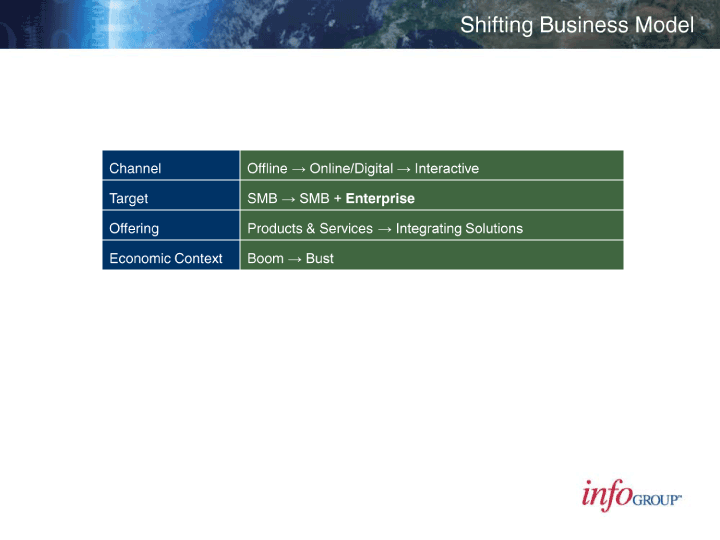
| Shifting Business Model ChannelTarget OfferingEconomic Context Offline ? Online/Digital ? Interactive SMB ? SMB + Enterprise Products & Services ? Integrating Solutions Boom ? Bust |
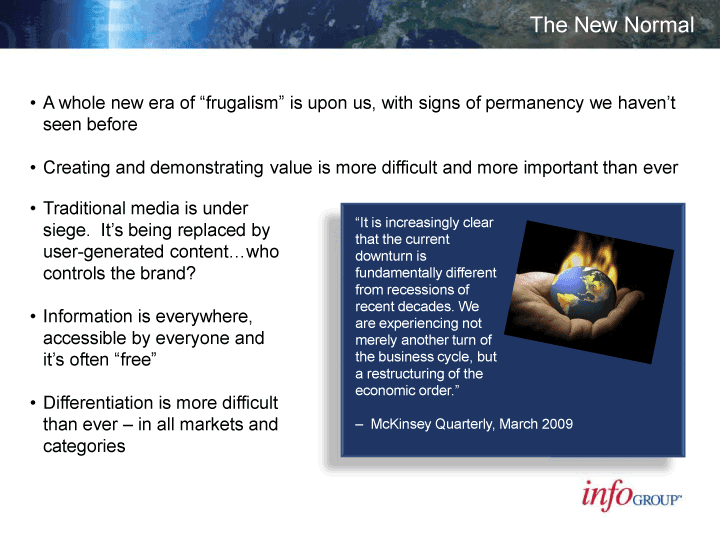
| ·A whole new era of “frugalism” is upon us, with signs of permanency we haven’t seen before ·Creating and demonstrating value is more difficult and more important than ever “It is increasingly clear that the current downturn is fundamentally different from recessions of recent decades. We are experiencing not merely another turn of the business cycle, but a restructuring of the economic order.” The New Normal -McKinsey Quarterly, March 2009 •Traditional media is under siege. It’s being replaced by user-generated content...who controls the brand? •Information is everywhere, accessible by everyone and it’s often “free” •Differentiation is more difficult than ever -in all markets and categories |
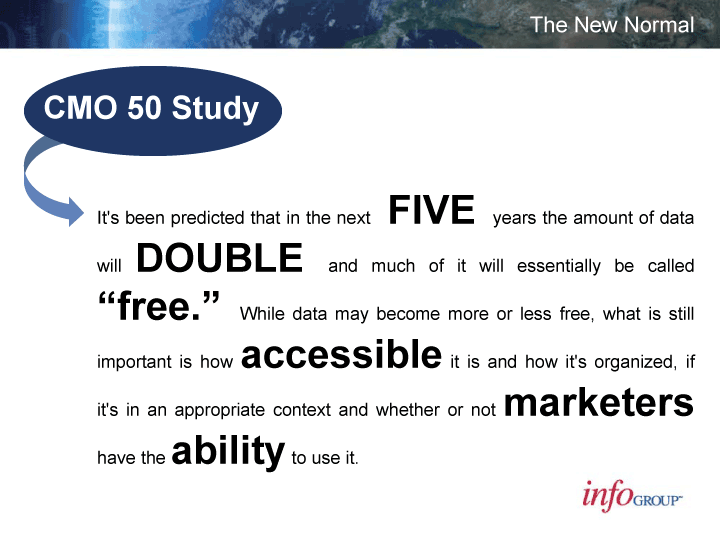
| The New NormalIt’sbeenpredictedthatinthenextFIVEyearstheamountofdatawillDOUBLEandmuchofitwillessentiallybeca lled“free.“Whiledatamaybecomemoreorlessfree,whatisstillimportantishowaccessibleitisandhowit’sorganiz ed,ifit’sinanappropriatecontextandwhetherornotmarketershavetheabilitytouseit. CMO 50 Study |
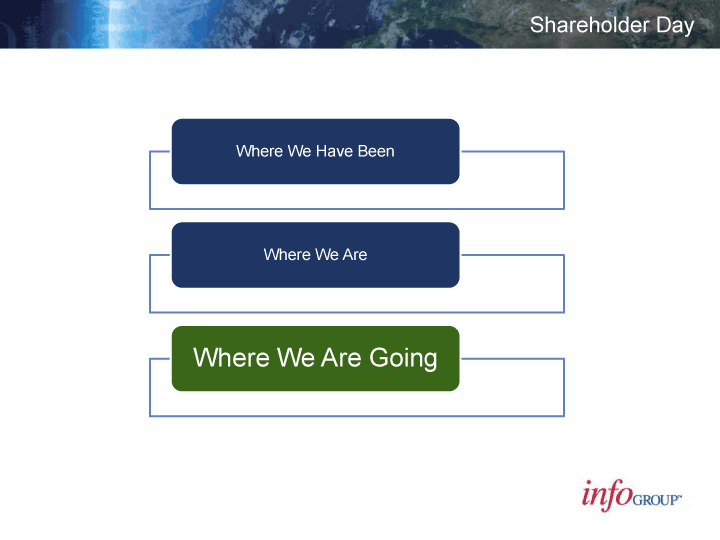
| Shareholder Day Where We Have Been Where We AreWhere We Are Going |
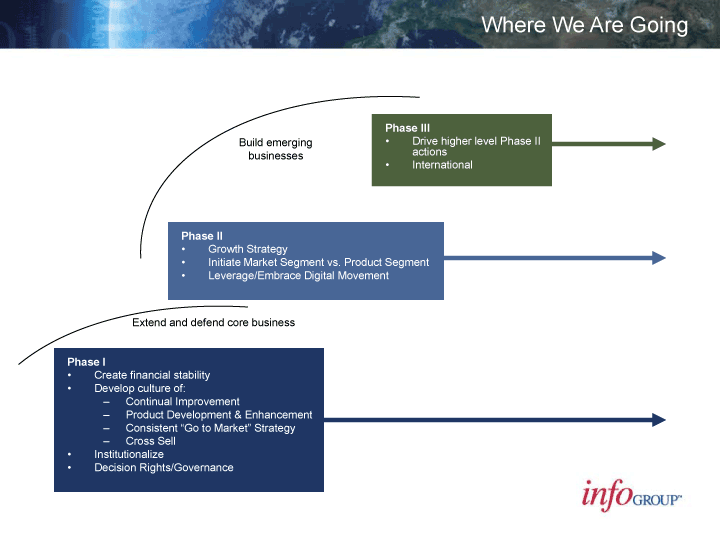
| Where We Are Going Phase I •Create financial stability •Develop culture of:-Continual Improvement -Product Development & Enhancement -Consistent “Go to Market” Strategy -Cross Sell ·Institutionalize •Decision Rights/Governance Phase II •Growth Strategy •Initiate Market Segment vs. Product Segment •Leverage/Embrace Digital Movement Phase III •Drive higher level Phase II actions •International Extend and defend core business Build emerging businesses |
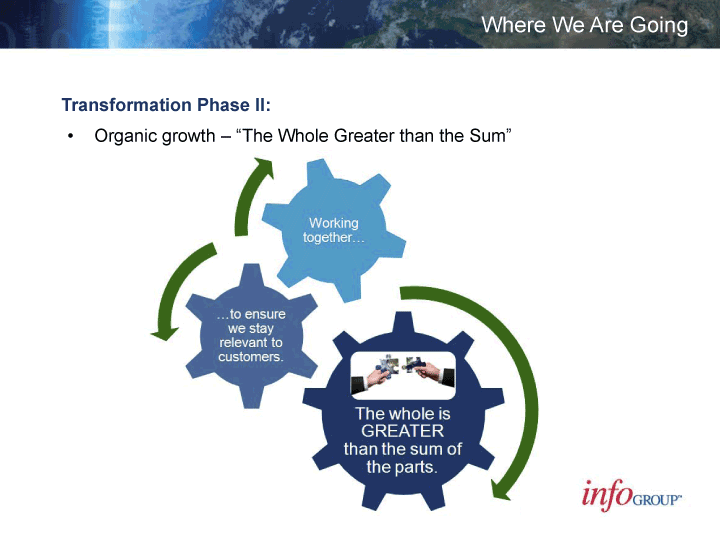
| Transformation Phase II: •Organic growth -“The Whole Greater than the Sum” Where We Are Going |
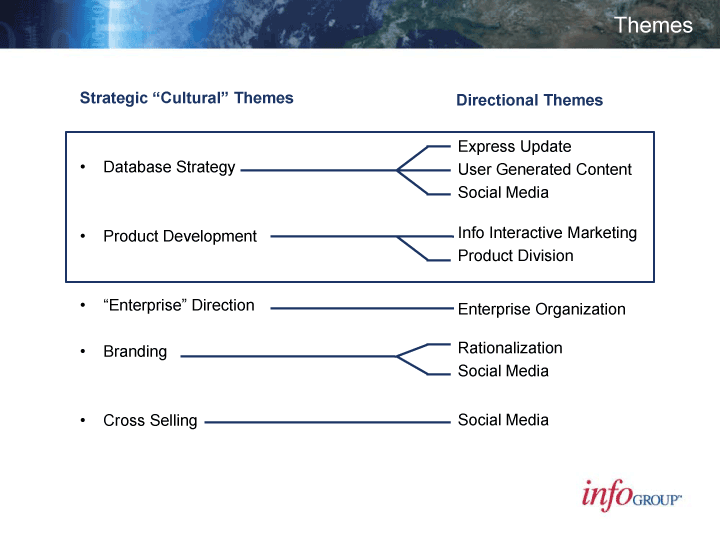
| ThemesStrategic “Cultural” Themes •Database Strategy •Product Development •“Enterprise” Direction ·Branding •Cross Selling Directional ThemesExpress UpdateUser Generated ContentSocial MediaInfo Interactive MarketingProduct DivisionEnterprise OrganizationRationalizationSocial MediaSocial Media |
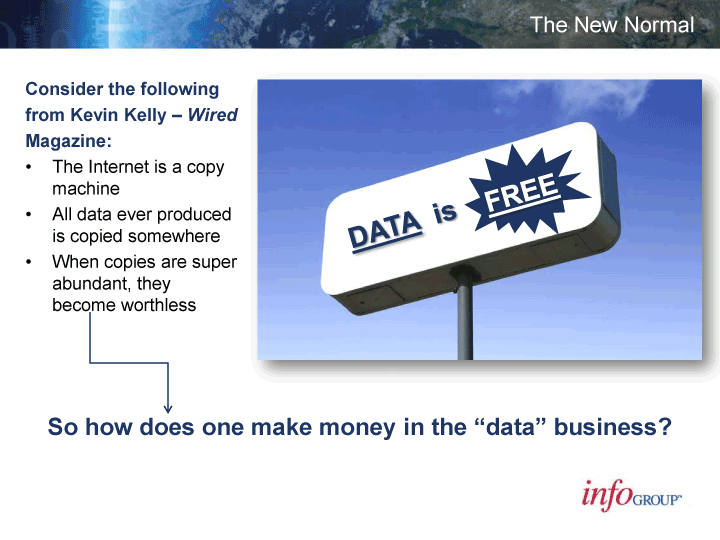
| Consider the followingfrom Kevin Kelly -WiredMagazine: •The Internet is a copy machine •All data ever produced is copied somewhere •Whencopies are super aabundant, they become worthless The New Normal So how does one make money in the “data” business? |
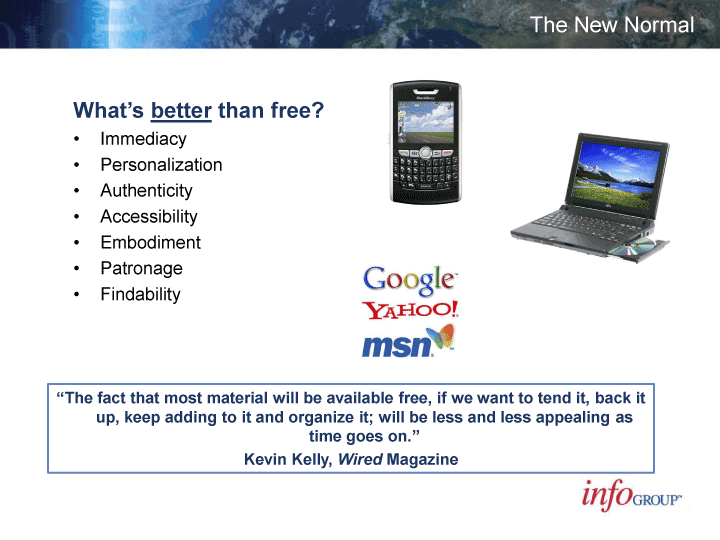
| What’s betterthanfree? •Immediacy •Personalization •Authenticity •Accessibility •Embodiment ·Patronage •Findability The New Normal“The fact that most material will be available free, if we want to tend it, back it up, keep adding to it and organize it; will be less and less appealing as time goes on.“Kevin Kelly, WiredMagazine |
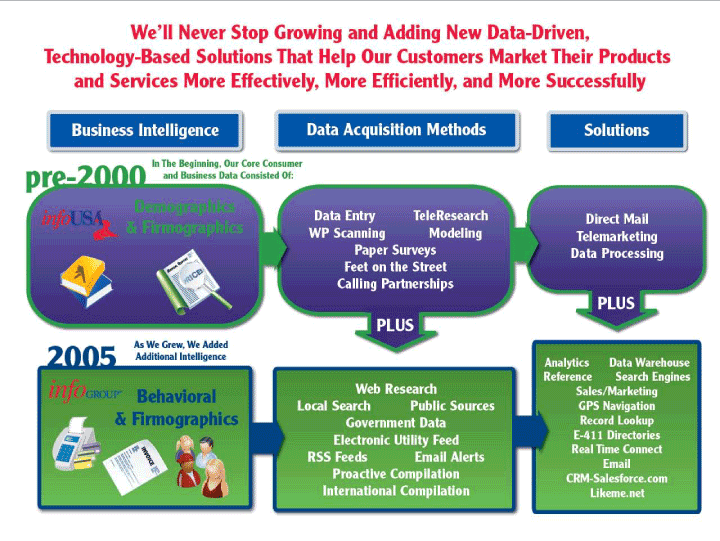
| We’ll Never Stop Growing and Adding New Data-Driven, Technology-Based Solutions That Help Our Customers Market Their Products and Services More Effectively, More Efficiently, and More Successfully ^___-^ -^ -^ In The Beginning, Our Core Consumer % KAH JI II II I and Business Data Consisted Of: ^^v^v — As We Grew, We Added ^^ fl ^ /llll^ Additional Intelligence ^Ht^^9 ^^H^WIIi^i I infoaxxjr Behavioral ^^^^^^^B I j^^^BHj I & Firmographics ^1 HBIB^^BjSMlB mL wSJSiS |
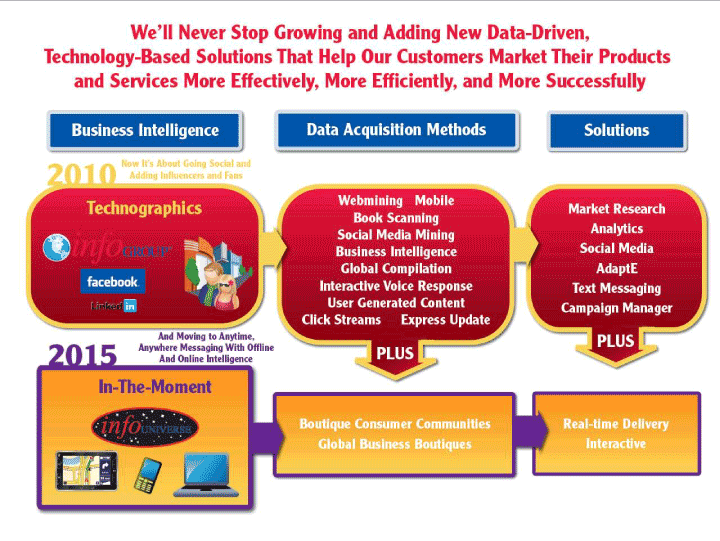
| We’ll Never Stop Growing and Adding New Data-Driven, Technology-Based Solutions That Help Our Customers Market Their Products and Services More Effectively, More Efficiently, and More Successfully ^—ftjg ¦MMiiw, lamp And Moving to Anytime, ^^l^^^^^^^H HH^^^^^^H^^^ ^^MlI ^|/\^ ^ Anywhere Messaging With Offline ^^^^P ^.^¦¦M^’^ ^L\f m And Online Intelligence ^^^^^£J ^^\^^^^ In-The-Moment I ^^^^^^^_^^^^^^^_^ ^^^^^_^^^^^_^ g V a ft * 1 |
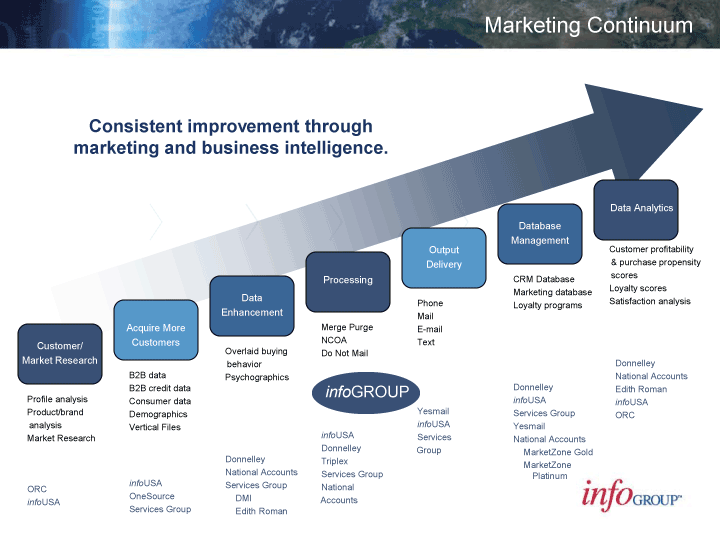
| B2B dataB2B credit dataConsumer dataDemographicsVertical FilesOverlaid buying behavior Psychographics Profile analysis Product/brand analysis Market ResearchMerge PurgeNCOADo Not MailPhoneMailE-mailTextCRM DatabaseMarketing databaseLoyalty programsCustomer profitability & purchase propensityscoresLoyalty scoresSatisfaction analysisORCinfoUSAinfoUSAOneSourceServices GroupDonnelleyNational AccountsServices GroupDMIEdith RomanYesmailinfoUSAServices Group infoUSA Donnelley Triplex Services Group National Accounts Donnelley infoUSA Services Group Yesmail National Accounts MarketZone Gold MarketZone Platinum Donnelley National Accounts Edith Roman infoUSA ORCCustomer/Market Research Acquire More CustomersDataEnhancementProcessingOutputDeliveryDatabaseManagement Data AnalyticsinfoGROUP Marketing ContinuumConsistent improvement through marketing and business intelligence. |
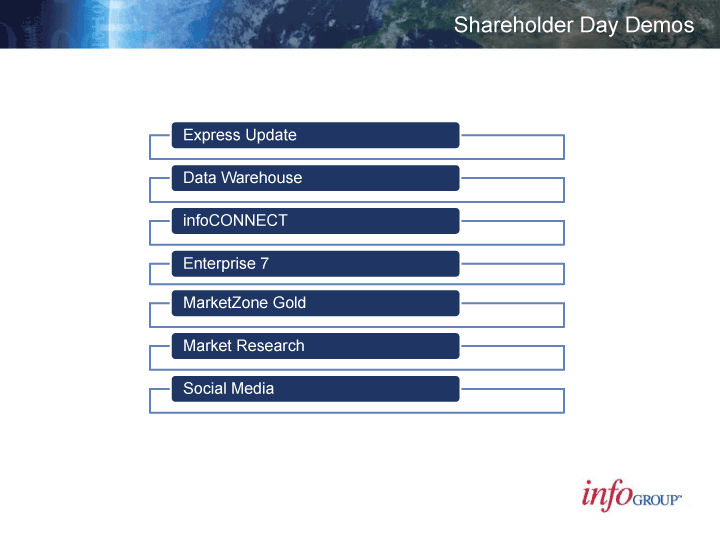
| Shareholder Day DemosExpress UpdateData WarehouseinfoCONNECTEnterprise 7MarketZoneGoldMarket ResearchSocial Media |
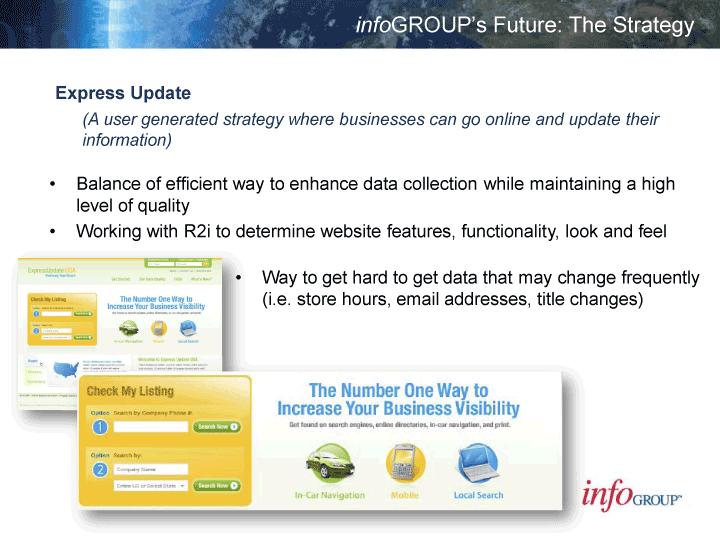
| infoGROUP’sFuture: The Strategy Express Update (A user generated strategy where businesses can go online and update their information) •Balance of efficient way to enhance data collection while maintaining a high level of quality •Working with R2i to determine website features, functionality, look and feel •Way to get hard to get data thatmay change frequently (i.e. store hours, email addresses, title changes) |
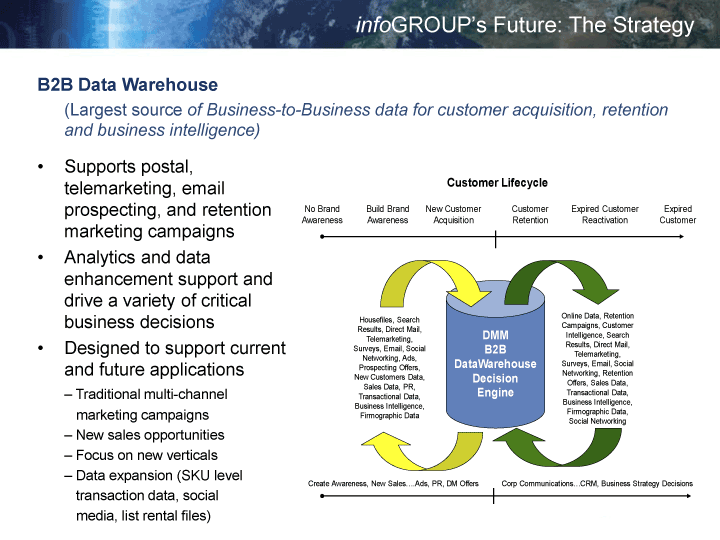
| infoGROUP’sFuture: The Strategy Express Update (A user generated strategy where businesses can go online and update their information) •Balance of efficient way to enhance data collection while maintaining a high level of quality •Working with R2i to determine website features, functionality, look and feel •Way to get hard to get data thatmay change frequently (i.e. store hours, email addresses, title changes) |
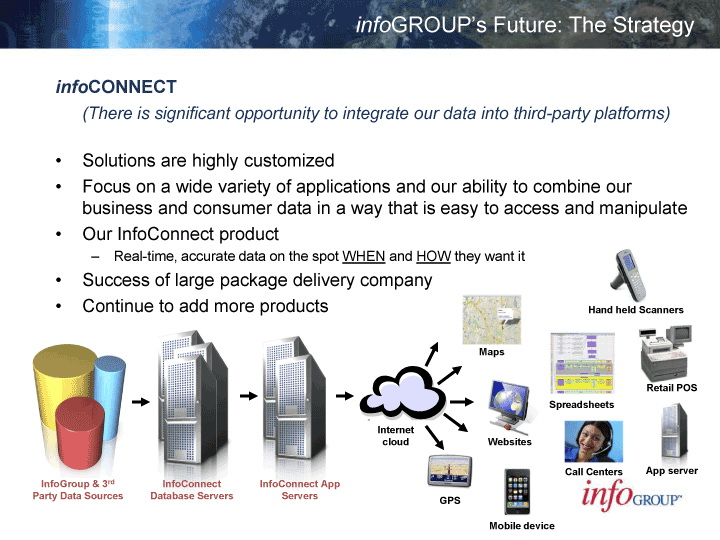
| infoGROUP’sFuture: The Strategy infoCONNECT (There is significant opportunity to integrate our data into third-party platforms) •Solutions are highly customized •Focus on a wide variety of applications and our ability to combine our business and consumer data in a way that is easy to access and manipulate •Our InfoConnectproduct-Real-time, accurate data on the spot WHENand HOWthey want it •Success of large package delivery company •Continue to add more products InfoGroup& 3rdParty Data SourcesInfoConnectDatabase ServersInternet cloud InfoConnectApp ServersMapsSpreadsheetsGPS WebsitesMobile deviceCall CentersHand held ScannersRetail POSApp server |
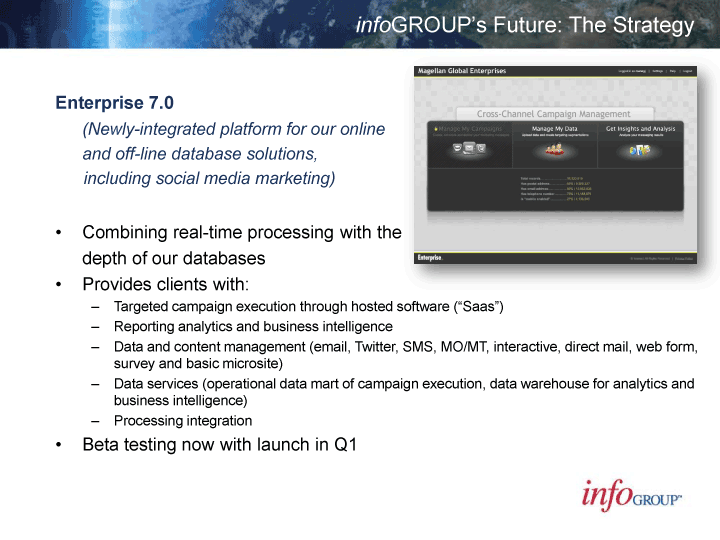
| infoGROUP’sFuture: The Strategy Enterprise 7.0 (Newly-integrated platform for our online and off-line database solutions, including social media marketing) •Combining real-time processing with the depth of our databases •Provides clients with:-Targeted campaign execution through hosted software (“Saas”) -Reporting analytics and business intelligence -Data and content management (email, Twitter, SMS, MO/MT, interactive, direct mail, web form, survey and basic microsite) -Data services (operational data mart of campaign execution, data warehouse for analytics and business intelligence) -Processing integration •Beta testing now with launch in Q1 |
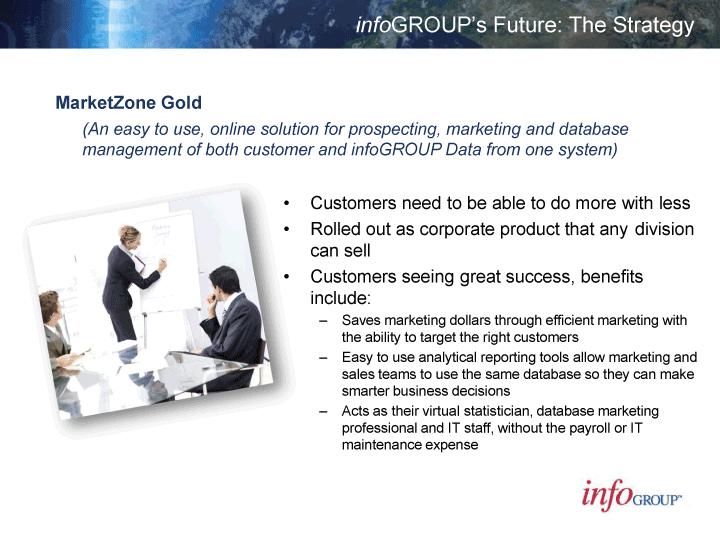
| infoGROUP’sFuture: The Strategy MarketZoneGold (An easy to use, online solution for prospecting, marketing and database management of both customer and infoGROUPData from one system) •Customers need to be able to do more with less •Rolled out as corporate product that any division can sell ·Customers seeing great success, benefits include:-Saves marketingdollars through efficient marketing with the ability to target the right customers -Easy to use analytical reporting toolsallow marketing and sales teams to use the same database so they can make smarter business decisions -Acts as their virtual statistician, database marketing professional and ITstaff, without the payroll or IT maintenance expense |
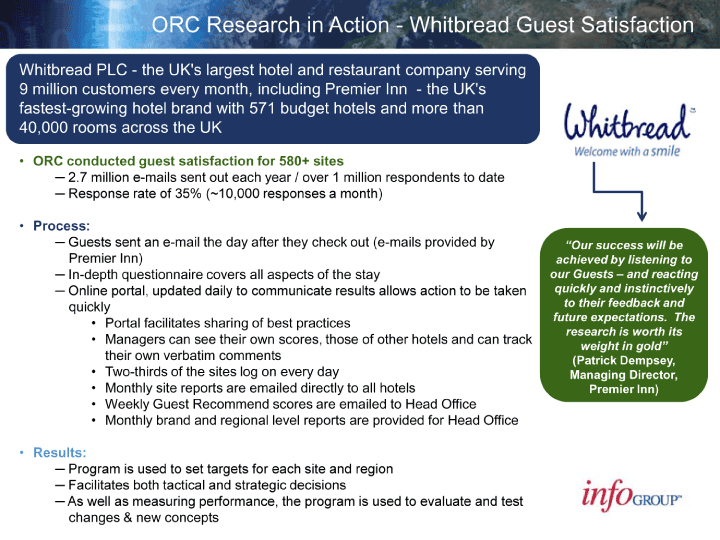
| infoGROUP’sFuture: The Strategy MarketZoneGold (An easy to use, online solution for prospecting, marketing and database management of both customer and infoGROUPData from one system) •Customers need to be able to do more with less •Rolled out as corporate product that any division can sell ·Customers seeing great success, benefits include:-Saves marketingdollars through efficient marketing with the ability to target the right customers -Easy to use analytical reporting toolsallow marketing and sales teams to use the same database so they can make smarter business decisions -Acts as their virtual statistician, database marketing professional and ITstaff, without the payroll or IT maintenance expense |
| infoGROUP’sFuture: The Strategy Social Media (Leveraging this new medium for both us and our customers to benefit from social media + our extensive database is a win-win for all) •To deepen data and add to our core coverage •Data mining opportunities to help our clients find out more about their customers in the social space, providing powerful insight for marketers •R2i strategic alliance provides robust suite of solutions:-Facebookapplication and Twitter and API integration -iPhoneapplication development and design -Social sharing and viral application development ·“Certified Social” social media training for all •Listening and engaging •Corporate presence on Twitter, Facebook, LinkedIn •Groundswell Award Entries |
| infoGROUP’sFuture: Other Other Corporate Initiatives •“Enterprise Sales” •Loyalty Program ·International Development •Strategic Alliance |
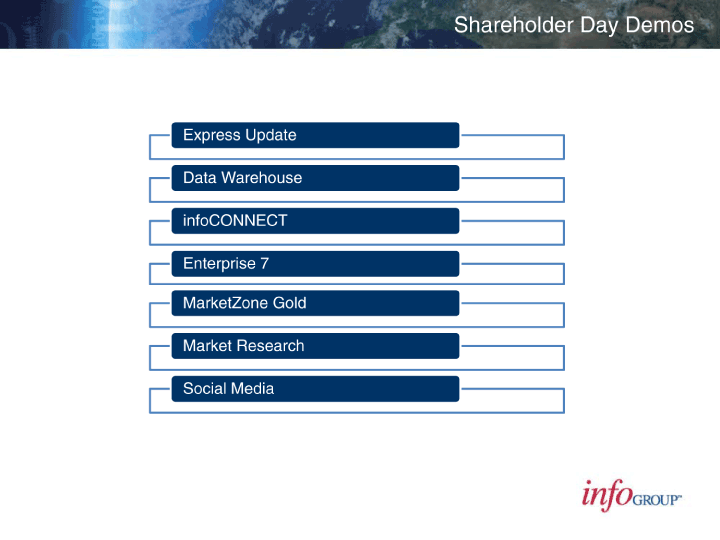
| Shareholder Day DemosExpress Update Data Warehouse infoCONNECT Enterprise 7MarketZoneGold Market Research Social Media |
| Shareholder DayThank You |
| Shareholder DayThank You |
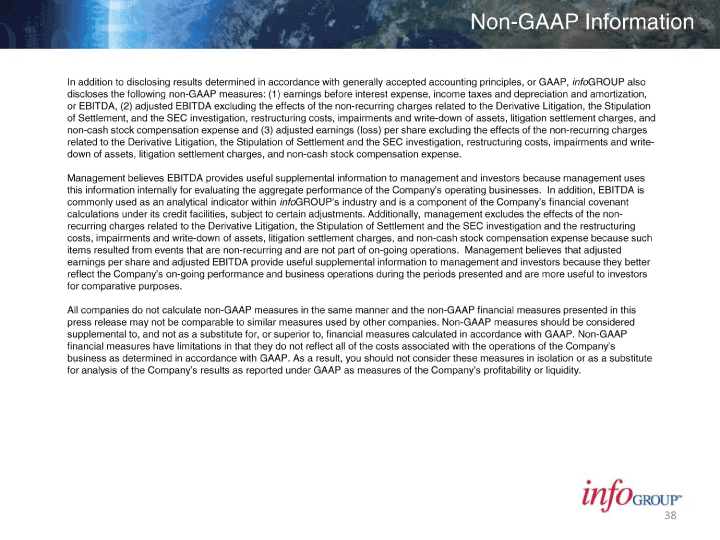
| Non-GAAP Information In addition to disclosing results determined in accordance with generally accepted accounting principles, or GAAP, infoGROUPalso discloses the following non-GAAP measures: (1) earnings before interest expense, income taxes and depreciation and amortization,or EBITDA, (2) adjusted EBITDA excluding the effects of the non-recurring charges related to the Derivative Litigation, the Stipulation of Settlement, and the SEC investigation, restructuring costs, impairments and write-down of assets, litigation settlement charges, and non-cash stock compensation expense and (3) adjusted earnings (loss) per share excluding the effects of the non-recurring charges related to the Derivative Litigation, the Stipulation of Settlement and the SEC investigation, restructuring costs, impairments and write-down of assets, litigation settlement charges, and non-cash stock compensation expense.Management believes EBITDA provides useful supplemental information to management and investors because management uses this information internally for evaluating the aggregate performance of the Company’s operating businesses. In addition, EBITDAis commonly used as an analytical indicator within infoGROUP’sindustry and is a component of the Company’s financial covenant calculations under its credit facilities, subject to certain adjustments. Additionally, management excludes the effects of the non-recurring charges related to the Derivative Litigation, the Stipulation of Settlement and the SEC investigation and the restructuring costs, impairments and write-down of assets, litigation settlement charges, and non-cash stock compensation expense because suchitems resulted from events that are non-recurring and are not part of on-going operations. Management believes that adjusted earnings per share and adjusted EBITDA provide useful supplemental information to management and investors because they better reflect the Company’s on-going performance and business operations during the periods presented and are more useful to investorsfor comparative purposes. All companies do not calculate non-GAAP measures in the same manner and the non-GAAP financial measures presented in this press release may not be comparable to similar measures used by other companies. Non-GAAP measures should be considered supplemental to, and not as a substitute for, or superior to, financial measures calculated in accordance with GAAP. Non-GAAP financial measures have limitations in that they do not reflect all of the costs associated with the operations of the Company’sbusiness as determined in accordance with GAAP. As a result, you should not consider these measures in isolation or as a substitute for analysis of theCompany’s results as reported under GAAP as measures of the Company’s profitability or liquidity. |
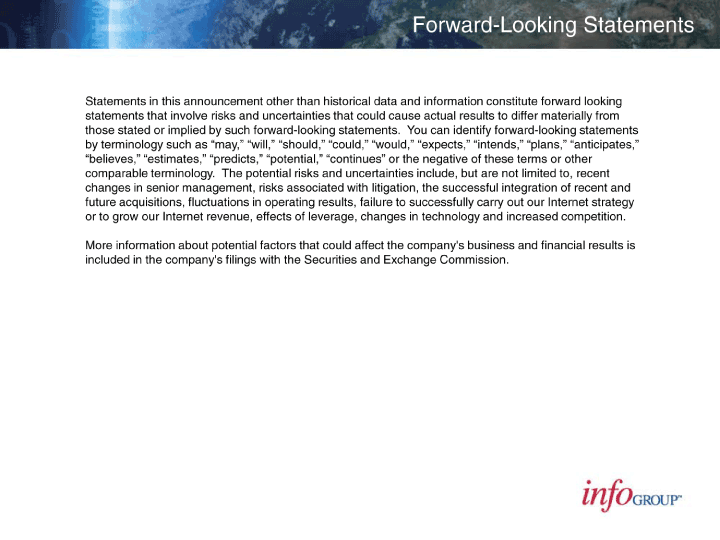
| Forward-Looking StatementsStatements in this announcement other than historical data and information constitute forward looking statements that involve risks and uncertainties that could cause actual results to differ materially from those stated or implied by such forward-looking statements. You can identify forward-looking statements by terminology such as “may,” “will,” “should,” “could,” “would,” “expects,” “intends,” “plans,” “anticipates,” “believes,” “estimates,” “predicts,” “potential,” “continues” or the negative of these terms or other comparable terminology. The potential risks and uncertainties include, but are not limited to, recent changes in senior management, risks associated with litigation, the successful integration of recent and future acquisitions, fluctuations in operating results, failure to successfully carry out our Internet strategy or to grow our Internet revenue, effects of leverage, changes in technology and increased competition. More information about potential factors that could affect the company’s business and financial results is included in the company’s filings with the Securities and Exchange Commission. |
