Attached files
| file | filename |
|---|---|
| 8-K - FORM 8-K - ARIZONA PUBLIC SERVICE CO | c91428e8vk.htm |
| EX-99.2 - EXHIBIT 99.2 - ARIZONA PUBLIC SERVICE CO | c91428exv99w2.htm |
| EX-99.4 - EXHIBIT 99.4 - ARIZONA PUBLIC SERVICE CO | c91428exv99w4.htm |
| EX-99.1 - EXHIBIT 99.1 - ARIZONA PUBLIC SERVICE CO | c91428exv99w1.htm |
Exhibit 99.3
| 3rd Quarter 2009 Results |
| Forward-Looking Statements This presentation contains forward-looking statements based on current expectations, and neither Pinnacle West Capital Corporation ("Pinnacle West") nor Arizona Public Service Company ("APS") assumes any obligation to update these statements, even if our internal estimates change, unless otherwise required by applicable securities laws. These forward-looking statements are often identified by words such as "estimate," "predict," "may," "believe," "plan," "expect," "require," "intend," "assume" and similar words. Because actual results may differ materially from expectations, we caution readers not to place undue reliance on these statements. A number of factors could cause future results to differ materially from historical results, or from outcomes currently expected or sought by Pinnacle West or APS. In addition to the Risk Factors described in Item 1A of the Pinnacle West/APS Annual Report on Form 10-K for the fiscal year ended December 31, 2008, these factors include, but are not limited to: regulatory and judicial decisions, developments and proceedings, including the outcome and timing of APS' pending retail rate case; our ability to achieve timely and adequate rate recovery of our costs; our ability to reduce capital expenditures and other costs while maintaining reliability and customer service levels; variations in demand for electricity, including those due to weather, the general economy, customer and sales growth (or decline), and the effects of energy conservation measures; power plant performance and outages; volatile fuel and purchased power costs; fuel and water supply availability; new federal legislation or regulation relating to greenhouse gas emissions, renewable energy mandates and energy efficiency standards; our ability to meet renewable energy requirements and recover related costs; risks inherent in the operation of nuclear facilities, including spent fuel disposal uncertainty; competition in retail and wholesale power markets; the duration and severity of the economic decline in Arizona and current credit, financial and real estate market conditions; the cost of debt and equity capital and the ability to access capital markets when required; restrictions on dividends or other burdensome provisions in our credit agreements and Arizona Corporation Commission orders; our ability, or the ability of our subsidiaries, to meet debt service obligations; changes to our credit ratings; the investment performance of the assets of our nuclear decommissioning trust, pension, and other postretirement benefit plans and the resulting impact on future funding requirements; liquidity of wholesale power markets and the use of derivative contracts in our business; potential shortfalls in insurance coverage; new accounting requirements or new interpretations of existing requirements; transmission and distribution system conditions and operating costs; the ability to meet the anticipated future need for additional baseload generation and associated transmission facilities in our region; the ability of our counterparties and power plant participants to meet contractual or other obligations; technological developments in the electric industry; and economic and other conditions affecting the real estate and credit markets in SunCor Development Company's market areas, which include Arizona, Idaho, New Mexico and Utah. |
| In this presentation, we present "regulated electricity segment gross margin" per diluted share of common stock. Regulated electricity segment gross margin refers to regulated electricity segment revenues less regulated electricity segment fuel and purchased power expenses. Regulated electricity segment gross margin is a "non-GAAP financial measure," as defined in accordance with SEC rules. Slide 19 reconciles this non-GAAP financial measure to the referenced revenue and expense line items on our Condensed Consolidated Statements of Income, which are the most directly comparable financial measures calculated and presented in accordance with GAAP. We view regulated electricity segment gross margin as an important performance measure of the core profitability of our operations. We refer to "on-going earnings" in this presentation, which is also a non-GAAP financial measure. We believe on-going earnings provide investors with a useful indicator of our results that is comparable among periods because it excludes the effects of unusual items that may occur on an irregular basis. Slide 5 provides a reconciliation of on-going earnings to our reported earnings. Investors should note that these non-GAAP financial measures may involve judgments by management, including whether an item is classified as an unusual item. These measures are key components of our internal financial reporting and are used by our management in analyzing the operations of our business. We believe that investors benefit from having access to the same financial measures that management uses. Non-GAAP Financial Measures |
| CFO Agenda 3rd Quarter Results Arizona Economic Outlook Earnings Guidance Liquidity and Financing |
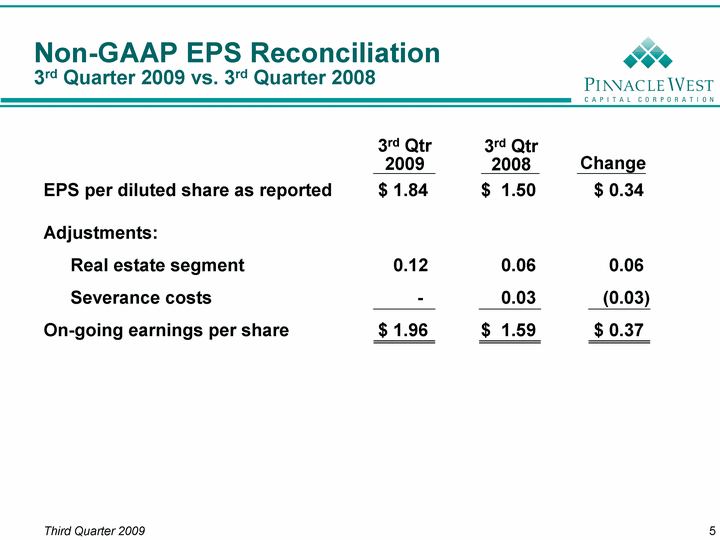
| Non-GAAP EPS Reconciliation 3rd Quarter 2009 vs. 3rd Quarter 2008 EPS per diluted share as reported $ 1.84 $ 1.50 $ 0.34 Adjustments: Real estate segment 0.12 0.06 0.06 Severance costs - 0.03 (0.03) On-going earnings per share $ 1.96 $ 1.59 $ 0.37 3rd Qtr 2009 Change 3rd Qtr 2008 |
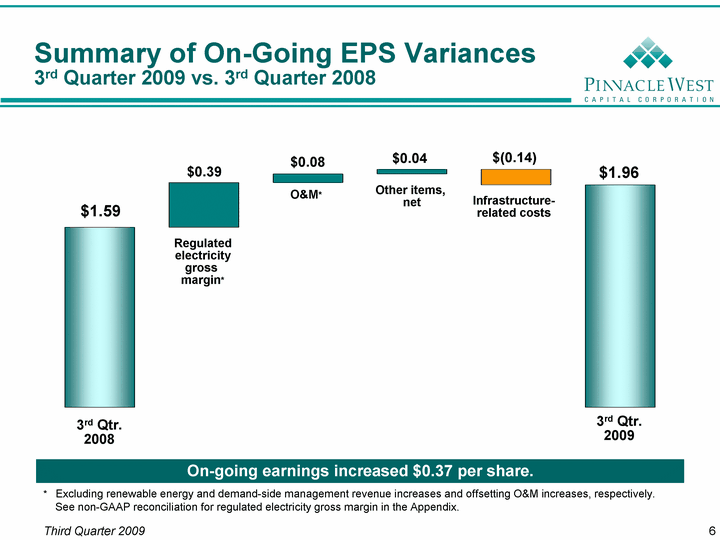
| 3rd Quarter 2008 Regulated gross margin O&M Other items, net infrastructure 3rd Quarter 2009 1.59 1.59 1.98 2.06 1.96 1.96 0.39 0.08 0.04 0.14 3rd Qtr. 2008 3rd Qtr. 2009 Regulated electricity gross margin* O&M* Infrastructure- related costs $1.59 $0.39 $0.08 $(0.14) $1.96 On-going earnings increased $0.37 per share. Summary of On-Going EPS Variances 3rd Quarter 2009 vs. 3rd Quarter 2008 * Excluding renewable energy and demand-side management revenue increases and offsetting O&M increases, respectively. See non-GAAP reconciliation for regulated electricity gross margin in the Appendix. Other items, net $0.04 |
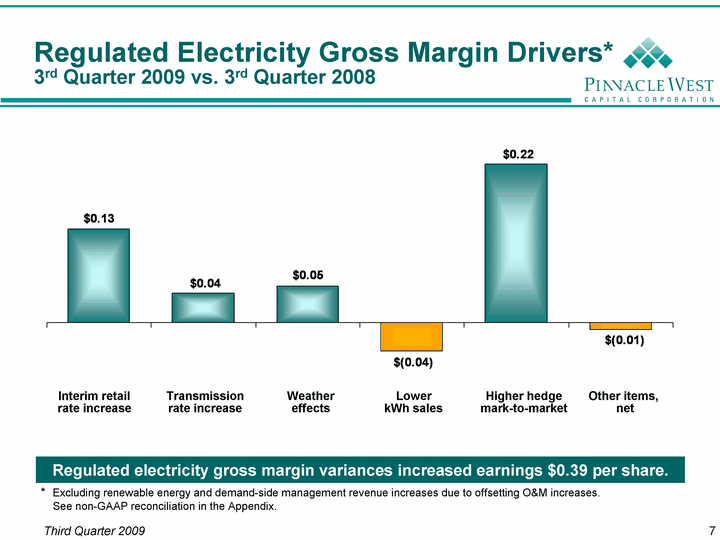
| Regulated Electricity Gross Margin Drivers* 3rd Quarter 2009 vs. 3rd Quarter 2008 Interim rates Transmission Rates weather customer usage MTM Other items, net 0.13 0.04 0.05 -0.04 0.22 -0.01 Transmission rate increase Lower kWh sales Weather effects Higher hedge mark-to-market Regulated electricity gross margin variances increased earnings $0.39 per share. Interim retail rate increase Other items, net * Excluding renewable energy and demand-side management revenue increases due to offsetting O&M increases. See non-GAAP reconciliation in the Appendix. |
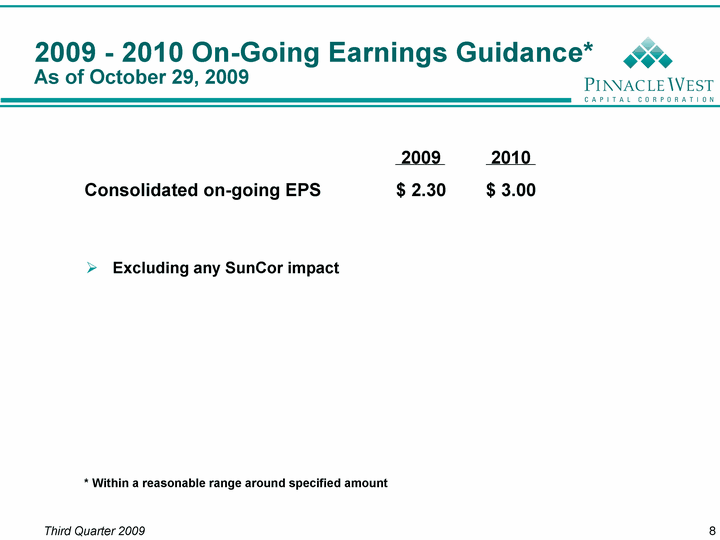
| Guidance Estimates* 2009 2010 Consolidated on-going EPS $ 2.30 $ 3.00 Key Assumptions 2009 Full-year interim base rates No additional base rate increases APS - reasonable range around $2.35 per share 2010 Rate settlement as proposed effective entire year APS - reasonable range around $3.00 per share 2009 - 2010 On-Going Earnings Guidance As of October 29, 2009 * Within a reasonable range around specified amount Excluding any SunCor impact |
| CEO Agenda Regulatory Settlement Status Renewable Resources Operations Update SunCor Restructuring Status Looking Ahead |
| Appendix |
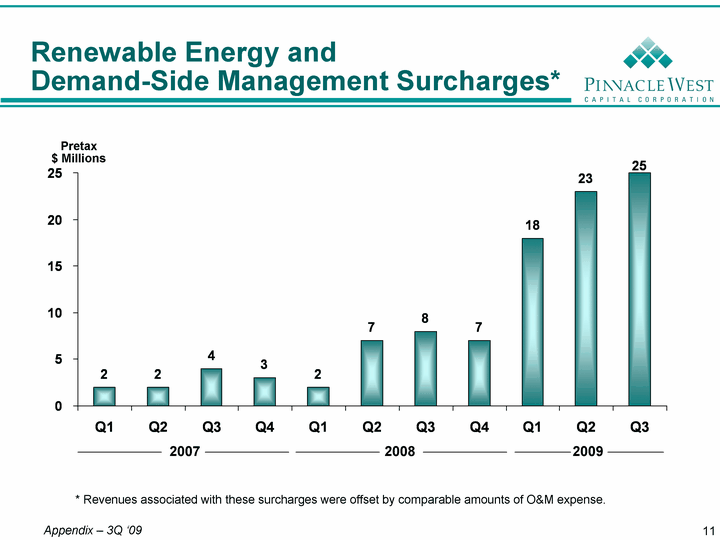
| Renewable Energy and Demand-Side Management Surcharges* Q1 2 Q2 2 Q3 4 Q4 3 Q1 2 Q2 7 Q3 8 Q4 7 Q1 18 Q2 23 Q3 25 * Revenues associated with these surcharges were offset by comparable amounts of O&M expense. 2007 2008 2009 Pretax $ Millions |
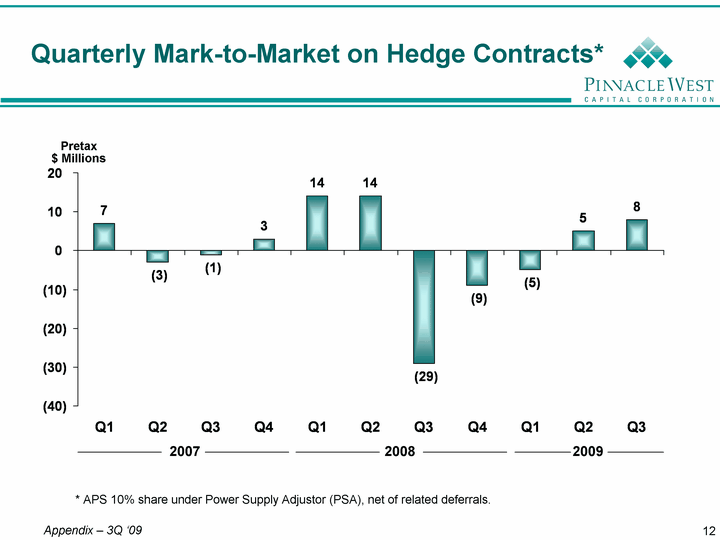
| Q1 7 Q2 -3 Q3 -1 Q4 3 Q1 14 Q2 14 Q3 -29 Q4 -9 Q1 -5 Q2 5 Q3 8 Quarterly Mark-to-Market on Hedge Contracts* Pretax $ Millions * APS 10% share under Power Supply Adjustor (PSA), net of related deferrals. 2007 2008 2009 |
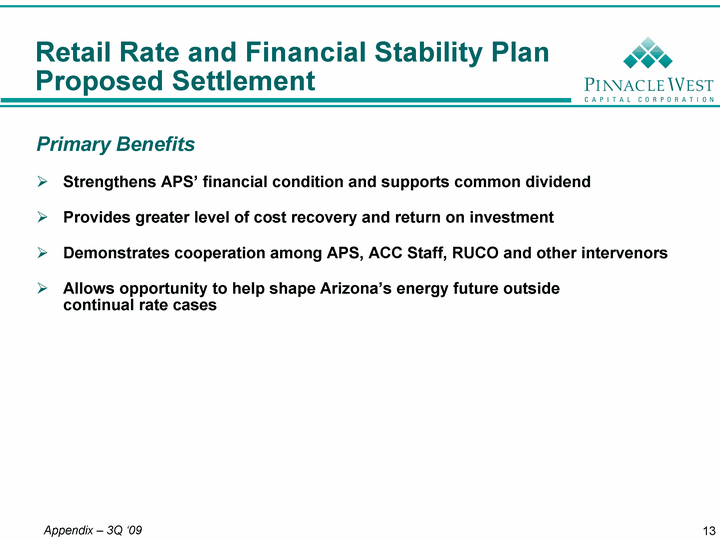
| Retail Rate and Financial Stability Plan Proposed Settlement Primary Benefits Strengthens APS' financial condition and supports common dividend Provides greater level of cost recovery and return on investment Demonstrates cooperation among APS, ACC Staff, RUCO and other intervenors Allows opportunity to help shape Arizona's energy future outside continual rate cases |
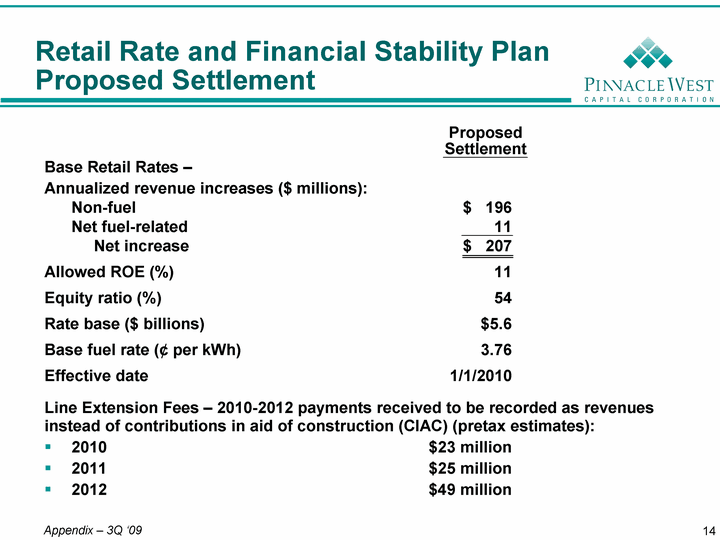
| Base Retail Rates - Annualized revenue increases ($ millions): Non-fuel $ 196 Net fuel-related 11 Net increase $ 207 Allowed ROE (%) 11 Equity ratio (%) 54 Rate base ($ billions) $5.6 Base fuel rate (¢ per kWh) 3.76 Effective date 1/1/2010 Line Extension Fees - 2010-2012 payments received to be recorded as revenues instead of contributions in aid of construction (CIAC) (pretax estimates): 2010 $23 million 2011 $25 million 2012 $49 million Proposed Settlement Retail Rate and Financial Stability Plan Proposed Settlement |
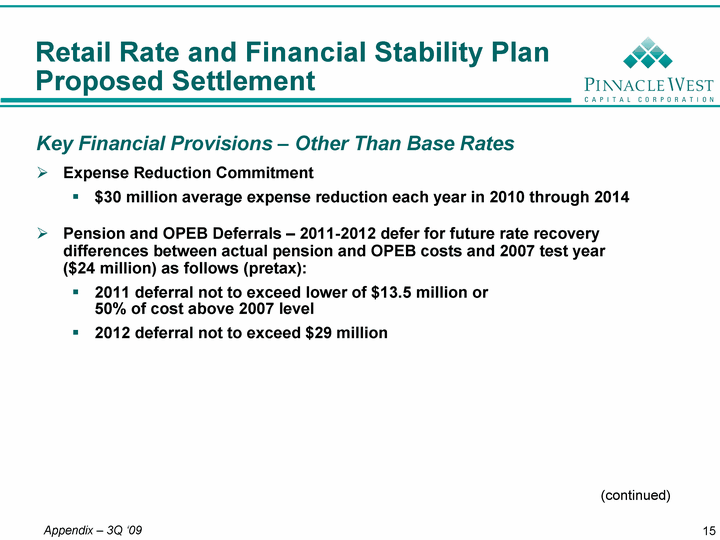
| Retail Rate and Financial Stability Plan Proposed Settlement Key Financial Provisions - Other Than Base Rates Expense Reduction Commitment $30 million average expense reduction each year in 2010 through 2014 Pension and OPEB Deferrals - 2011-2012 defer for future rate recovery differences between actual pension and OPEB costs and 2007 test year ($24 million) as follows (pretax): 2011 deferral not to exceed lower of $13.5 million or 50% of cost above 2007 level 2012 deferral not to exceed $29 million (continued) |
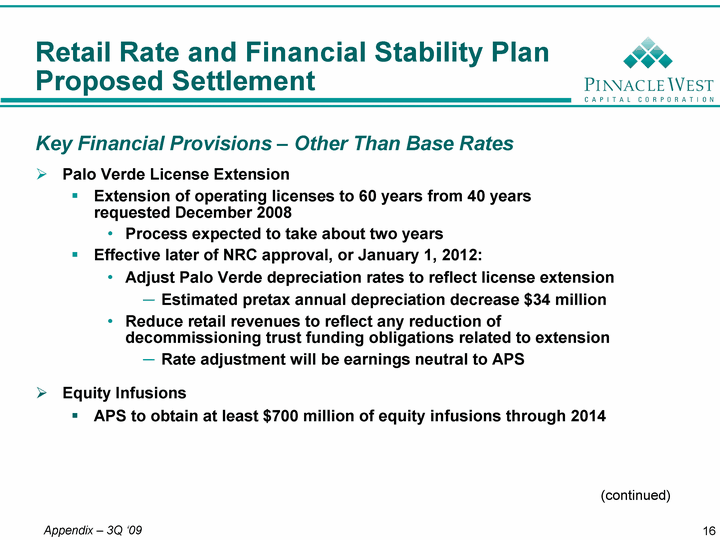
| Retail Rate and Financial Stability Plan Proposed Settlement Key Financial Provisions - Other Than Base Rates Palo Verde License Extension Extension of operating licenses to 60 years from 40 years requested December 2008 Process expected to take about two years Effective later of NRC approval, or January 1, 2012: Adjust Palo Verde depreciation rates to reflect license extension Estimated pretax annual depreciation decrease $34 million Reduce retail revenues to reflect any reduction of decommissioning trust funding obligations related to extension Rate adjustment will be earnings neutral to APS Equity Infusions APS to obtain at least $700 million of equity infusions through 2014 (continued) |
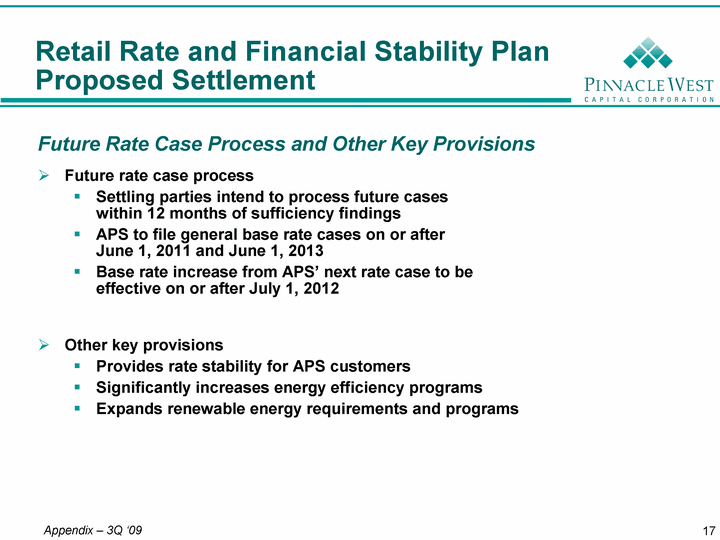
| Retail Rate and Financial Stability Plan Proposed Settlement Future Rate Case Process and Other Key Provisions Future rate case process Settling parties intend to process future cases within 12 months of sufficiency findings APS to file general base rate cases on or after June 1, 2011 and June 1, 2013 Base rate increase from APS' next rate case to be effective on or after July 1, 2012 Other key provisions Provides rate stability for APS customers Significantly increases energy efficiency programs Expands renewable energy requirements and programs |
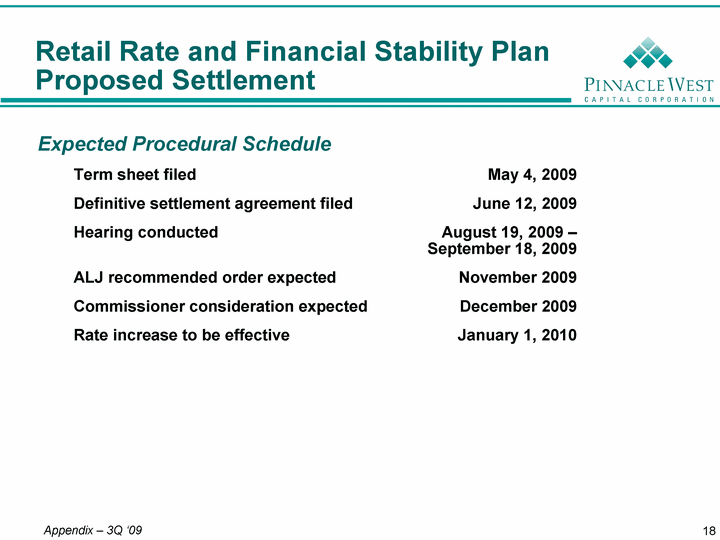
| Retail Rate and Financial Stability Plan Proposed Settlement Expected Procedural Schedule Term sheet filed May 4, 2009 Definitive settlement agreement filed June 12, 2009 Hearing conducted August 19, 2009 - September 18, 2009 ALJ recommended order expected November 2009 Commissioner consideration expected December 2009 Rate increase to be effective January 1, 2010 |
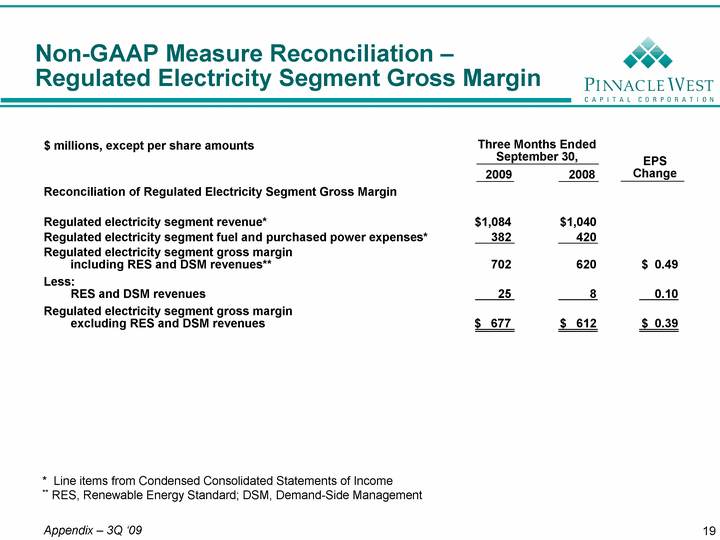
| Reconciliation of Regulated Electricity Segment Gross Margin Regulated electricity segment revenue* $1,084 $1,040 Regulated electricity segment fuel and purchased power expenses* 382 420 Regulated electricity segment gross margin including RES and DSM revenues** 702 620 Less: RES and DSM revenues 25 8 Regulated electricity segment gross margin excluding RES and DSM revenues $ 677 $ 612 Three Months Ended September 30, EPS Change 2009 2008 $ millions, except per share amounts $ 0.49 0.10 $ 0.39 Non-GAAP Measure Reconciliation - Regulated Electricity Segment Gross Margin * Line items from Condensed Consolidated Statements of Income ** RES, Renewable Energy Standard; DSM, Demand-Side Management |
