Attached files
| file | filename |
|---|---|
| 8-K - PUBLIC SERVICE ELECTRIC & GAS CO | c59187_8-k.htm |
| EX-99 - PUBLIC SERVICE ELECTRIC & GAS CO | c59187_ex99.htm |
Exhibit 99.1

Public Service Enterprise Group
PSEG Earnings Conference Call
3rd Quarter 2009
October 28, 2009

Forward-Looking Statement
Readers are cautioned that statements contained in this presentation about our and
our subsidiaries' future performance, including future
revenues, earnings, strategies, prospects and all other statements that are not purely historical, are forward-looking statements for purposes of
the safe harbor provisions under The Private Securities
Litigation Reform Act of 1995. Although we believe that our expectations are based on
reasonable assumptions, we can give no assurance they will be achieved. The results or events predicted in these statements may differ
materially from actual
results or events. Factors which could cause results or events to differ from current expectations include, but are not
limited to:
Adverse changes in energy industry, law, policies and regulation, including market structures and rules, and reliability standards.
Any inability of our energy transmission and distribution businesses to obtain adequate and timely rate relief and regulatory approvals from
federal and state regulators.
Changes in federal and state environmental regulations that could increase our costs or limit operations of our generating units.
Changes in nuclear regulation and/or developments in the nuclear power industry generally, that could limit operations of our nuclear generating
units.
Actions or activities at one of our nuclear units that might adversely affect our ability to continue to operate that unit or other units at the same
site.
Any inability to balance our energy obligations, available supply and trading risks.
Any deterioration in our credit quality.
Availability of capital and credit at reasonable pricing terms and our ability to meet cash needs.
Any inability to realize anticipated tax benefits or retain tax credits.
Changes in the cost of or interruption in the supply of fuel and other commodities necessary to the operation of our generating units.
Delays or cost escalations in our construction and development activities.
Adverse investment performance of our decommissioning and defined benefit plan trust funds, and changes in discount rates and funding
requirements.
Changes in technology and increased customer conservation.
For further information, please refer to our Annual Report on Form 10-K, including Item 1A. Risk Factors, and subsequent reports on Form 10-Q and Form 8-K filed with the Securities and Exchange Commission. These documents address in further detail our business, industry issues and other factors that could cause actual results to differ materially from those indicated in this presentation. In addition, any forward-looking statements included herein represent our estimates only as of today and should not be relied upon as representing our estimates as of any subsequent date. While we may elect to update forward-looking statements from time to time, we specifically disclaim any obligation to do so, even if our internal estimates change, unless otherwise required by applicable securities laws.

GAAP Disclaimer
PSEG presents Operating Earnings in addition to its Net Income reported
in accordance with accounting principles generally accepted in the United
States (GAAP). Operating Earnings is a non-GAAP financial
measure that
differs from Net Income because it excludes gains or losses associated
with Nuclear Decommissioning Trust (NDT) and Mark-to-Market
(MTM)
accounting, the impact of the sale of certain non-core domestic and
international assets and material impairments and lease-transaction-
related charges. PSEG presents Operating Earnings
because
management believes that it is appropriate for investors to consider
results excluding these items in addition to the results reported in
accordance with GAAP. PSEG believes that the non-GAAP financial
measure of Operating Earnings provides
a consistent and comparable
measure of performance of its businesses to help shareholders
understand performance trends. This information is not intended to be
viewed as an alternative to GAAP information. The last two slides in this
presentation include a list of items excluded from Income from Continuing
Operations to reconcile to Operating Earnings, with a reference to that
slide included on each of the slides where the
non-GAAP information
appears.

PSEG
2009 Q3 Review
Ralph Izzo
Chairman, President and Chief Executive Officer

Q3 2009 Earnings Summary
180
-
Discontinued Operations, Net of Tax
$ 0.94
$ 0.92
EPS from Operating Earnings*
656
488
Net Income
476
488
Income from Continuing Operations
(1)
24
Reconciling Items, Net of Tax
$ 477
$ 464
Operating Earnings
2008
2009
$ millions (except EPS)
Quarter ended September 30,
* See page 33 for Items excluded from Income from Continuing Operations to reconcile to Operating Earnings.

YTD Earnings Summary
208
-
Discontinued Operations, Net of Tax
$ 2.41
$ 2.50
EPS from Operating Earnings*
954
1,243
Net Income
746
1,243
Income from Continuing Operations
(483)
(21)
Reconciling Items, Net of Tax
$ 1,229
$ 1,264
Operating Earnings
2008
2009
$ millions (except EPS)
Nine months ended September 30,
* See page 33 for Items excluded from Income from Continuing Operations to reconcile to Operating Earnings.

PSEG – Q3 2009: Positioned to meet long-term objectives
Q3 2009 results
Strong nuclear performance – 94.6% capacity factor
Dispatch flexibility aided margins
Challenging markets
Weak economy and cooler than normal weather
Participating in full-requirements, load serving auctions within PJM
Lease position
Terminations improve net cash position; reduce potential tax liability
Recent court decision – positive development in the ongoing
management of lease exposure
Sharpened business focus
Texas assets transferred to Power
Debt exchange reduced financing costs

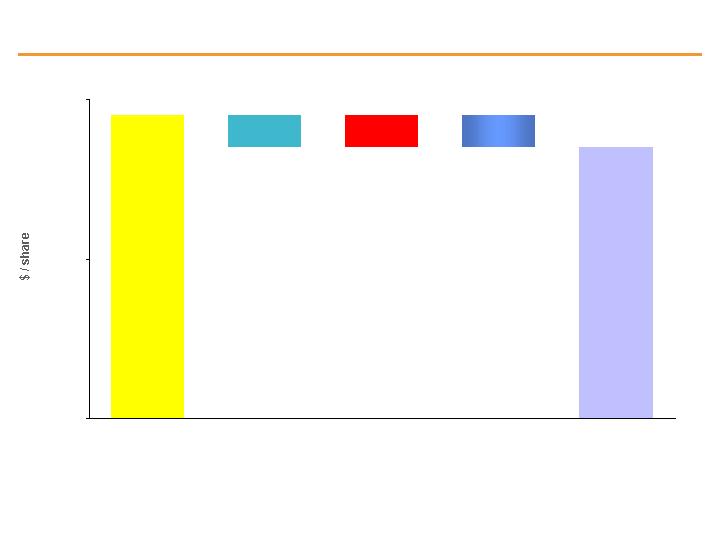
2007 Operating Earnings**
2008 Operating Earnings**
2009 Guidance
$2.68
$3.00 - $3.25
PSEG – 2009 Guidance maintained …
$3.03
* See page 33 for Items excluded from Income from Continuing Operations to reconcile to Operating Earnings.
** See page 34 for Items excluded from Income from Continuing Operations to reconcile to Operating Earnings.
YTD 2009
Operating
Earnings*:
$2.50
… but, upper-end a challenge

PSEG – Meeting Challenges
Established a new carbon reduction target – to reduce our
2005 carbon footprint by 25% by 2025.
Enhancing operational efficiency with a focus on achieving top
quartile performance across the enterprise.
Investing in areas with strong risk-adjusted returns.
Sustaining a strong balance sheet.
Providing an above average return through our common
dividend.

PSEG
2009 Q3 Operating Company Review
Caroline Dorsa
Executive Vice President and Chief Financial Officer

Q3 Operating Earnings by Subsidiary
$ 477
(5)
25
97
$ 360
2008
$ 464
20
18
87
$ 339
2009
Operating Earnings
Earnings per Share
(0.01)
0.04
Enterprise
$ 0.94
$ 0.92
Operating Earnings*
0.05
0.04
PSEG Energy Holdings
0.19
0.17
PSE&G
$ 0.71
$ 0.67
PSEG Power
2008
2009
$ millions (except EPS)
Quarter ended September 30,
* See page 33 for Items excluded from Income from Continuing Operations to reconcile to Operating Earnings.
10

YTD Operating Earnings by Subsidiary
$ 1,229
(14)
104
284
$ 855
2008
$ 1,264
17
58
253
$ 936
2009
Operating Earnings
Earnings per Share
(0.03)
0.03
Enterprise
$ 2.41
$ 2.50
Operating Earnings*
0.20
0.12
PSEG Energy Holdings
0.56
0.50
PSE&G
$ 1.68
$ 1.85
PSEG Power
2008
2009
$ millions (except EPS)
Nine months ended September 30,
* See page 33 for Items excluded from Income from Continuing Operations to reconcile to Operating Earnings.
11

$.94
(.04)
(.02)
(.01)
.05
$.92
0.00
0.25
0.50
0.75
1.00
PSEG EPS Reconciliation – Q3 2009 versus Q3 2008
Q3 2009
operating
earnings*
Q3 2008
operating
earnings*
Demand
Reduction,
Recontracting
and Lower Fuel
Expense (.08)
O&M .03
Interest .01
PSEG
Power
Weather and
Economic
Conditions (.02)
Transmission
Margin .02
O&M (.02)
PSE&G
PSEG Energy
Holdings
Texas Generation
Facilities (.02)
2009 Lease Sales
.03
Effective Tax Rate
and Other .02
Intercompany
Transactions
Eliminated in
Consolidation (.04)
* See page 33 for Items excluded from Income from Continuing Operations to reconcile to Operating Earnings.
Enterprise
Interest .01
Intercompany
Transactions
Eliminated in
Consolidation
.04

PSEG Power
2009 Q3 Review

PSEG Power – Q3 2009 EPS Summary
21
(20)
1
Mark-to-Market, Net of Tax
19
(12)
7
NDT Funds Related Activity,
Net of Tax
($ 411)
$ 1,833
$ 1,422
Operating Revenues
($ 0.04)
$ 0.71
$ 0.67
EPS from Operating Earnings*
19
328
347
Net Income
(21)
360
339
Operating Earnings
Variance
Q3 2008
Q3 2009
$ millions (except EPS)
* See page 33 for Items excluded from Income from Continuing Operations to reconcile to Operating Earnings.

$.67
.01
.03
(.08)
$.71
0.00
0.25
0.50
0.75
1.00
Demand
Reduction,
Recontracting
and Lower Fuel
Expense
PSEG Power EPS Reconciliation – Q3 2009 versus Q3 2008
Q3 2009
operating
earnings*
Q3 2008
operating
earnings*
O&M
* See page 33 for Items excluded from Income from Continuing Operations to reconcile to Operating Earnings.
Interest
15

PSEG Power – Generation Measures
7,628
7,738
3,730
2,241
4,144
3,925
0
8,750
17,500
2008
2009
Quarter ended September 30,
Total Nuclear
Total Coal*
Total Oil &
Natural Gas
* Includes figures for Pumped Storage
PSEG Power – Generation (GWh)
15,502
13,904
21,924
22,751
10,276
6,391
10,571
9,434
0
22,500
45,000
2008
2009
Nine months ended September 30,
42,771
38,576
16

PSEG Power – Fuel Costs
159
338
Oil & Gas
80
130
Coal
20.00
32.40
$ / MWh
13,904
15,502
Total Generation
(GWh)
278
502
Total Fuel Cost
39
34
Nuclear
Total Fossil
($ millions)
239
468
2009
2008
Quarter
ended September 30,
PSEG Power – Fuel Costs
451
959
Oil & Gas
221
331
Coal
20.30
32.40
$ / MWh
38,576
42,771
Total Generation
(GWh)
782
1,386
Total Fuel Cost
110
96
Nuclear
Total Fossil
($ millions)
672
1,290
2009
2008
Nine months ended
September 30,
17

PSEG Power – Gross Margin Performance
$0
$25
$50
$75
2008
2009
$0
$25
$50
$75
2008
2009
$61
$64
Quarter ended
September 30,
Nine months ended
September 30,
$54
$64
In Q3, PJM total gross margin was sustained by lower costs to serve, including strong performance of our nuclear fleet, which offset lower overall demand
Low gas pricing resulted in gas displacing coal-fired generation
Regional Performance
$22
$12
$858
Gross
Margin ($M)
Q3 Performance
Region
Low spark spreads, partially offset by
increase in gas-fired generation.
New York
Performance of Bridgeport Harbor
hurt by low energy prices and high
cost of coal.
New
England
Q3 contribution to gross margin ($M) flat versus year ago; strong nuclear production, higher contracted prices and decline in cost to serve offset 7% reduction in PJM-related generation volumes.
PJM
PSEG Power Gross Margin ($/MWh)

PSEG Power – Q3 Operating Highlights
10% decline in total output is a reflection of market conditions.
Weighted average combined cycle capacity factor of 53% - consistent with Q3 2008.
Weighted average coal capacity factor of 44% vs 71% in Q3 2008.
Q3 nuclear fleet capacity factor of 94.6%; Salem 2 refueling outage underway in Q4 2009.
Low cost nuclear fleet met 56% of load requirements in the quarter.
Operations
Regulatory and Market Environment
Financial
Power markets affected by abnormally cool weather, contraction in economic growth and excess supply of gas.
Actively managing coal inventory.
Incurred $16 million of charges in Q3 for cancelling coal shipments.
Texas gas-fired assets (2,000 MW) transferred on October 1, 2009.
Power issued $303 million of notes (5.32%) and paid $101 million of cash in
exchange for $368 million of Holdings’ debt in September.

PSE&G
2009 Q3 Review

PSE&G – Q3 2009 Earnings Summary
(309)
2,026
1,717
Total Operating Expenses
(1)
31
30
Taxes Other than Income Taxes
Operating Expenses
(354)
1,521
1,167
Energy Costs
38
313
351
Operation & Maintenance
8
161
169
Depreciation & Amortization
($ 0.02)
$ 0.19
$ 0.17
EPS from Operating Earnings*
(10)
97
87
Operating Earnings / Net Income
($ 331)
$ 2,274
$ 1,943
Operating Revenues
Variance
Q3 2008
Q3 2009
$ millions (except EPS)
* See page 33 for Items excluded from Income from Continuing Operations to reconcile to Operating Earnings.
$.19
(.02)
.02
(.02)
$.17
0.00
0.10
0.20
PSE&G EPS Reconciliation – Q3 2009 versus Q3 2008
Q3 2009
operating
earnings*
Q3 2008
operating
earnings*
Weather and
Economic
Conditions
O&M
* See page 33 for Items excluded from Income from Continuing Operations to reconcile to Operating Earnings.
Transmission
Margin

5.2
26.8
43.0
2.0
55.3
55.0
38.0
33.0
4.6
3.0
0
40
80
120
160
2009
Normal
2008
May
June
July
August
September
While on average the summer was cool,…
Number of Hours Where the Temperature was Equal or Greater than 90oF
40.0
124.8
101.0
… the very hot, peak-producing hours were also noticeably absent.

PSE&G – Q3 Operating Highlights
PSE&G electric and gas request increased by $13 million and $9 million to $147
million and $106 million, respectively.
Adjusted request reflects 6 months of actual results ended June 30 and 6 months
forecast.
Rate Counsel and Intervener testimony scheduled for November 19.
Filed for 2010 Annual Formula Rate Update with FERC, effective January 1, 2010.
NJ BPU decision on Susquehanna-Roseland anticipated early 2010.
Average return on equity for 12 months ended Sep 30, 2009 of 8.6%.
Operations
Regulatory and Market Environment
Financial
Results were equally affected by a decline in economic activity and cooler than
normal weather.
Temperature Humidity Index 27% below normal, 22% below 2008 levels.
Anticipate weather adjusted decline in electric sales at upper-end of forecast of 1.5% -
2.0% for full year.

PSEG Energy Holdings
2009 Q3 Review

PSEG Energy Holdings – Q3 2009 Earnings Summary
(180)
180
--
Discontinued Operations, Net of Tax
(15)
31
16
Mark-to-Market, Net of Tax
($0.01)
$ 0.05
$ 0.04
EPS from Operating Earnings*
($ 202)
$ 236
$ 34
Net Income
($ 7)
$ 25
$ 18
Operating Earnings
Variance
Q3 2008
Q3 2009
$ millions (except EPS)
* See page 33 for Items excluded from Income from Continuing Operations to reconcile to Operating Earnings.

.04
(.04)
.02
.03
(.02)
$.05
0.00
0.05
0.10
PSEG Energy Holdings EPS Reconciliation – Q3 2009 versus
Q3 2008
Q3 2009
operating
earnings*
Q3 2008
operating
earnings*
Texas Generation
Facilities
2009 Lease
Sales
* See page 33 for Items excluded from Income from Continuing Operations to reconcile to Operating Earnings.
Effective
Tax Rate
and Other
Intercompany
Transactions
Eliminated in
Consolidation

PSEG Energy Holdings – Q3 Operating Highlights
Texas market hurt by decline in natural gas prices.
PSEG Solar Source completed 2 MW DC (direct current) project and announced
two additional large scale solar projects totaling 27 MW DC to be completed by
end of 2010.
Aggregate principal amount of 74% of Energy Holdings’ 8.5% Senior Notes due
2011 ($368M) were exchanged for $303M of PSEG Power Notes and $101M of
cash.
Terminated 3 leases for $219 million and gain of $16 million ($0.03 per share);
potential tax exposure reduced by $175 million.
Operations
Regulatory and Market Environment
Financial
$21.11
2,328
Q3 2009
$27.11
2,566
Q3 2008
Gross Margin ($/MWh)
Production (GWh)
Lower margin a reflection of decline in energy prices.
Transfer of 2,000MW gas-fired Texas assets to PSEG Power, effective October 1.

PSEG

Revised 2009 Operating Earnings Guidance …
$ 3.03
$ 1,542
($ 24)
$ 99
$ 360
$ 1,107
2008A*
$ 3.00 – $ 3.25
$ 1,520 – $ 1,640
$ 10 – $15
$ 25 – $ 45
$ 315 – $ 335
$ 1,170 – $ 1,245
2009E
Enterprise
Earnings per Share
Operating Earnings
PSEG Energy Holdings
PSE&G
PSEG Power
$ millions (except EPS)
* See page 34 for Items excluded from Income from Continuing Operations to reconcile to Operating Earnings.
… upper-end a challenge.

$2.41
.17
(.06)
(.08)
.06
$2.50
1.00
1.50
2.00
2.50
3.00
PSEG EPS Reconciliation – YTD 2009 versus YTD 2008
Nine months
ended 9/30/2009
operating
earnings*
Nine months
ended 9/30/2008
operating
earnings*
Interest .02
Intercompany
Transaction
Eliminated in
Consolidation .04
Recontracting,
Lower Fuel Expense
and Demand
Reduction .13
O&M .02
Depreciation,
interest & Other .02
PSEG Power
Transmission
Margin .04
Electric and Gas
Margins (.01)
O&M (.03)
Depreciation, Taxes
& Other (.06)
PSE&G
PSEG Energy
Holdings
Enterprise
Texas Generation
Facilities (.08)
2009 Lease Sales
.10
Lease Income (.03)
Effective Tax Rate
and Other (.03)
Intercompany
Transaction
Eliminated in
Consolidation (.04)
* See page 33 for Items excluded from Net Income to reconcile to Operating Earnings

PSEG Liquidity as of October 23, 2009
Expiration
Total
Primary
Usage at
Available
Company
Facility
Date
Facility
Purpose
10/23/2009
10/23/2009
PSEG
5-year Credit Facility
Dec-12
$1,000
1
CP Support/Funding/LCs
$219
$781
Uncommitted Bilateral
Agreement
N/A
N/A
Funding
0
N/A
Power
5-Year Credit Facility
Dec-12
1,600
2
Funding/LCs
220
1,380
2-Year Credit Facility
Jul-11
350
Funding
0
350
Bilateral Credit Facility
Mar-10
100
Funding/LCs
34
66
PSE&G
5-year Credit Facility
Jun-12
600
3
CP Support/Funding/LCs
110
490
Uncommitted Bilateral
N/A
N/A
Funding
0
N/A
Total
$3,650
$3,067
1
PSEG Facility reduces by $47 million in 12/2011
2
Power Facility reduces by $75 million in 12/2011
3
PSE&G Facility reduces by $28 million in 12/2011

Items Excluded from Income from Continuing Operations to
Reconcile to Operating Earnings
Please see Page 2 for an explanation of PSEG’s use of Operating Earnings as a non-GAAP financial measure and how
it differs from Net Income.
Pro-forma Adjustments, net of tax
2009
2008
2009
2008
Earnings Impact ($ Millions)
Gain (Loss) on Nuclear Decommissioning Trust (NDT) Fund Related Activity
7
$
(12)
$
1
$
(22)
$
Gain (Loss) on Mark-to-Market (MTM)
17
11
(22)
30
Lease Reserves
-
-
-
(490)
Premium on Bond Redemption
-
-
-
(1)
Total Pro-forma adjustments
24
$
(1)
$
(21)
$
(483)
$
Fully Diluted Average Shares Outstanding (in Millions)
507
508
507
509
Per Share Impact (Diluted)
Gain (Loss) on Nuclear Decommissioning Trust (NDT) Fund Related Activity
0.01
$
(0.02)
$
-
$
(0.04)
$
Gain (Loss) on Mark-to-Market (MTM)
0.03
0.02
(0.05)
0.06
Lease Reserves
-
-
-
(0.96)
Premium on Bond Redemption
-
-
-
-
Total Pro-forma adjustments
0.04
$
-
$
(0.05)
$
(0.94)
$
For the Quarters Ended
For the Nine Months Ended
September 30,
PUBLIC SERVICE ENTERPRISE GROUP INCORPORATED
Reconciling Items Excluded from Continuing Operations to Compute Operating Earnings
(Unaudited)
September 30,

Please see Page 2 for an explanation of PSEG’s use of Operating Earnings as a non-GAAP financial measure
and how it differs from Net Income.
Items Excluded from Income from Continuing Operations to
Reconcile to Operating Earnings
Pro-forma Adjustments, net of tax
2008
2007
Earnings Impact (in Millions)
Impairment of PPN
(9)
$
(2)
$
Impairment of Turboven
(4)
(7)
Loss on Sale of Chilquinta and Luz del Sur
-
(23)
Nuclear Decommissioning Trust (NDT) Fund Related Activity
(71)
12
Mark-to-Market (MTM)
16
10
Premium on Bond Redemption
(1)
(28)
Lease Reserves
(490)
-
Total Pro-forma to Operating Earnings
(559)
$
(38)
$
Fully Diluted Average Shares Outstanding (in Millions)
508
509
Per Share Impact (Diluted)
Impairment of PPN
(0.02)
$
-
$
Impairment of Turboven
(0.01)
(0.01)
Loss on Sale of Chilquinta and Luz del Sur
-
(0.05)
Nuclear Decommissioning Trust (NDT) Fund Related Activity
(0.14)
0.02
Mark-to-Market (MTM)
0.03
0.02
Premium on Bond Redemption
-
(0.06)
Lease Reserves
(0.96)
-
Total Pro-forma to Operating Earnings
(1.10)
$
(0.08)
$
December 31,
PUBLIC SERVICE ENTERPRISE GROUP INCORPORATED
Reconciling Items Excluded from Continuing Operations to Compute Operating Earnings
(Unaudited)
For the Twelve Months Ended