Attached files
| file | filename |
|---|---|
| EX-99.1 - EX-99.1 - ev3 Inc. | c54262exv99w1.htm |
| 8-K - FORM 8-K - ev3 Inc. | c54262e8vk.htm |
Exhibit 99.2

| Q3 '09 Highlights October 27, 2009 |
| Forward-Looking Statements Statements contained in this presentation that relate to future, not past, events are forward-looking statements under the Private Securities Litigation Reform Act of 1995. Forward-looking statements often can be identified by words such as "expect," "anticipate," "intend," "will," "may," "believe," "could," "continue," "future," "estimate," "outlook," "guidance," or the negative of these words or other words of similar meaning. Forward-looking statements by their nature address matters that are, to different degrees, uncertain. Uncertainties and risks may cause ev3's actual results to be materially different than those expressed in or implied by ev3's forward-looking statements. For ev3, particular uncertainties and risks include, among others, ev3's future operating results and financial performance, fluctuations in foreign currency exchange rates, the effect of the current global economic crisis, ev3's ability to implement, fund and achieve sustainable cost savings measures that will better align its operating expenses with its anticipated net sales levels and reallocate resources to better support growth initiatives, the timing of regulatory approvals and introduction of new products, market acceptance of new products, success of clinical testing, availability of third party reimbursement, impact of competitive products and pricing, the effect of regulatory actions and the cost and effect of changes in tax and other legislation. More detailed information on these and additional factors that could affect ev3's actual results are described in ev3's filings with the Securities and Exchange Commission, including its most recent annual report on Form 10-K and subsequent quarterly reports on Form 10-Q. Except as required by law, ev3 undertakes no obligation to publicly update its forward-looking statements. |
| Use of Non-GAAP Financial Measures ev3 uses certain non-GAAP financial measures in this presentation. ev3 uses non-GAAP financial measures as supplemental measures of performance and believes these measures provide useful information to investors in evaluating our operations, period over period. However, non-GAAP financial measures have limitations as analytical tools, and should not be considered in isolation or as a substitute for ev3's financial results prepared in accordance with GAAP. In addition, investors should note that any non- GAAP financial measures ev3 uses may not be the same non-GAAP financial measures, and may not be calculated in the same manner, as that of other companies. We have posted a reconciliation of our non- GAAP financial measures to the most directly comparable GAAP financial measures on our website at www.ev3.net. |
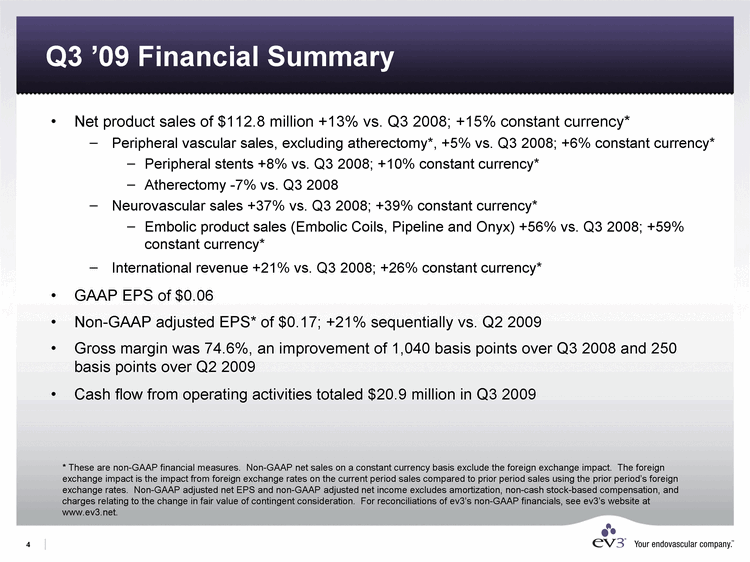
| Q3 '09 Financial Summary Net product sales of $112.8 million +13% vs. Q3 2008; +15% constant currency* Peripheral vascular sales, excluding atherectomy*, +5% vs. Q3 2008; +6% constant currency* Peripheral stents +8% vs. Q3 2008; +10% constant currency* Atherectomy -7% vs. Q3 2008 Neurovascular sales +37% vs. Q3 2008; +39% constant currency* Embolic product sales (Embolic Coils, Pipeline and Onyx) +56% vs. Q3 2008; +59% constant currency* International revenue +21% vs. Q3 2008; +26% constant currency* GAAP EPS of $0.06 Non-GAAP adjusted EPS* of $0.17; +21% sequentially vs. Q2 2009 Gross margin was 74.6%, an improvement of 1,040 basis points over Q3 2008 and 250 basis points over Q2 2009 Cash flow from operating activities totaled $20.9 million in Q3 2009 * These are non-GAAP financial measures. Non-GAAP net sales on a constant currency basis exclude the foreign exchange impact. The foreign exchange impact is the impact from foreign exchange rates on the current period sales compared to prior period sales using the prior period's foreign exchange rates. Non-GAAP adjusted net EPS and non-GAAP adjusted net income excludes amortization, non-cash stock-based compensation, and charges relating to the change in fair value of contingent consideration. For reconciliations of ev3's non-GAAP financials, see ev3's website at www.ev3.net. |
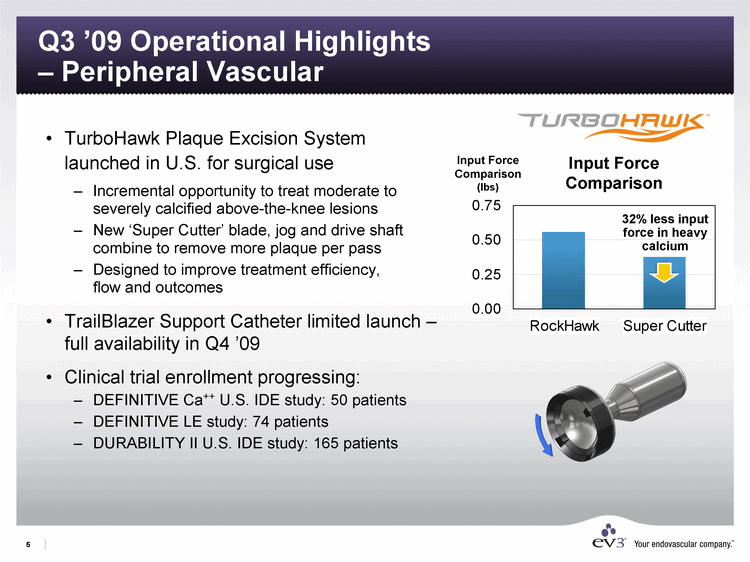
| Q3 '09 Operational Highlights - Peripheral Vascular TurboHawk Plaque Excision System launched in U.S. for surgical use Incremental opportunity to treat moderate to severely calcified above-the-knee lesions New 'Super Cutter' blade, jog and drive shaft combine to remove more plaque per pass Designed to improve treatment efficiency, flow and outcomes TrailBlazer Support Catheter limited launch - full availability in Q4 '09 Clinical trial enrollment progressing: DEFINITIVE Ca++ U.S. IDE study: 50 patients DEFINITIVE LE study: 74 patients DURABILITY II U.S. IDE study: 165 patients RockHawk Super Cutter East 0.56 0.38 32% less input force in heavy calcium Input Force Comparison Input Force Comparison (lbs) |
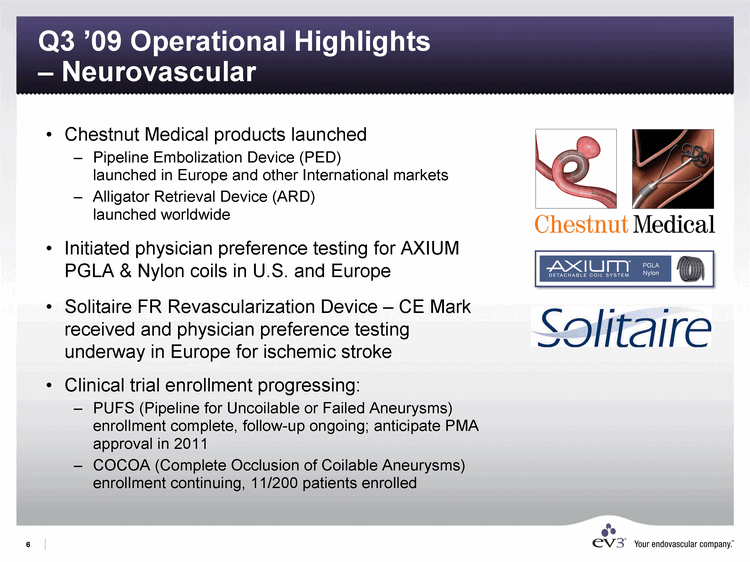
| Q3 '09 Operational Highlights - Neurovascular Chestnut Medical products launched Pipeline Embolization Device (PED) launched in Europe and other International markets Alligator Retrieval Device (ARD) launched worldwide Initiated physician preference testing for AXIUM PGLA & Nylon coils in U.S. and Europe Solitaire FR Revascularization Device - CE Mark received and physician preference testing underway in Europe for ischemic stroke Clinical trial enrollment progressing: PUFS (Pipeline for Uncoilable or Failed Aneurysms) enrollment complete, follow-up ongoing; anticipate PMA approval in 2011 COCOA (Complete Occlusion of Coilable Aneurysms) enrollment continuing, 11/200 patients enrolled |
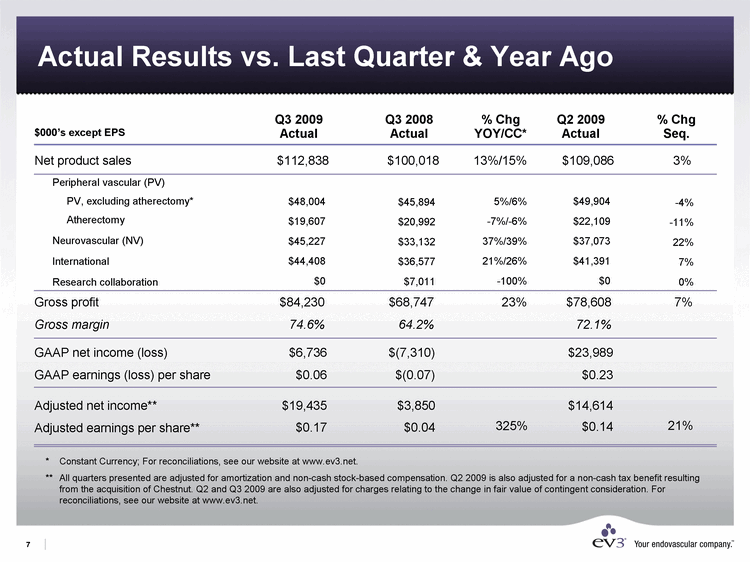
| Actual Results vs. Last Quarter & Year Ago * Constant Currency; For reconciliations, see our website at www.ev3.net. ** All quarters presented are adjusted for amortization and non-cash stock-based compensation. Q2 2009 is also adjusted for a non-cash tax benefit resulting from the acquisition of Chestnut. Q2 and Q3 2009 are also adjusted for charges relating to the change in fair value of contingent consideration. For reconciliations, see our website at www.ev3.net. Q2 2009 Actual Q3 2008 Actual $000's except EPS Net product sales Gross profit Gross margin GAAP net income (loss) GAAP earnings (loss) per share Adjusted net income** Adjusted earnings per share** $100,018 $68,747 64.2% $(7,310) $(0.07) $3,850 $0.04 $109,086 $78,608 72.1% $14,614 $0.14 Q3 2009 Actual $112,838 $6,736 $0.06 $19,435 $0.17 $84,230 74.6% Peripheral vascular (PV) PV, excluding atherectomy* Atherectomy Neurovascular (NV) International Research collaboration % Chg Seq. % Chg YOY/CC* $48,004 $19,607 $45,227 $44,408 $0 $49,904 $22,109 $37,073 $41,391 $0 $45,894 $20,992 $33,132 $36,577 $7,011 -4% -11% 22% 7% 0% 5%/6% -7%/-6% 37%/39% 21%/26% -100% 3% 13%/15% 7% 23% $23,989 $0.23 325% 21% |
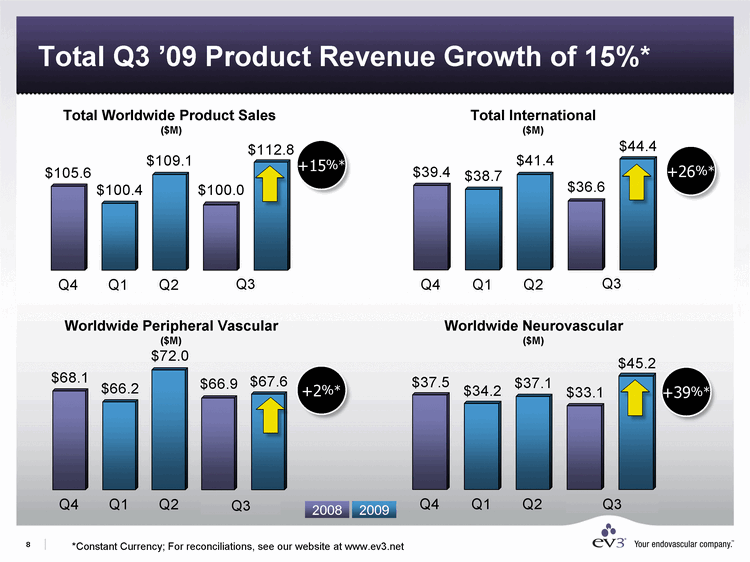
| Total Q3 '09 Product Revenue Growth of 15%* Q4 Q1 Q2 Q3 Q3 East 105.6 100.4 109.1 100 112.8 Q4 Q1 Q2 Q3 Q3 East 39.4 38.7 41.4 36.6 44.4 Total International ($M) +26%* Q4 Q1 Q2 Q3 Q3 East 68.1 66.2 72 66.9 67.6 Worldwide Peripheral Vascular ($M) +2%* Q4 Q1 Q2 Q3 Q3 East 37.5 34.2 37.1 33.1 45.2 Worldwide Neurovascular ($M) +39%* *Constant Currency; For reconciliations, see our website at www.ev3.net +15%* Q3 Total Worldwide Product Sales ($M) Q3 2008 2009 Q3 Q3 |
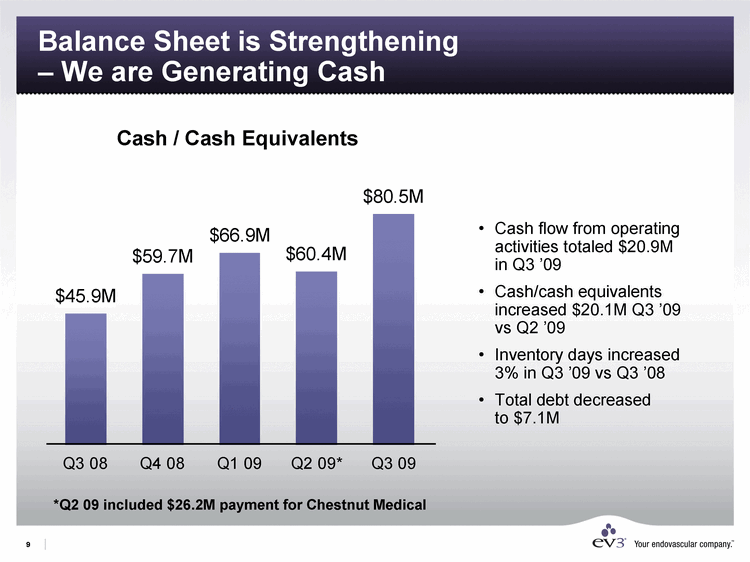
| Balance Sheet is Strengthening - We are Generating Cash Cash / Cash Equivalents Cash flow from operating activities totaled $20.9M in Q3 '09 Cash/cash equivalents increased $20.1M Q3 '09 vs Q2 '09 Inventory days increased 3% in Q3 '09 vs Q3 '08 Total debt decreased to $7.1M Q3 08 Q4 08 Q1 09 Q2 09* Q3 09 East 45.9 59.7 66.9 60.4 80.5 *Q2 09 included $26.2M payment for Chestnut Medical |
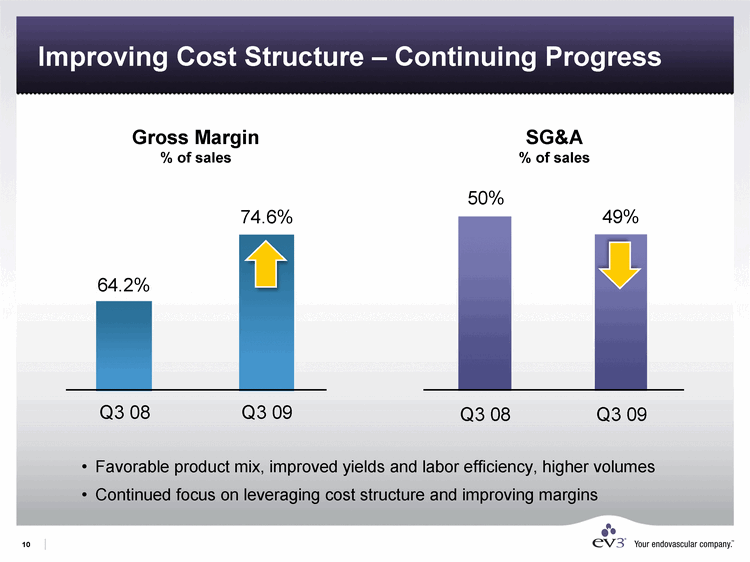
| Improving Cost Structure - Continuing Progress Q3 08 Q3 09 East 0.642 0.746 Gross Margin % of sales SG&A % of sales Q3 08 Q3 09 East 0.5 0.49 Favorable product mix, improved yields and labor efficiency, higher volumes Continued focus on leveraging cost structure and improving margins |
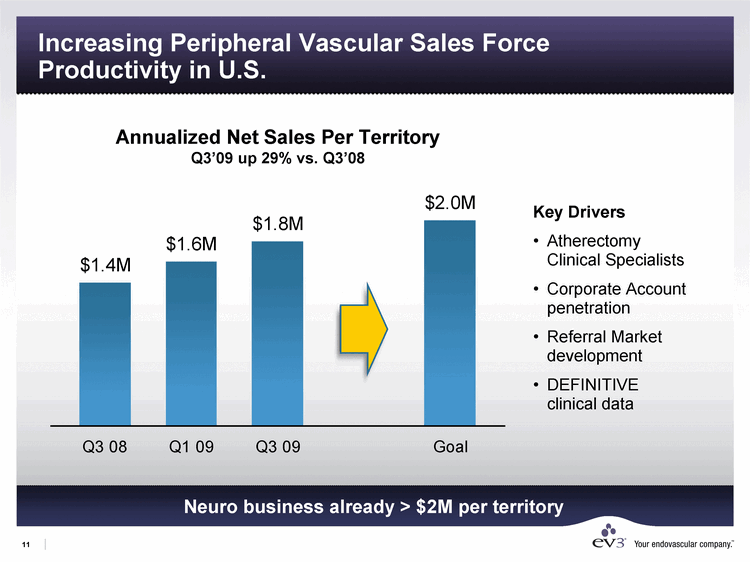
| Annualized Net Sales Per Territory Q3'09 up 29% vs. Q3'08 Key Drivers Atherectomy Clinical Specialists Corporate Account penetration Referral Market development DEFINITIVE clinical data Neuro business already > $2M per territory Increasing Peripheral Vascular Sales Force Productivity in U.S. Q3 08 Q1 09 Q3 09 Goal East 1.4 1.6 1.8 2 |
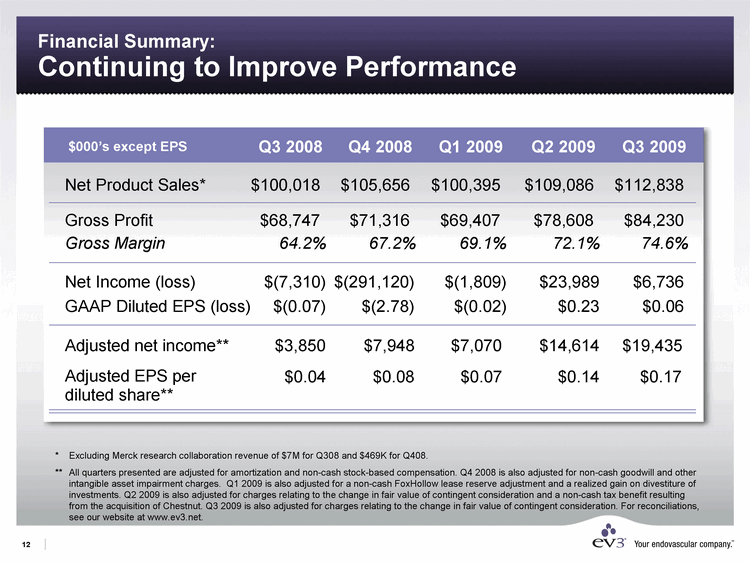
| Financial Summary: Continuing to Improve Performance Net Product Sales* $100,018 $105,656 $100,395 $109,086 $112,838 Gross Profit $68,747 $71,316 $69,407 $78,608 $84,230 Gross Margin 64.2% 67.2% 69.1% 72.1% 74.6% Net Income (loss) $(7,310) $(291,120) $(1,809) $23,989 $6,736 Adjusted EPS per diluted share** $0.04 $0.08 $0.07 $0.14 $0.17 GAAP Diluted EPS (loss) $(0.07) $(2.78) $(0.02) $0.23 $0.06 Q3 2008 Q4 2008 Q1 2009 Q2 2009 Q3 2009 $000's except EPS Adjusted net income** $3,850 $7,948 $7,070 $14,614 $19,435 * Excluding Merck research collaboration revenue of $7M for Q308 and $469K for Q408. ** All quarters presented are adjusted for amortization and non-cash stock-based compensation. Q4 2008 is also adjusted for non-cash goodwill and other intangible asset impairment charges. Q1 2009 is also adjusted for a non-cash FoxHollow lease reserve adjustment and a realized gain on divestiture of investments. Q2 2009 is also adjusted for charges relating to the change in fair value of contingent consideration and a non-cash tax benefit resulting from the acquisition of Chestnut. Q3 2009 is also adjusted for charges relating to the change in fair value of contingent consideration. For reconciliations, see our website at www.ev3.net. |
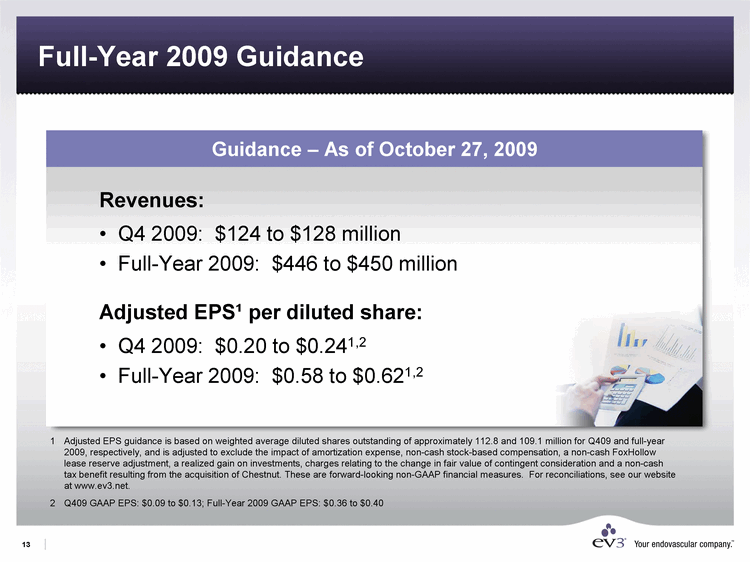
| Guidance - As of October 27, 2009 Full-Year 2009 Guidance Revenues: Q4 2009: $124 to $128 million Full-Year 2009: $446 to $450 million Adjusted EPS1 per diluted share: Q4 2009: $0.20 to $0.241,2 Full-Year 2009: $0.58 to $0.621,2 Adjusted EPS guidance is based on weighted average diluted shares outstanding of approximately 112.8 and 109.1 million for Q409 and full-year 2009, respectively, and is adjusted to exclude the impact of amortization expense, non-cash stock-based compensation, a non-cash FoxHollow lease reserve adjustment, a realized gain on investments, charges relating to the change in fair value of contingent consideration and a non-cash tax benefit resulting from the acquisition of Chestnut. These are forward-looking non-GAAP financial measures. For reconciliations, see our website at www.ev3.net. Q409 GAAP EPS: $0.09 to $0.13; Full-Year 2009 GAAP EPS: $0.36 to $0.40 |
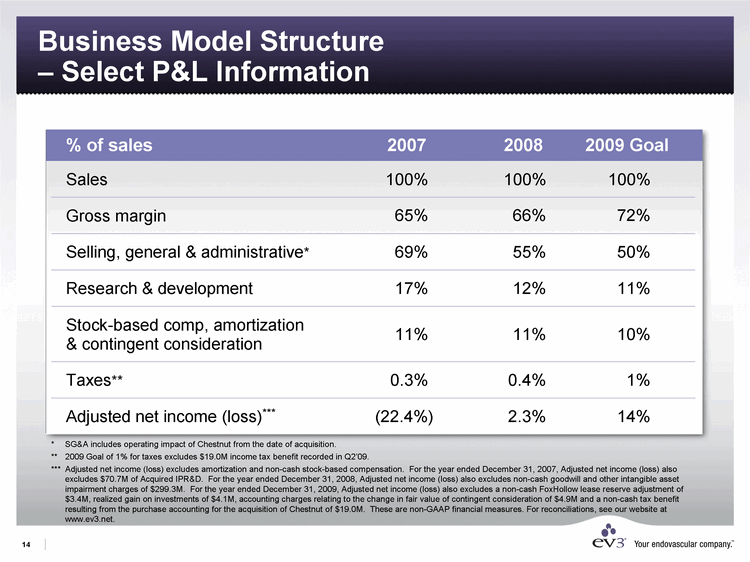
| 2008 % of sales 2007 2009 Goal Business Model Structure - Select P&L Information Sales 100% 100% 100% Gross margin 66% 65% 72% Selling, general & administrative* 55% 69% 50% Taxes** 0.4% 0.3% 1% Research & development 12% 17% 11% Stock-based comp, amortization & contingent consideration 11% 11% 10% Adjusted net income (loss)*** 2.3% (22.4%) 14% * SG&A includes operating impact of Chestnut from the date of acquisition. ** 2009 Goal of 1% for taxes excludes $19.0M income tax benefit recorded in Q2'09. *** Adjusted net income (loss) excludes amortization and non-cash stock-based compensation. For the year ended December 31, 2007, Adjusted net income (loss) also excludes $70.7M of Acquired IPR&D. For the year ended December 31, 2008, Adjusted net income (loss) also excludes non-cash goodwill and other intangible asset impairment charges of $299.3M. For the year ended December 31, 2009, Adjusted net income (loss) also excludes a non-cash FoxHollow lease reserve adjustment of $3.4M, realized gain on investments of $4.1M, accounting charges relating to the change in fair value of contingent consideration of $4.9M and a non-cash tax benefit resulting from the purchase accounting for the acquisition of Chestnut of $19.0M. These are non-GAAP financial measures. For reconciliations, see our website at www.ev3.net. |
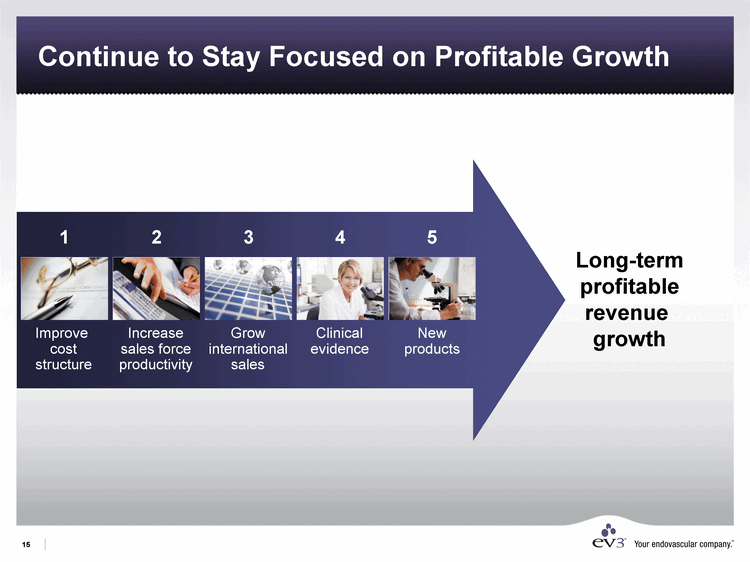
| Continue to Stay Focused on Profitable Growth Long-term profitable revenue growth Improve cost structure Increase sales force productivity Grow international sales Clinical evidence New products 1 2 3 4 5 |
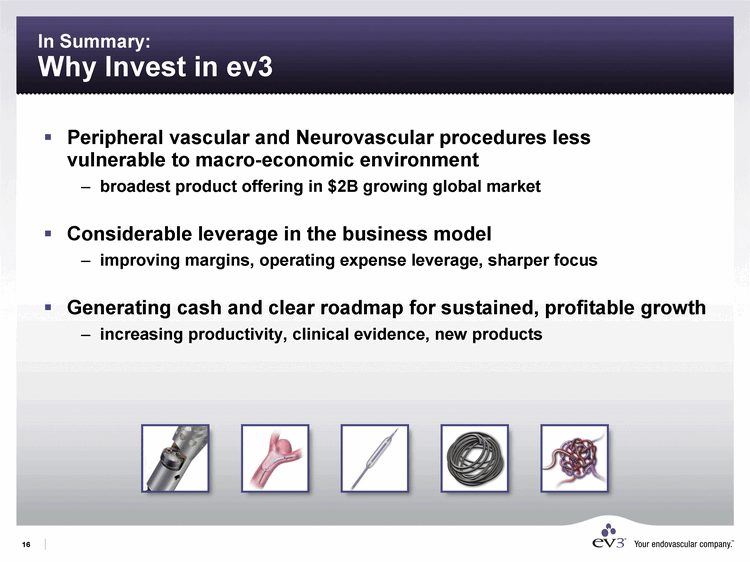
| In Summary: Why Invest in ev3 Peripheral vascular and Neurovascular procedures less vulnerable to macro-economic environment broadest product offering in $2B growing global market Generating cash and clear roadmap for sustained, profitable growth increasing productivity, clinical evidence, new products Considerable leverage in the business model improving margins, operating expense leverage, sharper focus |

| NASDAQ: EVVV www.ev3.net Contact Info: Julie Tracy - Sr. VP, Chief Communications Officer (949) 680-1375 jtracy@ev3.net |