Attached files
| file | filename |
|---|---|
| 8-K - FORM 8-K - SONIC AUTOMOTIVE INC | g20948e8vk.htm |
| EX-99.1 - EX-99.1 - SONIC AUTOMOTIVE INC | g20948exv99w1.htm |
Exhibit 99.2

| This presentation contains statements that constitute "forward-looking statements" within the meaning of Section 27A of the Securities Act of 1933 and Section 21E of the Securities Exchange Act of 1934. These forward-looking statements are not historical facts, but only predictions by our company and/or our company's management. These statements generally can be identified by lead-in words such as "believe," "expect" "anticipate," "intend," "plan," "foresee" and other similar words. Similarly, statements that describe our company's objectives, plans or goals are also forward-looking statements. You are cautioned that these forward-looking statements are not guarantees of future performance and involve risks and uncertainties, and that actual results may differ materially from those projected in the forward-looking statements as a result of various factors. Among others, factors that could materially adversely affect actual results and performance include those risk factors that are listed in Sonic Automotive's Form 8-K filed on August 21, 2009. Cautionary Notice - Forward-Looking Statements |

| Third Quarter 2009 Earnings Review October 27, 2009 |

| Sonic Automotive Q3 2009 Quarter in Review Financial Review Operations Review Closing Comments |
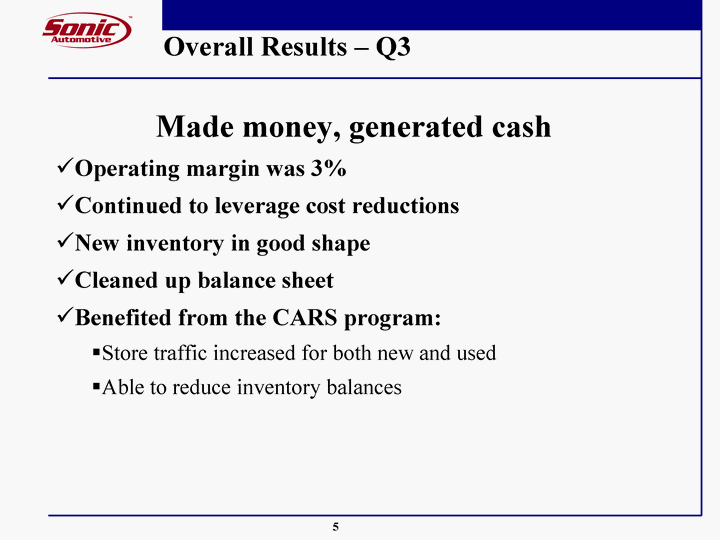
| Overall Results - Q3 Made money, generated cash Operating margin was 3% Continued to leverage cost reductions New inventory in good shape Cleaned up balance sheet Benefited from the CARS program: Store traffic increased for both new and used Able to reduce inventory balances |

| Financial Review Amounts in millions, except per share data * - In 2009, adjusted to exclude impairment charges, 6.0% Note derivative mark-to-market gain and 4.25% Notes derecognition gain. In 2008, adjusted to exclude impairment charges and hurricane physical damage and lease exit accruals. See appendix for reconciliation to GAAP / Reported amounts. |

| Sequential Operating Results * - Adjusted to exclude impairment charges, 6.0% Note derivative mark-to-market gains, restructuring costs related to 6.0% Notes issuance and 4.25% Notes derecognition gain. See appendix for reconciliation to GAAP / Reported amounts. |

| EBITDA - All Operations (amounts in millions) Stack 1 SAAR Column 3 Column 4 Column 5 Column 6 Column 7 Column 8 Column 9 Column 10 Column 11 Column 12 Column 13 Column 14 Column 15 Column 16 2007 241 16.2 2008 151 13.2 Q3 2008 38 12.9 Q4 2008 9 10.4 Q1 2009 36 9.5 Q2 2009 47 9.6 Q3 2009 53 11.5 Note: See appendix for reconciliation to GAAP / Reported amounts. |

| Q3 2008 Q2 2009 Q3 2009 All Other 0.694 0.662 0.657 Rent & Related 0.133 0.135 0.134 SG&A 79.7% 82.7% 79.1% Total SG&A expenses were down 5.0% or $10.9 million from the prior year Excluding rent, all other cost was down 370bps, on flat gross profit. Reductions were made in most cost categories * - Excludes the effect of $5.9M of charges in Q3 2008 related to hurricane physical damage and lease exit accruals. See appendix for reconciliation to GAAP / Reported amounts. * * |

| Capitalization Adjustments represent payment of 6.0% Notes at par on October 28, 2009, repayment of outstanding 4.25% Notes and amounts outstanding on the revolver with the balance in restricted cash. Excludes discount/premium and derivative adjustments. $152 Million reduction, or 20% from YE |
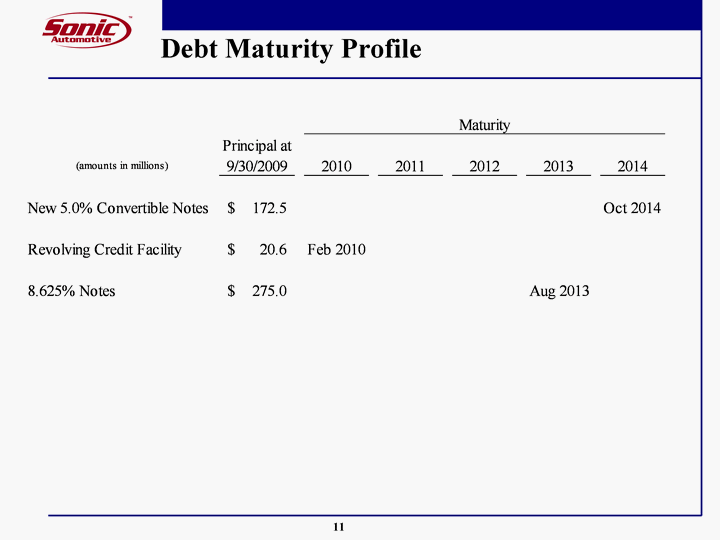
| Debt Maturity Profile |

| Debt Covenants Compliant with all covenants |

| Capital Spending (Amounts in millions) |

| Employee Metrics Dec Jan Feb Mar Apr May June Jul Aug Engagement 117 117 117 118 118 118 119 119 119 ASI 10/1/2008 11/1/2008 12/1/2008 1/1/2009 2/1/2009 3/1/2009 4/1/2009 5/1/2009 6/1/2009 7/1/2009 8/1/2009 9/1/2009 Turnover 0.527 0.505 0.508 0.484 0.467 0.449 0.432 0.414 0.398 0.382 0.362 0.353 Turnover Investments made in our people continue to yield positive results on our business Trained/experienced employees lead to higher customer satisfaction |
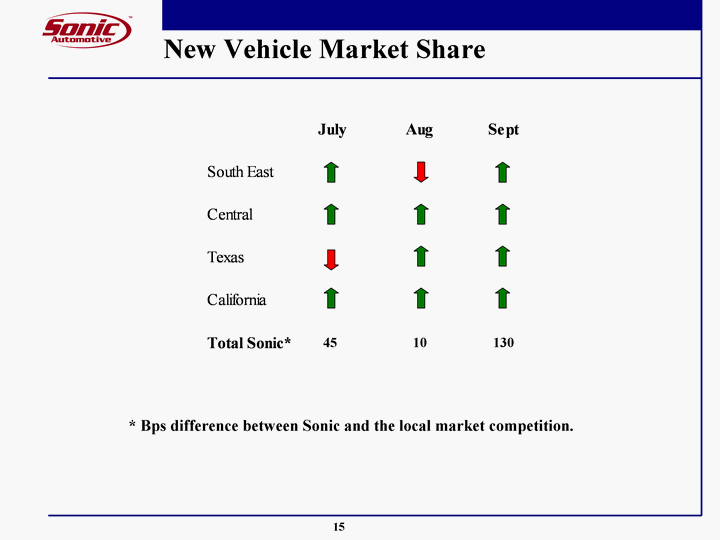
| New Vehicle Market Share * Bps difference between Sonic and the local market competition. 130 10 45 |

| Cash for Clunkers New volume benefited (non luxury) Used volume not impacted Cash For Clunkers represented approximately 28% of July and August new vehicle unit volume Program increased walk-in and online traffic Customers visited the store to learn more about the Cash For Clunkers program; as a result, they ended up buying something Cash for clunkers impact1 Ford Chevy Cadillac BMW/Mini Lexus Mercedes Honda Toyota Nissan VW Other CARS volume 314 402 1 386 124 2 2344 1282 333 117 594 CARS volume % total volume 0.252 0.271 0.002 0.13 0.132 0.002 0.417 0.368 0.614 0.201 0.226 AL/TN/GA NC/SC/FL Texas Midwest North Central Northern California Southern California CARS volume 789 542 1308 1099 1246 912 546 419 20 26 CARS volume % total volume 0.267 0.25 0.226 0.314 0.368 0.283 0.248 0.266 0.078 0.098 CARS unit volume CARS unit volume as % of total volume Ford Chevy BMW/ Mini Lexus Honda Toyota Nissan VW Other 1 In July and August 2009 |

| Used Vehicles |

| Fixed Operations Overview 100 bps Improvement |
| Summary Business has steadily improved despite a relatively flat operating environment Used business continues to grow Successfully repositioned our balance sheet Company is positioned for future growth |

| APPENDIX |

| Reconciliation of Non-GAAP Financial Information |

| Reconciliation of Non-GAAP Financial Information |

| Reconciliation of Non-GAAP Financial Information |

| Reconciliation of Non-GAAP Financial Information |

| Reconciliation of Non-GAAP Financial Information |
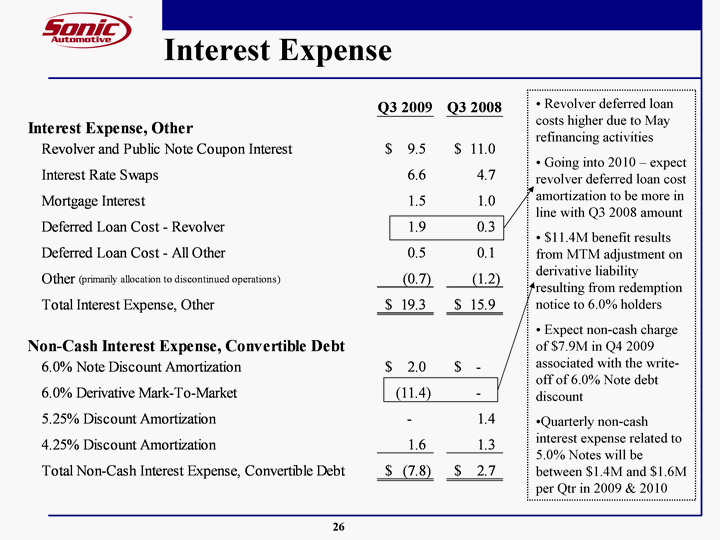
| Interest Expense Revolver deferred loan costs higher due to May refinancing activities Going into 2010 - expect revolver deferred loan cost amortization to be more in line with Q3 2008 amount $11.4M benefit results from MTM adjustment on derivative liability resulting from redemption notice to 6.0% holders Expect non-cash charge of $7.9M in Q4 2009 associated with the write- off of 6.0% Note debt discount Quarterly non-cash interest expense related to 5.0% Notes will be between $1.4M and $1.6M per Qtr in 2009 & 2010 |
