Attached files
| file | filename |
|---|---|
| 8-K - FORM 8-K - PECO ENERGY CO | d8k.htm |
| EX-99.1 - PRESS RELEASE AND EARNINGS RELEASE ATTACHMENTS - PECO ENERGY CO | dex991.htm |
 Earnings Conference Call • 3 rd Quarter 2009 October 23, 2009 Exhibit 99.2 |
 2 Forward-Looking Statements This presentation includes forward-looking statements within the meaning of the Private Securities Litigation Reform Act of 1995, that are subject to risks and uncertainties. The factors
that could cause actual results to differ materially from these forward-looking statements
include those discussed herein as well as those discussed in (1) Exelon’s 2008 Annual Report
on Form 10-K in (a) ITEM 1A. Risk Factors, (b) ITEM 7. Management’s Discussion and
Analysis of Financial Condition and Results of Operations and (c) ITEM 8. Financial Statements
and Supplementary Data: Note 18; (2) Exelon’s Third Quarter 2009 Quarterly Report on Form
10-Q (to be filed on October 23, 2009) in (a) Part II, Other Information, ITEM 1A. Risk
Factors and (b) Part I, Financial Information, ITEM 1. Financial Statements: Note 14 and (3) other
factors discussed in filings with the Securities and Exchange Commission (SEC) by Exelon
Corporation, Commonwealth Edison Company, PECO Energy Company and Exelon Generation Company,
LLC (Companies). Readers are cautioned not to place undue reliance on these forward-looking
statements, which apply only as of the date of this presentation. None of the Companies
undertakes any obligation to publicly release any revision to its forward-looking statements to
reflect events or circumstances after the date of this presentation. This presentation includes references to adjusted (non-GAAP) operating earnings and non-GAAP
cash flows that exclude the impact of certain factors. We believe that these adjusted operating
earnings and cash flows are representative of the underlying operational results of the Companies. Please refer to the attachments to the earnings release and the appendix to this presentation for a reconciliation of adjusted (non-GAAP) operating earnings to GAAP earnings.
Please refer to the footnotes of the following slides for a reconciliation non-GAAP cash
flows to GAAP cash flows. |
 3 Q3 Highlights Financial: • Delivering consistent operating performance • Exceeding 2009 cost savings target • Narrowing 2009 EPS guidance range Energy Markets: • Second PECO procurement completed • Illinois Power Agency procurement plan proposed Regulatory: • Focus on improved results for ComEd and PECO • Filed plans for Smart Grid and Smart Meter investments • Successful relicensing of TMI nuclear unit Climate Change: • Advocating for greenhouse gas-reduction legislation • Collaboration among industry and other key stakeholders |
 4 Key Financial Messages Q3 operating results of $0.96/share driven by: • Cost discipline – exceeded 2009 cost savings target with over $80 million of savings in third quarter • 94.7% nuclear capacity factor • Cooler than normal weather of $0.04/share at ComEd and $0.03/share at PECO Narrowing 2009 operating earnings guidance to $4.00-$4.10/share • Committed to an additional $100 million of one-time O&M savings in 2009
Well-positioned for continued financial strength and flexibility • Increased 2009 forecasted cash flow from operations (1) to $5.6 billion for 2009 - $850 million higher than original plan • $350 million discretionary pension contribution • $1.5 billion tender/make whole and refinancing at Exelon and Exelon Generation Refer to Earnings Release Attachments for additional details and to the Appendix for a reconciliation of adjusted (non-GAAP) operating EPS to GAAP EPS. (1) Cash Flow from Operations primarily includes net cash flows provided by operating
activities (excluding counterparty collateral activity) and net cash flows used in investing activities other than capital expenditures. Note: Data contained on this slide is rounded. |
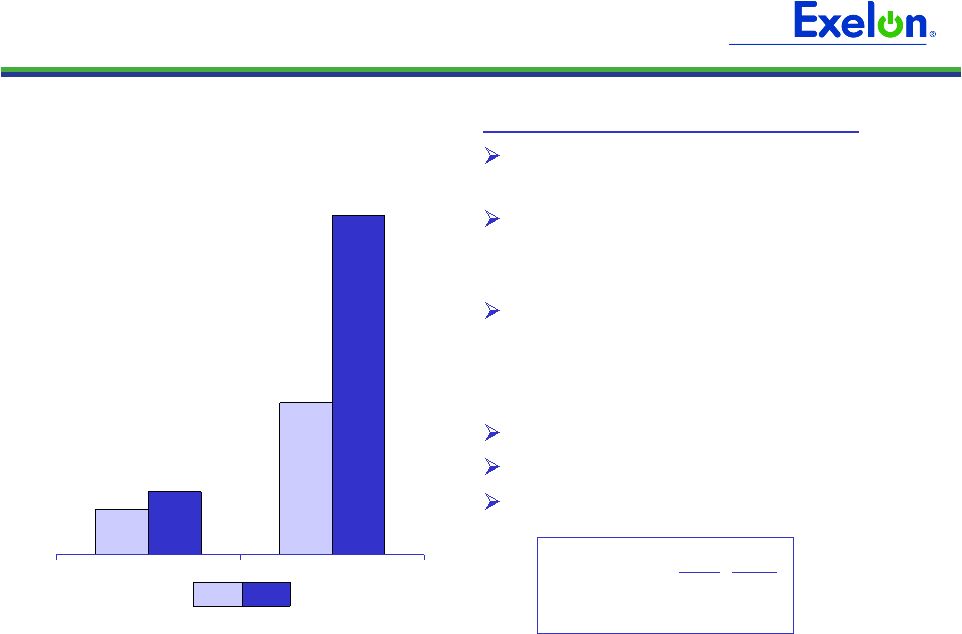
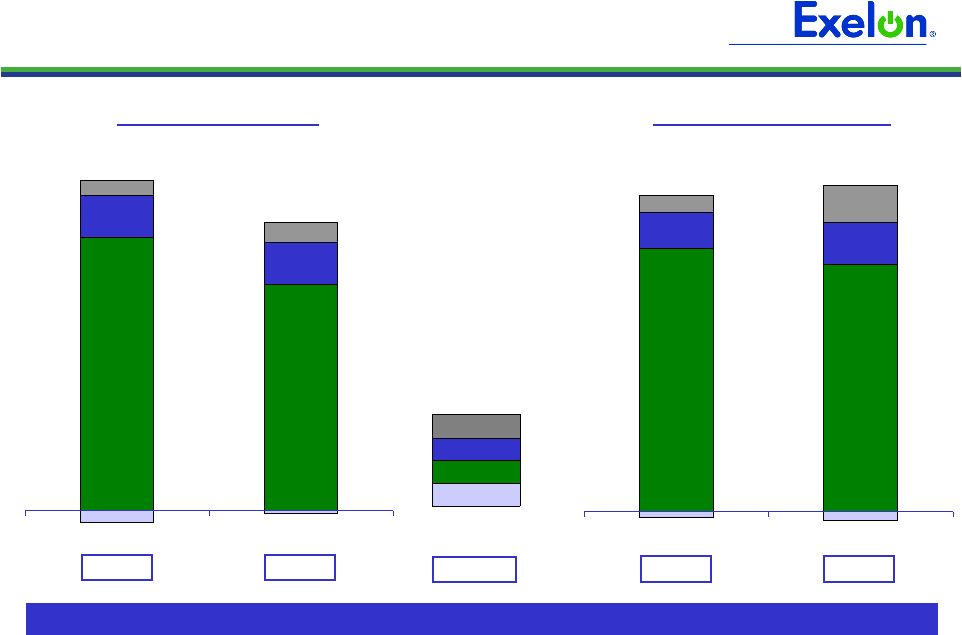 5 $0.92 $0.14 $0.76 $0.14 $0.05 $0.07 2008 2009 Operating EPS $2.66 $0.37 $2.50 $0.42 $0.17 $0.38 2008 2009 HoldCo/Other ExGen PECO ComEd 3 rd Quarter (Q3) (1) Exceeding cost savings target allowed Exelon to deliver results within our range
(1) Refer to Earnings Release Attachments for additional details and to the
Appendix for a reconciliation of adjusted (non-GAAP) operating EPS to GAAP EPS. $1.06 $1.14 GAAP EPS Year-to-Date (YTD) (1) $3.19 $3.13 $3.06 $3.21 $0.96 $1.07 |
 6 Exelon
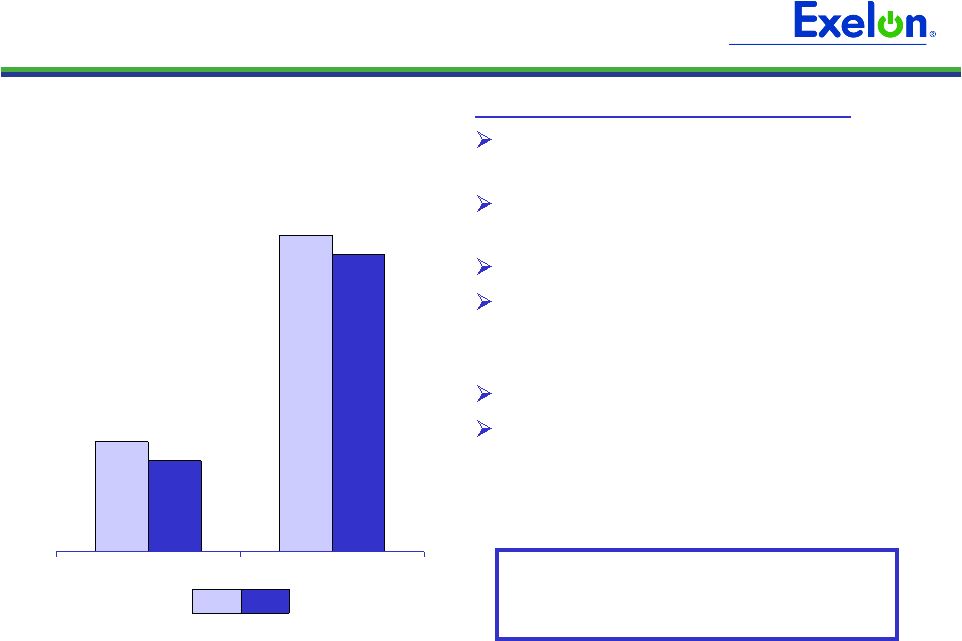
Generation Operating EPS Contribution 2009 2008 Key Drivers – Q3 ’09 vs. Q3 ’08 (1) Unfavorable portfolio/market conditions: $(0.06) Lower nuclear volume and higher nuclear fuel costs: $(0.04) Higher income tax expense: $(0.04) Higher costs due to pension and OPEB expense and refueling outages, partially offset by cost savings initiatives: $(0.02) Reversal of Q1 IL tax ruling: $(0.01) ’08 reserve associated with Lehman bankruptcy: +$0.02 (1) Refer to the Earnings Release Attachments for additional details and to the Appendix
for a reconciliation of adjusted (non-GAAP) operating EPS to GAAP EPS (2) Outage days exclude Salem. 36 17 Refueling 21 8 Non-refueling Q3 2009 Q3 2008 Outage Days (2) 3Q YTD $0.92 $0.76 $2.50 $2.66 |
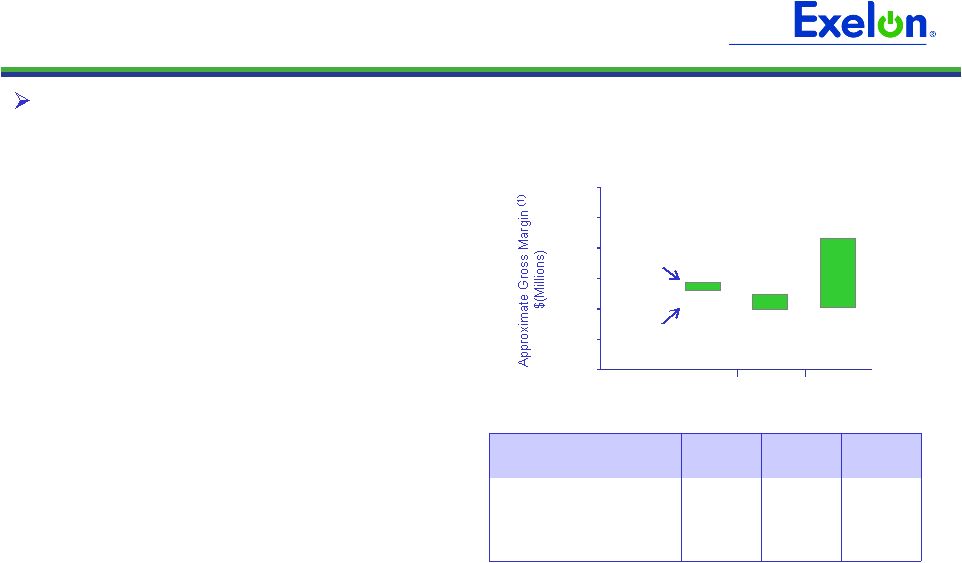 7 Represents an approximate range of expected gross margin, taking into account hedges in place, between the
5th and 95th percentile confidence levels. Approximate gross margin ranges are based upon
an internal simulation model and are subject to change based upon market inputs, future transactions and potential modeling changes. These ranges of approximate gross margin in 2010 and 2011 do not represent earnings guidance or a forecast of future
results as Exelon has not completed its planning or optimization processes for those years.
The price distributions that generate this range are calibrated to market quotes for power, fuel, load following products and options as of September 30, 2009. Percent of expected generation hedged represents how many equivalent MW have been hedged at forward market
prices as of September 30, 2009; all hedge products used are converted to an equivalent
average MW volume and the calculation considers whether hedges are power sales or financial products. Hedging Update The primary objective of Exelon’s hedging program is to manage market risks and
protect the value of our generation and investment-grade balance sheet
while preserving our ability to participate in improving long-term
market fundamentals • We typically follow a 36-month ratable hedging program • As we execute our hedging program, our percent of expected generation hedged increases and our potential range of earnings outcomes narrows as we move closer to the delivery year 2009 2010 2011 Percentage of Expected Generation Hedged (2) 98-100% 88-91% 63-66% Midwest 98-100 88-91 67-70 Mid-Atlantic 97-99 91-94 56-59 South 98-100 90-93 52-55 • We employ natural gas and power put options within the portfolio to allow us to reduce market risk while preserving upside potential 95% case 5% case $6,700 $6,600 $6,100 $6,500 $6,000 $8,200 $4,000 $5,000 $6,000 $7,000 $8,000 $9,000 $10,000 2009 2010 2011 (1) (2) |
 8 Key Drivers – Q3 ’09 vs. Q3 ’08 (1) Higher electric distribution rates: +$0.06 Net impact of 2008 write-offs associated with final distribution rate order: +$0.02 Lower O&M due to cost savings initiatives and decreased storm costs partially offset by higher pension and OPEB expense and inflation: +$0.01 Reversal of Q1 IL tax ruling: $(0.05) Weather: $(0.03) Reduced load: $(0.01) ComEd Operating EPS Contribution (1) Refer to the Earnings Release Attachments for additional details and to the Appendix
for a reconciliation of adjusted (non-GAAP) operating EPS to GAAP EPS 2009 2008 3Q YTD $0.05 $0.07 $0.38 $0.17 Q3 Actual Normal Days >90 degrees 1 11 Cooling Degree Days 412 624 |
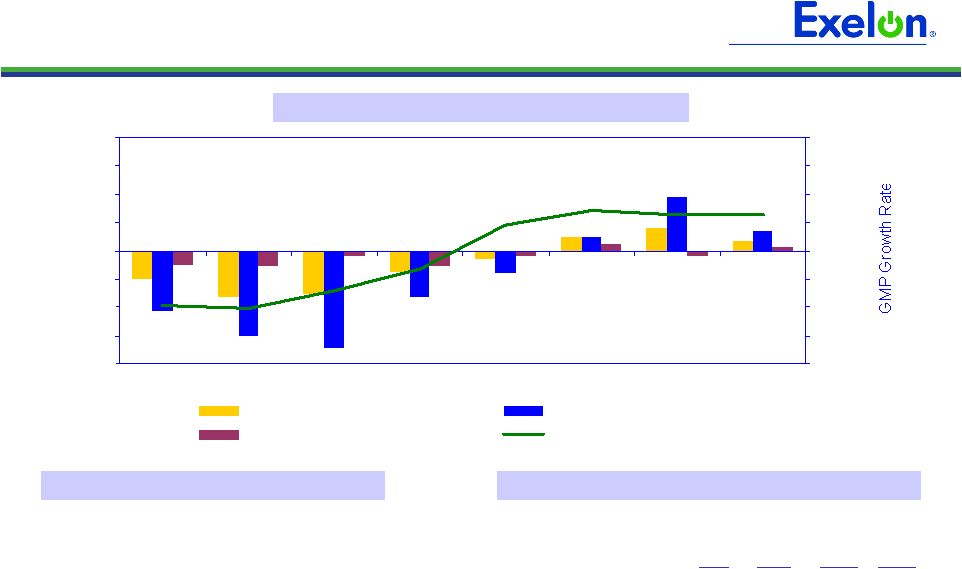 9 -10.0% -7.5% -5.0% -2.5% 0.0% 2.5% 5.0% 7.5% 10.0% 09Q1 09Q2 09Q3 09Q4E 10Q1E 10Q2E 10Q3E 10Q4E -10.0% -7.5% -5.0% -2.5% 0.0% 2.5% 5.0% 7.5% 10.0% All Customer Classes Large C&I Residential Gross Metro Product (right axis) ComEd Load Trends Weather-Normalized Load Key Economic Indicators Note: C&I = Commercial & Industrial Weather-Normalized Load Year-over-Year (4) Chicago U.S. Unemployment rate (1) 10.5% 9.8% 2009 annualized growth in gross domestic/metro product (2) (3.7)% (2.6)% 7/09 Home price index (3) (14.2)% (13.3)% (1) Source: Illinois Dept. of Employment Security (October 2009) and U.S.
Dept. of Labor (October 2009) (2) Source: Moody’s Economy.com (September 2009) (3) Source: S&P Case-Shiller Index (4) Not adjusted for leap year effect Q309 Q409E 2009E (4) 2010E Customer Growth (0.5)% (0.6)% (0.4)% 0.1% Average Use-Per-Customer 0.1% (0.7)% (0.9)% (0.1)% Total Residential (0.4)% (1.3)% (1.3)% 0.0% Small C&I (2.9)% (0.8)% (2.4)% 1.0% Large C&I (8.6)% (4.1)% (6.7)% 1.5% All Customer Classes (3.8)% (1.9)% (3.4)% 0.8% |
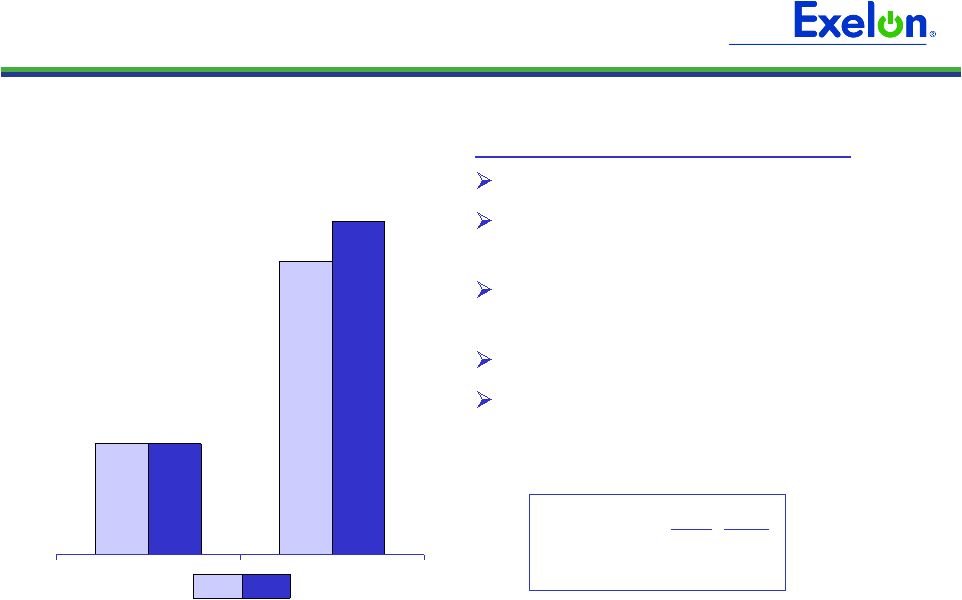 10 PECO Operating EPS Contribution Key Drivers – Q3 ’09 vs. Q3 ’08 (1) Lower bad debt expense: +$0.04 Higher other revenue net fuel, including gas distribution revenues: +$0.02 Competitive Transition Charge (CTC) amortization: $(0.03) Reduced load: $(0.03) Weather: $(0.01) 2009 2008 (1) Refer to the Earnings Release Attachments for additional details and to the Appendix
for a reconciliation of adjusted (non-GAAP) operating EPS to GAAP EPS. 3Q YTD $0.14 $0.14 $0.42 $0.37 Q3 Actual Normal Days >90 degrees 6 18 Cooling Degree Days 884 939 |
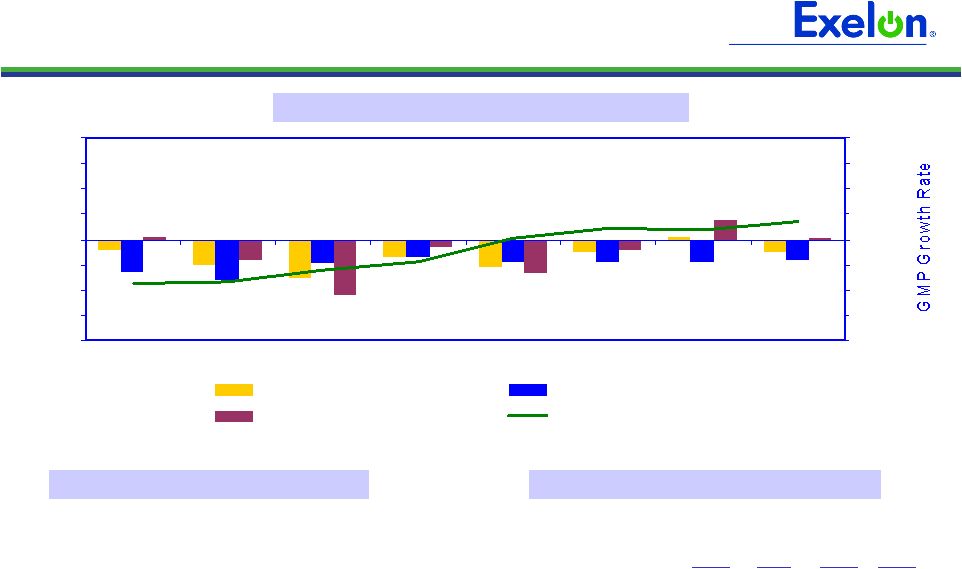 11 PECO Load Trends Weather-Normalized Electric Load Key Economic Indicators Weather-Normalized Load Year-over-Year (3) Philadelphia U.S. Unemployment rate (1) 8.5%
9.8% 2009 annualized growth in gross domestic/metro product (2) (3.4)%
(2.6)% (1) Source: U.S Dept. of Labor (PHL August 2009, US – October 2009) (2) Source: Moody’s Economy.com (September 2009) (3) Not adjusted for leap year effect -10.0% -7.5% -5.0% -2.5% 0.0% 2.5% 5.0% 7.5% 10.0% 09Q1 09Q2 09Q3 09Q4E 10Q1E 10Q2E 10Q3E 10Q4E -10.0% -7.5% -5.0% -2.5% 0.0% 2.5% 5.0% 7.5% 10.0% All Customer Classes Large C&I Residential Gross Metro Product (right axis) Note: C&I = Commercial & Industrial Q309 Q409E 2009E (3) 2010E Customer Growth (0.4)% (0.4)% (0.3)% (0.0)% Average Use-Per-Customer (5.1)% (0.4)% (2.2)% (0.5)% Total Residential (5.5)% (0.8)% (2.5)% (0.6)% Small C&I (5.1)% (3.4)% (2.7)% (0.8)% Large C&I (2.2)% (1.7)% (3.0)% (2.3)% All Customer Classes (3.9)% (1.8)% (2.7)% (1.3)% |
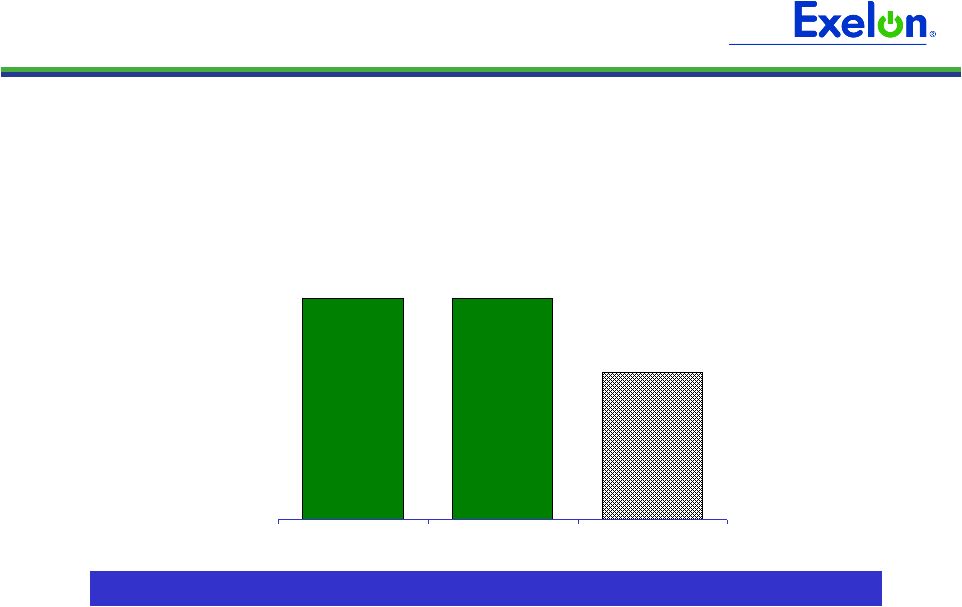 12 Delivering on Cost Savings Commitments • On track to exceed promised cost savings in 2009 – Identified $100 million of additional one-time cost saving opportunities for 2009 Projected to exceed cost management goal in 2009 by $100 million Note: Data contained on this slide is rounded. $4.5B (2)(3) $4.5B (2) $4.4B (2)(3) (1) Reflects operating O&M data and excludes decommissioning effect. ComEd and PECO operating
O&M exclude energy efficiency costs recoverable under a rider. (2) Exelon
Consolidated includes operating O&M expense from Holding Company. (3) Reflects ~$175
million increase in operating O&M expense from 2008A to 2009E due to higher pension and OPEB expense. O&M Expense (1) 2008A 2009 Original Commitment 2009 Revised Forecast |
 13 Financial Flexibility Increased Future Cash Flexibility Lowered Cost of Debt In the third quarter, Exelon capitalized on strategic opportunities to create future financial flexibility • $350 million discretionary 2008 pension contribution • Lowered estimated 2011 contribution by $1 billion • Smoothing election (1) lowers volatility in future contributions • Used cash on hand • Successfully executed $1.5 billion tender/make whole and refinancing • Expected to lower annual interest expense by approximately $12 million • Extended average maturity of Generation/Corporate debt portfolio by 6.6 years (1) Contributions reflect the impact of electing the option to smooth asset returns provided
under the Worker, Retiree and Employer Recovery Act of 2008, which allows the use of average assets, including expected returns (subject to certain limitations) for a 24-month period prior to the measurement date, in the determination of funding requirements. |
 14 Appendix |
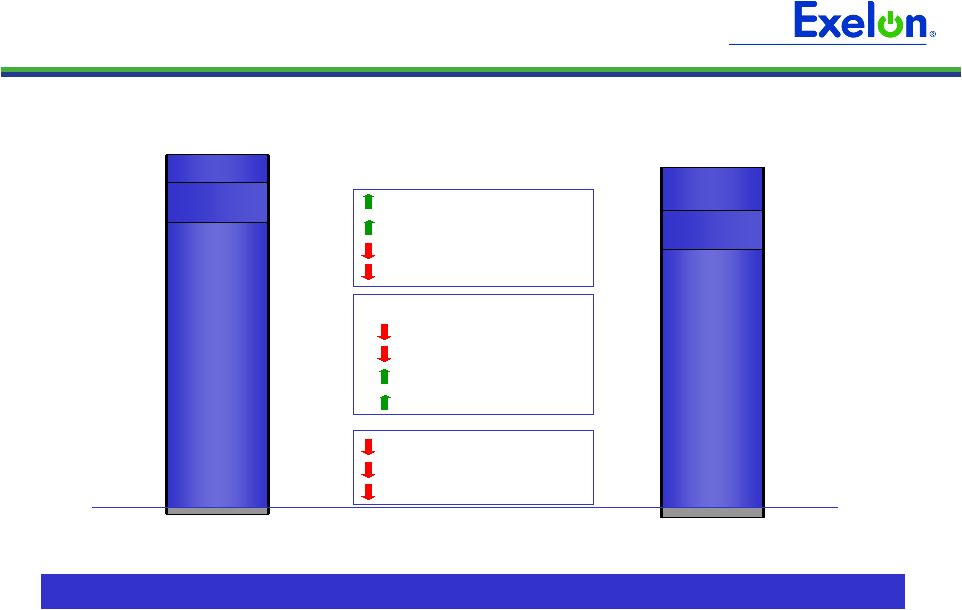    15 2009 Operating Earnings Guidance 2009E 2008A $0.49 $3.46 $4.20 ComEd PECO Exelon Generation 2009 Earnings Drivers ComEd PECO Exelon Generation Holdco Holdco Exelon $0.33 Exelon $4.00 - $4.10 (1) $0.50 - $0.55 $0.45 - $0.50 $3.10 - $3.15 (1) Adjusted (non-GAAP) Operating Earnings Guidance. Excludes the earnings effect of certain items as disclosed in the Appendix. Note: A = Actual; E = Estimate Narrowing 2009 operating earnings guidance to $4.00-$4.10/share (1) O&M and other Pension/OPEB Inflation Cost reduction initiatives Bad debt expense ComEd distribution revenue PECO gas revenue Weather Load Nuclear fuel costs Depreciation and amortization PECO CTC |
 16 ComEd Smart Grid/Smart Meter • Smart Meter (or Advanced Metering Infrastructure - AMI) Pilot – ICC approved on October 14, 2009 – 1-year pilot program for 131,000 smart meters and related programs (~$70 million in 2009-2010) – Recovery with regulated return for capital investment expected to begin in 2010 through
a rider • Federal Stimulus Funding – Request for $175 million in matching funds made on August 4, 2009 – Investment would occur through 2011 Projected Spend $ millions $350 $23 $78 $107 $139 Total $92 $6 -- $84 -- Transmission $78 Distribution Automation $23 Communication Support Systems $139 AMI & Customer Applications $258 $17 Distribution TOTAL Intelligent Substation Project Note: Totals may not add due to rounding. ComEd includes approximately $4 million
of unallocated contract expense that will be distributed to specific
projects upon finalization of scope. ComEd’s Smart Grid project expands
the AMI pilot and provides for regulated returns on our investments
|
 17 PECO Smart Grid/Smart Meter • PECO intends to invest up to $650 million in its Smart Grid/Smart Meter Infrastructure (1) – $550 million Advanced Metering Infrastructure over 10 – 15 years – $100 million for Smart Grid over 3 years subject to stimulus funding • Federal Stimulus Grant application for $200 million of matching funds filed August 6,
2009 – Amount and timing of spend will depend on approval of Federal Stimulus Grant and supplier RFPs • Smart Meter investment required by Act 129, which provides for recovery through
surcharge including a return on capital investment • Smart Grid investment to be recovered through transmission and distribution rates
($ millions pre-tax) 2010 2011 2012 Total Act 129 Smart Meter Deployment (over 10-15 years) 45 $ 125 $ 45 $ 215 $ Smart Grid Base Case 15 20 15 50 60 $ 145 $ 60 $ 265 $ ($ millions pre-tax) 2010 2011 2012 Total Act 129 Smart Meter Expanded Initial Deployment (600K meters by 2012) 40 $ 150 $ 100 $ 290 $ Smart Grid Stimulus Case 50 45 15 110 Total Stimulus Case 90 195 115 400 Stimulus Grant Request (45) (100) (55) (200) Total Expenditures net of Stimulus grant 45 $ 95 $ 60 $ 200 $ (1) Does not include $100 million for potential replacement of gas meters and
wind-down of legacy Automated Meter Reading system. (2) Amounts included
in base case assumptions for capital spend. (3) Assumes 100% of matching
funds requested by DOE. Data contained in this slide is rounded 2010-2012 Spend Without Federal Stimulus Grant (2) : 2010-2012 Spend With Federal Stimulus Grant (3) : |
 18 Illinois Power Agency RFP Procurement • On September 30, 2009, the IPA submitted an Updated Procurement Plan for the 2010/11 planning period • Similar to 2009, the Procurement Plan for the 2010/11 planning period includes the
procurement of monthly peak and off-peak standard wholesale block energy
products • The IPA’s Plan also calls for the procurement of 1,887,014 MWh of Renewable Energy
Credits NOTE: Chart is for illustrative purposes only. Data on this slide is rounded
Next RFP to be held in Spring 2010 Delivery Period Peak Off-Peak June 2010 - May 2011 5,390 4,538 June 2011 - May 2012 1,858 668 Volumes to be secured in 2010 IPA Procurement Event (GWh) 2009 RFP 2009 RFP 2010 RFP 2010 RFP 2011 RFP 2011 RFP 2012 RFP 2009 2010 2011 2012 Financial Swap Auction Contract |
 19 PECO Procurement Results PECO has completed two of the four procurements for the power needed to serve its
residential customers beginning in 2011 • On September 23, 2009, the PAPUC approved the bids from PECO’s second RFP
(1) See PECO Procurement website (http://www.pecoprocurement.com) for additional details
regarding PECO’s procurement plan and RFP results. (2) Wholesale prices; no Small/Medium Commercial products were procured in the June
RFP. Residential Sept RFP average price of $79.96/MWh (2) June RFP average price of $88.61/MWh (2) 49% of full requirements product procured 80 MW of block energy procured Small and Medium Commercial Sept RFP average blended price of $85.85/MWh (2) 24% of Small Commercial full requirements product procured 16% of Medium Commercial full requirements product procured 85% full requirements 15% full requirements spot Medium Commercial & Industrial (peak demand >100 kW but <= 500 kW) 100% full requirements spot Large Commercial & Industrial (peak demand >500 kW) 90% full requirements 10% full requirements spot 75% full requirements 20% block energy 5% energy only spot Products Small Commercial (peak demand <100 kW) Residential Customer Class PECO Procurement Plan (1) Total Procured (including June and September RFPs) Residential 23% of planned full requirements contracts (17 and 29-mo terms) 140 MW of baseload (24x7) block energy products (12, 24 and 60-mo duration) 40 MW of Jan-Feb 2011 on-peak block energy Small Commercial 36% of planned full requirements contracts (17 and 29-mo term) Medium Commercial & Industrial 42% of planned full requirements contracts (17-mo term) May 24, 2010 RFP |
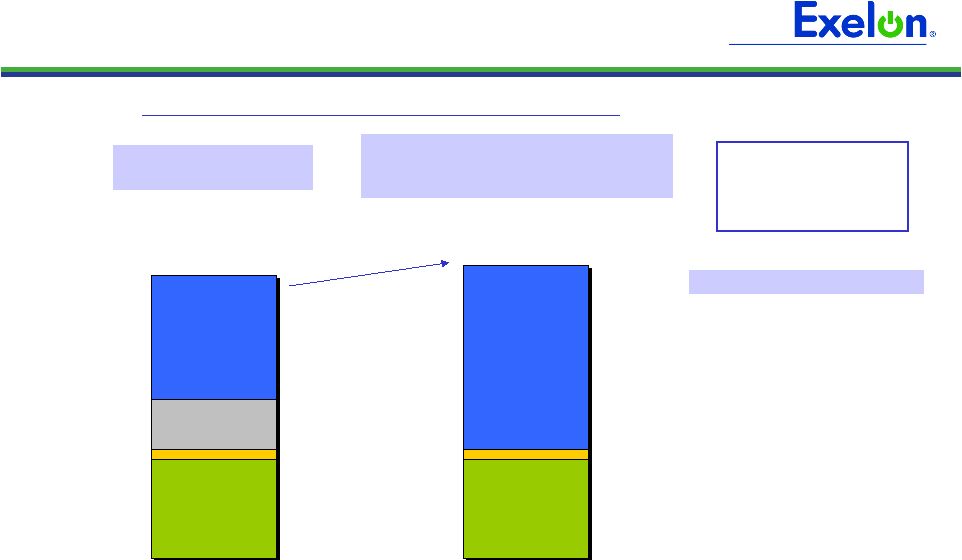 20 5.03 5.03 0.51 0.51 6.26 2.57 9.41 PECO Average Residential Electric Rates (1) Average of PECO’s residential rates. (2) Provided for illustration only. Represents 49% of PECO’s full requirements
residential procurement for 2011. (3) Average wholesale price for full requirements products. Full requirements product
includes load following energy, capacity, ancillary transmission services and Alternative Energy Portfolio Standard requirements. (4) Does not include energy efficiency or changes in distribution rates. 2011 2010 Energy / Capacity Competitive Transition Charge (CTC) Transmission Distribution 14.37¢ (1) Unit Rates (¢/kWh) Electric Restructuring Settlement ~4% (4) 14.95¢ (1) Assumptions Illustrative Rate Increase Based on Average PECO Residential Full Requirements Procurement Results (2) • 2011 illustrative residential rate based on Spring and Fall 2009 RFPs full requirements product prices • Actual 2011 default service residential rate will reflect associated full requirements costs, block energy costs, and spot market purchases, all of which will be acquired through multiple procurements • Rates will vary by customer class • Retail rate components include line losses and gross receipts taxes Spring 2009 $88.61 / MWH PECO Residential Procurement Results (3) Effect of Spring and Fall 2009 Procurements Fall 2009 $79.96 / MWH Wholesale Results |
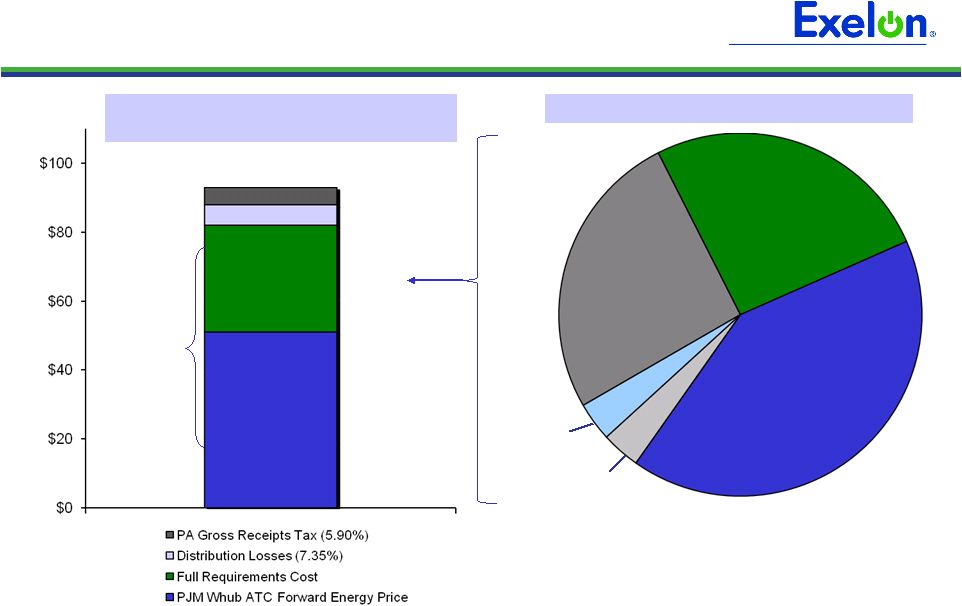 21 Estimated Build-Up of PECO Average Residential Full Requirements Price $91.60/MWh $28.50- $29.50 $50.50 - $51.50 Full Requirements Costs ($/MWh) Average Full
Requirements Retail Sales Price (1) Load Shape & Ancillary Services $7.50 Capacity $12.00 Transmission & Congestion $7.00 - $8.00 Renewable Energy Credits $1.00 Migration, Volumetric Risk & Other $1.00 ~$6.50 ~$5.50 Average Wholesale Energy Price $79.96 (2) 21 (1) As provided by Exelon Generation (2) On Oct 21, 2009 the Independent Evaluator (NERA) announced a wholesale winning bid average price of
$79.96/MWh for PECO’s Fall 2009 RFP (reflecting 17 & 29-month residential full requirements’ products with delivery beginning Jan 1, 2011).
|
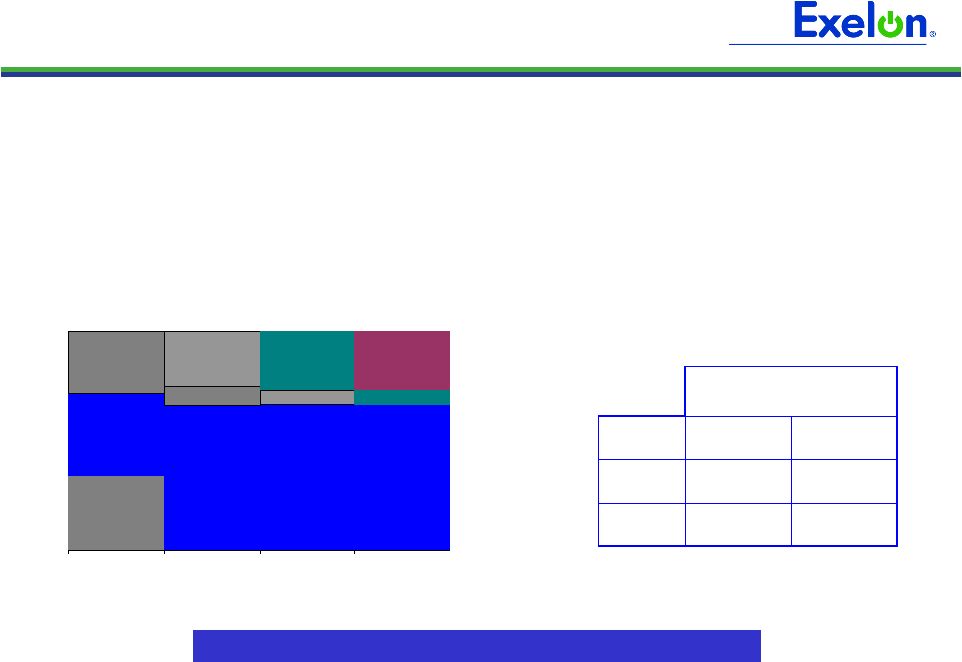
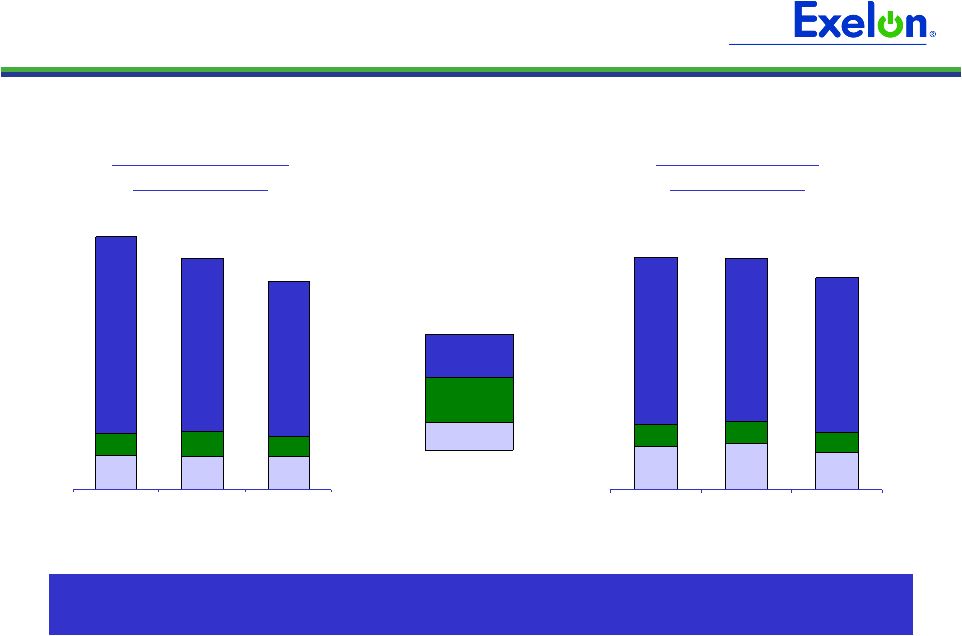 22 Q3 07 Q3 08 Q3 09 ComEd and PECO Accounts Receivable ComEd Accounts Receivable (1) Through the third quarter of 2009, both ComEd and PECO have experienced an improvement in accounts receivable aging Q3 07 Q3 08 Q3 09 PECO Accounts Receivable (1) % of AR $862M $710M $789M $782M $779M $714M (1) Accounts receivable amounts include unbilled receivables and are gross
of allowance for uncollectible accounts at ComEd and PECO and long-term receivables at PECO. >60 days 31-60 days 0-30 days Note: Data contained on this slide is rounded. |
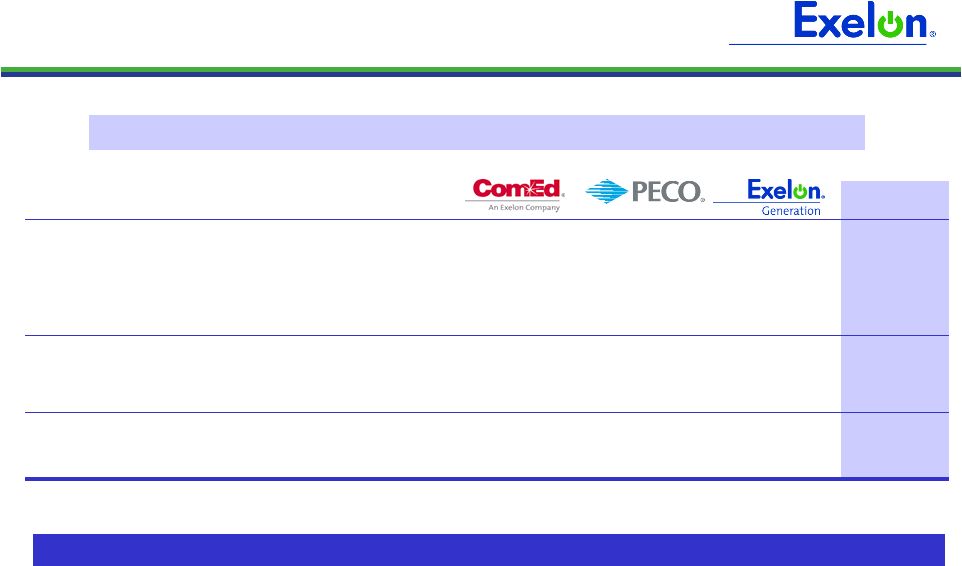
 23 23 2009 Projected Sources and Uses of Cash (250) n/a (50) (200) Utility Growth CapEx (4) (925) (925) n/a n/a Nuclear Fuel (200) (200) n/a n/a Nuclear Uprates and Solar Project (1,400) Dividend (3) $ (in millions) Exelon (8) Beginning Cash Balance (1) $500 Cash Flow from Operations (1)(2) 1,125 1,000 3,400 5,600 CapEx (excluding Nuclear Fuel, Nuclear Uprates and Solar Project, Utility Growth CapEx) (675) (350) (925) (2,000) Net Financing (excluding Dividend): Planned Debt Issuances (5) 0 250 1,500 1,750 Planned Debt Retirements (6) 0 (750) (1,000) (2,250) Other (7) 50 250 50 (100) Ending Cash Balance (1) $725 Note: Data contained on this slide is rounded. (1) Excludes counterparty collateral activity. (2) Cash Flow from Operations primarily includes net cash flows provided by operating activities and net cash
flows used in investing activities other than capital expenditures. Cash Flow from Operations
reflects the $350M pre-tax discretionary pension contribution. Cash Flow from Operations for PECO and Exelon includes $500M for Competitive Transition Charges. (3) Assumes 2009 Dividend of $2.10 per share. Dividends are subject to
declaration by the Board of Directors. (4) Represents new business and smart grid/meter investment. (5) Excludes ComEd tax-exempt bonds that are backed by letters of credit (LOCs). ComEd reissued
$191M of tax exempt debt in May backed by LOCs. Excludes PECO’s Accounts Receivable
(A/R) Agreement with Bank of Tokyo. (6) Planned Debt Retirements at ComEd and Exelon Corporate are $17M and $500M, respectively. Includes
securitized debt at PECO and $307M repurchase of tax exempt debt at Exelon Generation.
(7) “Other” includes PECO Parent Receivable, proceeds from options and expected changes in
short-term debt. (8) Includes cash flow activity from Holding Company, eliminations, and other corporate entities.
|
 24 Sufficient Liquidity (1) Excludes previous commitment from Lehman Brothers Bank and excludes $66
million of bank commitments from Exelon’s Community and Minority Bank Credit Facility. (2) Available Capacity Under Facilities represents the unused bank commitments
under the borrower’s credit agreements net of outstanding letters of credit and facility draws. The amount of commercial paper outstanding does not reduce the available
capacity under the credit agreements. (3) Includes other corporate
entities. (35) -- -- (35) Outstanding Facility Draws (409) (154) (10) (241) Outstanding Letters of Credit $7,317 $4,834 $574 $952 Aggregate Bank Commitments (1) 6,873 4,680 564 676 Available Capacity Under Facilities (2) -- -- -- -- Outstanding Commercial Paper $6,873 $4,680 $564 $676 Available Capacity Less Outstanding Commercial Paper Exelon (3) ($ in Millions) Exelon has no commercial paper outstanding and its bank facilities are largely
untapped Available Capacity Under Bank Facilities as of October 15, 2009
|
 25 Projected 2009 Key Credit Measures BBB A- A- BBB- S&P Credit Ratings (3) BBB+ A BBB BBB+ Fitch Credit Ratings (3) A3 A2 Baa1 Baa1 Moody’s Credit Ratings (3) 4.5x 4.5x FFO / Interest ComEd: 23% 17% FFO / Debt 42% 49% Rating Agency Debt Ratio 3.4x 3.2x FFO / Interest PECO: 14% 12% FFO / Debt 48% 53% Rating Agency Debt Ratio 30% 50% Rating Agency Debt Ratio 125% 55% FFO / Debt 36.5x 12.5x FFO / Interest Exelon Generation: 49% 43% 8.7x Without PPA & Pension / OPEB (2) 60% Rating Agency Debt Ratio 28% FFO / Debt 6.8x FFO / Interest Exelon Consolidated: With PPA & Pension / OPEB (1) Notes: Exelon and PECO metrics exclude securitization debt. See following slide for FFO (Funds from Operations)/Interest, FFO/Debt and Adjusted Book Debt Ratio reconciliations to GAAP. (1) FFO/Debt metrics include the following standard adjustments: imputed debt and
interest related to purchased power agreements (PPA), unfunded pension and other postretirement benefits (OPEB) obligations, capital adequacy for energy trading, operating lease
obligations, and other off-balance sheet debt. Debt is imputed for estimated pension and OPEB obligations by operating company. (2) Excludes items listed in note (1) above. (3) Current senior unsecured ratings for Exelon and Exelon Generation and senior secured
ratings for ComEd and PECO as of October 15, 2009. On August 3, 2009, Moody’s upgraded ComEd’s senior secured credit rating to Baa1 from Baa2 due to a change in Moody’s rating methodology. |
 26 FFO Calculation and Ratios FFO Calculation = FFO - PECO Transition Bond Principal Paydown + Gain on Sale, Extraordinary Items and Other Non-Cash Items (3) + Change in Deferred Taxes + Depreciation, amortization (including nucl fuel amortization), AFUDC/Cap. Interest Add back non-cash items: Net Income Adjusted Interest FFO + Adjusted Interest = Adjusted Interest + 7% of Present Value (PV) of Operating Leases + Interest on imputed debt related to PV of Purchased Power Agreements (PPA), unfunded Pension and Other Postretirement Benefits (OPEB) obligations, and Capital Adequacy for Energy Trading (2) , as applicable - PECO Transition Bond Interest Expense Net Interest Expense (Before AFUDC & Cap. Interest) FFO Interest Coverage + Capital Adequacy for Energy Trading (2) FFO = Adjusted Debt + PV of Operating Leases + 100% of PV of Purchased Power Agreements (2) + Unfunded Pension and OPEB obligations (2) + A/R Financing Add off-balance sheet debt equivalents: - PECO Transition Bond Principal Balance + STD + LTD Debt: Adjusted Debt (1) FFO Debt Coverage Rating Agency Capitalization Rating Agency Debt Total Adjusted Capitalization Adjusted Book Debt = Total Rating Agency Capitalization + Off-balance sheet debt equivalents (2) Total Adjusted Capitalization = Rating Agency Debt + Off-balance sheet debt equivalents (2) Adjusted Book Debt = Total Adjusted Capitalization + Adjusted Book Debt + Preferred Securities of Subsidiaries + Total Shareholders' Equity Capitalization: = Adjusted Book Debt - Transition Bond Principal Balance + STD + LTD Debt: Debt to Total Cap (1) Uses current year-end adjusted debt balance. (2) Metrics are calculated in presentation unadjusted and adjusted for debt equivalents and
related interest for PPAs, unfunded Pension and OPEB obligations, and Capital Adequacy for Energy Trading. (3) Reflects depreciation adjustment for PPAs and decommissioning interest income and
contributions. |
 27 Q3 GAAP EPS Reconciliation (0.02) - - - (0.02) 2007 Illinois electric rate settlement (0.09) (0.04) - - (0.05) Costs associated with early debt retirements 0.05 - - - 0.05 Nuclear decommissioning obligation reduction (0.01) (0.01) - - - NRG acquisition costs 0.13 - - - 0.13 Unrealized gains related to nuclear decommissioning trust funds 0.12 - - - 0.12 Mark-to-market adjustments from economic hedging activities $1.14 $(0.06) $0.14 $0.07 $0.99 Q3 2009 GAAP Earnings (Loss) Per Share $0.96 $(0.01) $0.14 $0.07 $0.76 2009 Adjusted (non-GAAP) Operating Earnings (Loss) Per Share Exelon Other PECO ComEd ExGen Three Months Ended September 30, 2009 (0.04) - - - (0.04) 2007 Illinois electric rate settlement 0.02 - - - 0.02 Nuclear decommissioning obligation reduction $1.06 $(0.09) $0.14 $0.05 $0.96 Q3 2008 GAAP Earnings (Loss) Per Share $1.07 $(0.04) $0.14 $0.05 $0.92 2008 Adjusted (non-GAAP) Operating Earnings (Loss) Per Share 0.10 (0.05) - - 0.15 Mark-to-market adjustments from economic hedging activities (0.09) - - - (0.09) Unrealized losses related to nuclear decommissioning trust funds Exelon Other PECO ComEd ExGen Three Months Ended September 30, 2008 NOTE: All amounts shown are per Exelon share and represent contributions to
Exelon's EPS. Amounts may not add due to rounding. |
 28 YTD GAAP EPS Reconciliation NOTE: All amounts shown are per Exelon share and represent contributions to
Exelon's EPS. Amounts may not add due to rounding. (0.18) - - (0.01) (0.17) 2007 Illinois electric rate settlement 0.02 - - - 0.02 Nuclear decommissioning obligation reduction $3.06 $(0.07) $0.37 $0.16 $2.60 YTD 2008 GAAP Earnings (Loss) Per Share $3.13 $(0.07) $0.37 $0.17 $2.66 2008 Adjusted (non-GAAP) Operating Earnings (Loss) Per Share 0.27 - - - 0.27 Mark-to-market adjustments from economic hedging activities (0.18) - - - (0.18) Unrealized losses related to nuclear decommissioning trust funds Exelon Other PECO ComEd ExGen Nine Months Ended September 30, 2008 (0.08) - - - (0.08) 2007 Illinois electric rate settlement (0.09) (0.04) - - (0.05) Costs associated with early debt retirements (0.20) - - - (0.20) Impairment of certain generating assets (0.03) - - (0.02) (0.01) 2009 severance charges 0.05 - - - 0.05 Nuclear decommissioning obligation reduction (0.03) (0.03) - - - NRG acquisition costs 0.18 - - - 0.18 Unrealized gains related to nuclear decommissioning trust funds 0.12 - - - 0.12 Mark-to-market adjustments from economic hedging activities 0.10 (0.02) - 0.06 0.06 Non-cash remeasurement of income tax uncertainties and reassessment of state deferred income taxes $3.21 $(0.19) $0.42 $0.42 $2.57 YTD 2009 GAAP Earnings (Loss) Per Share $3.19 $(0.10) $0.42 $0.38 $2.50 2009 Adjusted (non-GAAP) Operating Earnings (Loss) Per Share Exelon Other PECO ComEd ExGen Nine Months Ended September 30, 2009 |
 29 2009 Earnings Outlook • Exelon’s 2009 adjusted (non-GAAP) operating earnings outlook excludes the earnings effects of the following: • Mark-to-market adjustments from economic hedging activities • Unrealized gains and losses from nuclear decommissioning trust fund investments
primarily related to the Clinton, Oyster Creek, and Three Mile Island nuclear plants (the former AmerGen Energy Company, LLC units) • Any significant impairments of assets, including goodwill • Any changes in decommissioning obligation estimates • Costs associated with the 2007 Illinois electric rate settlement agreement, including ComEd’s previously announced customer rate relief programs • Costs associated with ComEd’s 2007 settlement with the City of Chicago • Costs incurred for employee severance related to the cost reduction program announced
in June 2009 • Costs associated with early debt retirements • External costs associated with the terminated offer to acquire NRG Energy, Inc.
• Non-cash remeasurement of income tax uncertainties and reassessment of state
deferred income taxes • Other unusual items • Significant future changes to GAAP • Operating earnings guidance assumes normal weather for the remainder of the year |
 30 Important Information The following slides are intended to provide additional information regarding the hedging program at Exelon Generation and to serve as an aid for the purposes of modeling Exelon Generation’s gross margin (operating revenues less purchased power and fuel expense). The information on the following slides is not intended to represent earnings guidance or a forecast of future events. In fact, many of the factors that ultimately will determine Exelon
Generation’s actual gross margin are based upon highly variable market factors outside of our
control. The information on the following slides is as of September 30, 2009. Exelon plans
to update these hedging disclosures on a quarterly basis. Certain information on the following slides is based upon an internal simulation model that incorporates assumptions regarding future market conditions, including power and commodity prices, heat rates, and demand conditions, in addition to operating performance and dispatch characteristics of our generating fleet. Our simulation model and the assumptions therein are subject to change. For example, actual market conditions and the dispatch profile of our generation fleet in future periods will likely differ – and may differ
significantly – from the assumptions underlying the simulation results included in the
slides. In addition, the forward-looking information included in the following slides
will likely change over time due to continued refinement of our simulation model and changes in
our views on future market conditions. |
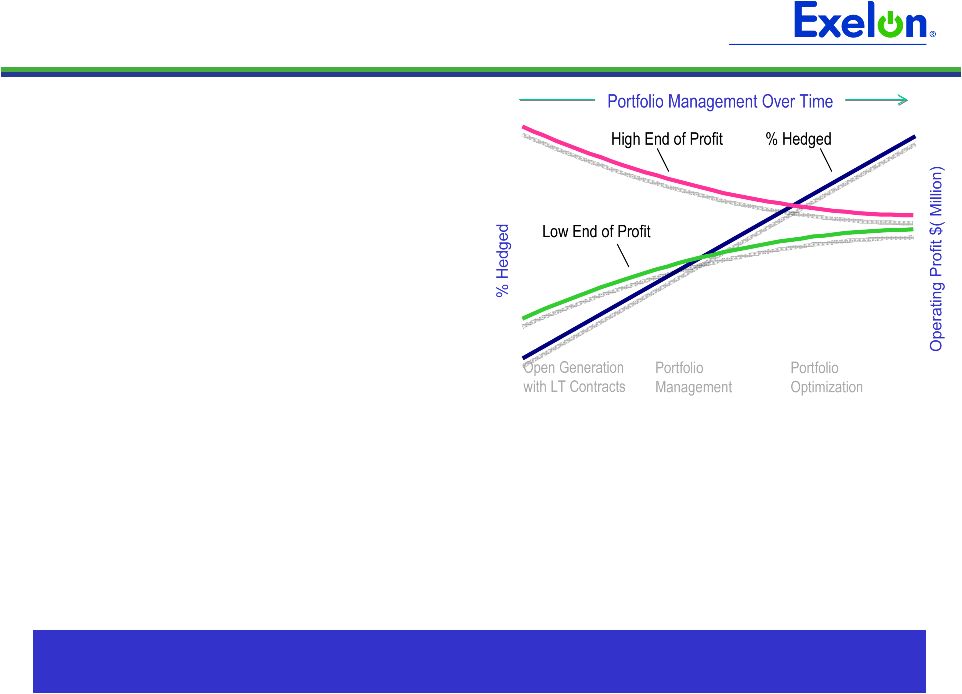 31 31 Portfolio Management Objective Align Hedging Activities with Financial Commitments • Power Team utilizes several product types and channels to market • Wholesale and retail sales • Block products • Load-following products and load auctions • Put/call options • Exelon’s hedging program is designed to protect the long-term value of our generating fleet and maintain an investment-grade balance sheet • Hedge enough commodity risk to meet future cash requirements if prices drop • Consider: financing policy (credit rating objectives, capital structure, liquidity); spending (capital and O&M); shareholder value return policy • Consider market, credit, operational risk • Approach to managing volatility • Increase hedging as delivery approaches • Have enough supply to meet peak load • Purchase fossil fuels as power is sold • Choose hedging products based on generation portfolio – sell what we own • Heat rate options • Fuel products • Capacity • Renewable credits By design, our hedging program allows us to weather short-term, adverse market
conditions while positioning us to participate in long-term
upside potential |
 32 32 32 Percentage of Expected Generation Hedged • How many equivalent MW have been hedged at forward market prices; all hedge products used are converted to an equivalent average MW volume • Takes ALL hedges into account whether they are power sales or financial products Equivalent MWs Sold Expected Generation = • Our normal practice is to hedge commodity risk on a ratable basis over the three years leading to the spot market • Carry operational length into spot market to manage forced outage and
load-following risks • By using the appropriate product mix, expected generation hedged approaches the mid-90s percentile as the delivery period approaches • Participation in larger procurement events, such as utility auctions, and some
flexibility in the timing of hedging may mean the hedge program is not
strictly ratable from quarter to quarter Exelon Generation Hedging Program |
 33 33 33 2009 2010 2011 Estimated Open Gross Margin (millions) (1) $4,850 $5,850 $5,950 Open gross margin assumes all expected generation is sold at the Reference Prices listed below Reference Prices Henry Hub Natural Gas ($/MMBtu) NI-Hub ATC Energy Price ($/MWh) PJM-W ATC Energy Price ($/MWh) ERCOT North ATC Spark Spread ($/MWh) (2) $4.04 $28.06 $38.23 $(0.01) $6.21 $32.57 $48.40 $(1.51) $6.87 $34.36 $51.50 $(1.94) Exelon Generation Open Gross Margin and Reference Prices Based on September 30, 2009 market conditions (1) Gross margin is defined as operating revenues less fuel expense and purchased power expense, excluding the
impact of decommissioning and other incidental revenues. Open gross margin is estimated based
upon an internal model that is developed by dispatching our expected generation to current market power and fossil fuel prices. Open gross margin assumes there is no hedging in place other than fixed assumptions for capacity cleared in
the RPM auctions and uranium costs for nuclear power plants. Open gross margin contains
assumptions for other gross margin line items such as various ISO bill and ancillary revenues and costs and PPA capacity payments. The estimation of open gross margin incorporates management discretion and modeling assumptions that are
subject to change. (2) ERCOT North ATC spark spread using Houston Ship Channel Gas, 7,200 heat rate, $2.50 variable O&M.
|
 34 34 34 2009 2010 2011 Expected Generation (GWh) (1) 168,900 166,800 164,900 Midwest 99,500 98,600 98,200 Mid-Atlantic 57,900 59,900 59,100 South 11,500 8,300 7,600 Percentage of Expected Generation Hedged (2) 98-100% 88-91% 63-66% Midwest 98-100 88-91 67-70 Mid-Atlantic 97-99 91-94 56-59 South 98-100 90-93 52-55 Effective Realized Energy Price ($/MWh) (3) Midwest $47.00 $46.50 $44.50 Mid-Atlantic $36.00 $33.75 $60.50 ERCOT North ATC Spark Spread $5.25 $3.00 $4.25 Generation Profile (1) Expected generation represents the amount of energy estimated to be generated or purchased through owned or
contracted for capacity. Expected generation is based upon a simulated dispatch model
that makes assumptions regarding future market conditions, which are calibrated to market quotes for power, fuel, load following products, and options. Expected generation assumes 10 refueling outages in 2009 and 2010 and 11 refueling
outages in 2011 at Exelon-operated nuclear plants and Salem. Expected generation
assumes capacity factors of 93.6%, 93.5% and 92.8% in 2009, 2010 and 2011 at Exelon-operated nuclear plants. These estimates of expected generation in 2010 and 2011 do not represent guidance or a forecast of future results as Exelon has not
completed its planning or optimization processes for those years. (2) Percent of expected generation hedged is the amount of equivalent sales divided by the expected
generation. Includes all hedging products, such as wholesale and retail sales of power,
options, and swaps. Uses expected value on options. (3) Effective realized energy price is representative of an all-in hedged price, on a per MWh basis, at
which expected generation has been hedged. It is developed by considering the energy
revenues and costs associated with our hedges and by considering the fossil fuel that has been purchased to lock in margin. It excludes uranium costs and RPM capacity revenue, but includes the mark-to-market value of capacity contracted at
prices other than RPM clearing prices including our load obligations. It can be compared with the reference prices used to calculate open gross margin in order to
determine the mark-to-market value of Exelon Generation's energy hedges. |
 35 35 35 Gross Margin Sensitivities with Existing Hedges (millions) (1) Henry Hub Natural Gas + $1/MMBtu - $1/MMBtu NI-Hub ATC Energy Price +$5/MWH -$5/MWH PJM-W ATC Energy Price +$5/MWH -$5/MWH Nuclear Capacity Factor +1% / -1% 2009 $3 $(2) $3 $(1) $4 $(2) +/-$10 2010 $45 $(40) $40 $(35) $30 $(25) +/-$50 2011 $265 $(225) $185 $(175) $165 $(160) +/-$50 (1) Based on September 2009 market conditions and hedged position. Gas price sensitivities
are based on an assumed gas-power relationship derived from an internal model that is updated periodically. Power prices sensitivities are derived by adjusting the power price assumption while
keeping all other prices inputs constant. Due to correlation of the various assumptions, the hedged gross margin impact calculated by aggregating individual sensitivities may not be equal to the hedged gross margin impact calculated when correlations between the various assumptions are also
considered. Exelon Generation Gross Margin Sensitivities (with Existing Hedges) |
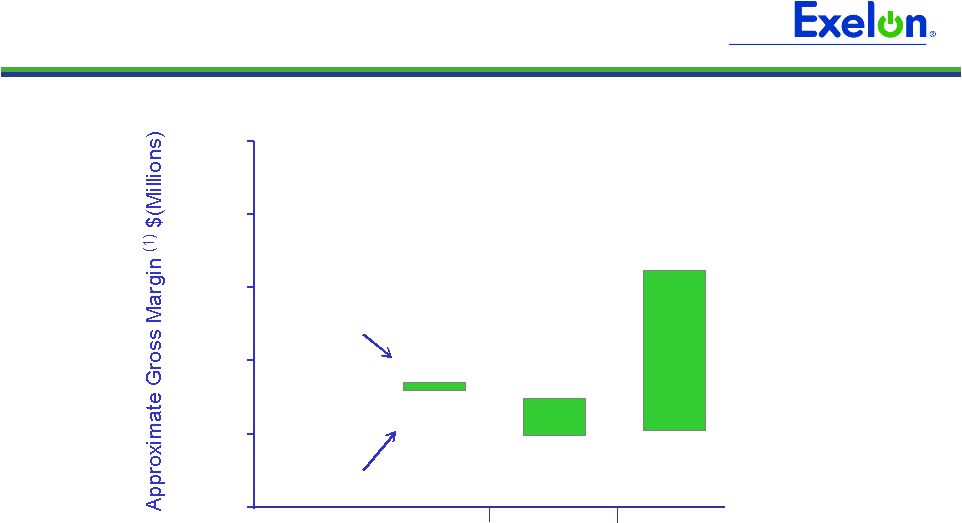 36 36 36 Exelon Generation Gross Margin Upside / Risk (with Existing Hedges) 95% case 5% case $6,700 $6,600 $6,100 $6,500 $6,000 $8,200 $5,000 $6,000 $7,000 $8,000 $9,000 $10,000 2009 2010 2011 Represents an approximate range of expected gross margin, taking into account hedges in place, between the
5th and 95th percentile confidence levels. Approximate gross margin ranges are based upon
an internal simulation model and are subject to change based upon market inputs, future transactions and potential modeling changes. These ranges of approximate gross margin in 2010 and 2011 do not represent earnings guidance or a forecast of future
results as Exelon has not completed its planning or optimization processes for those years.
The price distributions that generate this range are calibrated to market quotes for power, fuel, load following products, and options as of September 30, 2009. (1) |
 37 37 37 Midwest Mid-Atlantic ERCOT Step 1 Start with fleetwide open gross margin $4.85 billion Step 2 Determine the mark-to-market value of energy hedges 99,550GWh * 99% * ($47.00/MWh-$28.06/MWh) = $1.87 billion 57,900GWh * 98% * ($36.00/MWh-$38.23/MWh) = $(0.13 billion) 11,500GWh * 99% * ($5.25/MWh-($0.01)/MWh) = $0.06 billion Step 3 Estimate hedged gross margin by adding open gross margin to mark-to- market value of energy hedges Open gross margin: $4.85 billion MTM value of energy hedges: $1.87 billion + $(0.13 billion) + $0.06 billion Estimated hedged gross margin: $6.65 billion Illustrative Example of Modeling Exelon Generation 2009 Gross Margin (with Existing Hedges) |
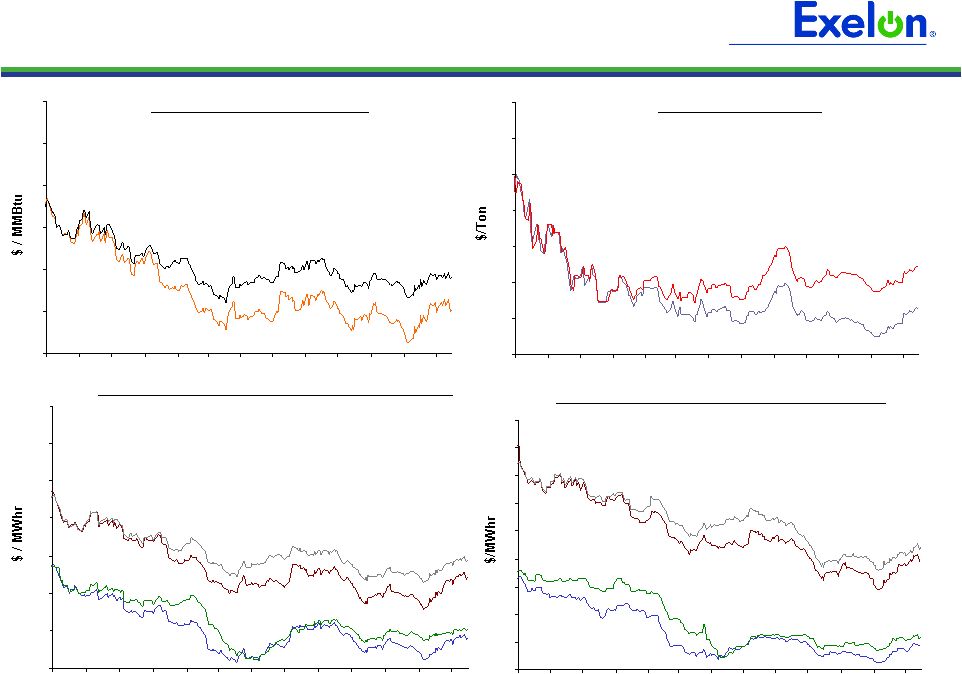 38 38 38 38 45 55 65 75 85 95 105 115 10/08 11/08 12/08 1/09 2/09 3/09 4/09 5/09 6/09 7/09 8/09 9/09 10/09 20 25 30 35 40 45 50 55 60 65 10/08 11/08 12/08 1/09 2/09 3/09 4/09 5/09 6/09 7/09 8/09 9/09 10/09 35 45 55 65 75 85 95 105 10/08 11/08 12/08 1/09 2/09 3/09 4/09 5/09 6/09 7/09 8/09 9/09 10/09 5 6 7 8 9 10 11 10/08 11/08 12/08 1/09 2/09 3/09 4/09 5/09 6/09 7/09 8/09 9/09 10/09 38 Market Price Snapshot Forward NYMEX Natural Gas PJM-West and Ni-Hub On-Peak Forward Prices PJM-West and Ni-Hub Wrap Forward Prices 2010 $6.04 2011 $6.82 Rolling 12 months, as of October 15, 2009. Source: OTC quotes and electronic trading
system. Quotes are daily. Forward NYMEX Coal 2010 $53.25 2011 $65.26 2010 Ni-Hub $43.06 2011 Ni-Hub $45.29 2011 PJM-West $63.88 2010 PJM-West $59.37 2010 Ni-Hub $24.40 2011 Ni-Hub $26.00 2011 PJM-West $42.28 2010 PJM-West $39.79 |
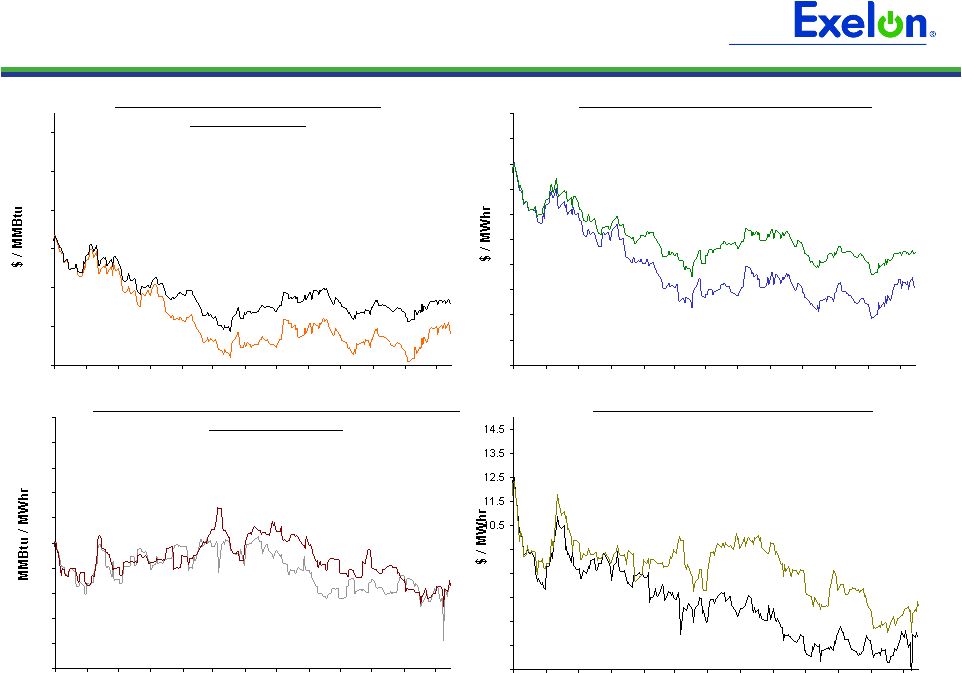 39 39 39 39 4.5 5.5 6.5 7.5 8.5 9.5 10/08 11/08 12/08 1/09 2/09 3/09 4/09 5/09 6/09 7/09 8/09 9/09 10/09 8 8.2 8.4 8.6 8.8 9 9.2 9.4 9.6 9.8 10 10/08 11/08 12/08 1/09 2/09 3/09 4/09 5/09 6/09 7/09 8/09 9/09 10/09 35 40 45 50 55 60 65 70 75 80 85 10/08 11/08 12/08 1/09 2/09 3/09 4/09 5/09 6/09 7/09 8/09 9/09 10/09 5 6 7 8 9 10 11 10/08 11/08 12/08 1/09 2/09 3/09 4/09 5/09 6/09 7/09 8/09 9/09 10/09 39 Market Price Snapshot 2011 $8.66 2010 $8.65 2010 $50.68 2011 $57.42 2010 $5.86 2011 $6.63 Houston Ship Channel Natural Gas Forward Prices ERCOT North On-Peak Forward Prices ERCOT North On-Peak v. Houston Ship Channel Implied Heat Rate 2010 $5.91 2011 $7.10 ERCOT North On Peak Spark Spread Assumes a 7.2 Heat Rate, $1.50 O&M, and $.15 adder Rolling 12 months, as of October 15, 2009. Source: OTC quotes and electronic trading
system. Quotes are daily. |