Attached files
| file | filename |
|---|---|
| 8-K - TEMPUR-PEDIC 8-K 10-22-2009 - TEMPUR SEALY INTERNATIONAL, INC. | form8k.htm |


2
Barry Hytinen
Vice President
3
Webcast
participants may email questions to:
investor.relations@tempurpedic.com
Agenda

Note
Regarding Trademarks, Trade Names and Service Marks:
Tempur,
Tempur-Pedic, The DeluxeBed by Tempur-Pedic, The ClassicBed by Tempur-Pedic, The
GrandBed by Tempur-Pedic, The TEMPUR-
Cloud Supreme, The TEMPUR-Cloud, The RhapsodyBed by Tempur-Pedic, The AdvantageBed by Tempur-Pedic, The Bella Fina Bed by Tempur-
Pedic, The BellaSonna Bed by Tempur-Pedic, The TEMPUR-Cloud Luxe by Tempur-Pedic, The CelebrityBed by Tempur-Pedic, The AlluraBed by
Tempur-Pedic, The Sensation, The Sensation Lite, The NeckPillow by Tempur-Pedic, The SymphonyPillow by Tempur-Pedic, The ComfortPillow
by Tempur-Pedic, The RhapsodyPillow by Tempur-Pedic are trademarks, trade names or service marks of Tempur-Pedic International Inc. and its
subsidiaries. All other trademarks, trade names and service marks in this presentation are the property of their respective owners.
Forward-Looking
Statements
This
presentation may contain “forward-looking statements,” within the meaning of
federal securities laws, which include information concerning the
Company’s plans, objectives, goals, strategies, future revenues or performance, financing needs and other information that is not historical information.
When used in this presentation, the words “estimates,” “expects,” “anticipates,” “projects,” “plans,” “intends,” “believes,” and variations of such words or
similar expressions are intended to identify forward-looking statements. All forward-looking statements, including without limitation, the Company’s
expectations regarding improving the quality and range of existing products; increasing brand awareness and brand consideration; the impact of the
introduction of new products, including the TEMPUR-Cloud™ Supreme; international and domestic growth opportunities; increasing market share;
improving gross margin; expanding and improving distribution channels; manufacturing capacity and utilization; consumer preferences and behavior; the
effectiveness of new cost structures; meeting financial obligations; cost and operating expense reductions and cash flow generation; and the Company’s
enhanced earnings power are based upon current expectations and beliefs and various assumptions. There can be no assurance that the Company will
realize these expectations or that these beliefs will prove correct.
There
are a number of risks and uncertainties that could cause actual results to
differ materially from the forward-looking statements contained in
this
presentation. Numerous factors, many of which are beyond the Company’s control, could cause actual results to differ materially from those expressed
as forward-looking statements. These risk factors include general economic and industry conditions, particularly in the retail sector, as well as consumer
confidence and the availability of consumer financing; the Company’s ability to reduce expenses to align with reduced sales levels; uncertainties arising
from global events; the effects of changes in foreign exchange rates on the Company’s reported earnings; consumer acceptance of the Company’s
products; industry competition; the efficiency and effectiveness of the Company’s advertising campaigns and other marketing programs; the Company’s
ability to increase sales productivity and expand distribution channels; the Company’s dependence on its significant customers; the Company’s ability to
address issues in certain underperforming international markets; the Company’s ability to continuously improve its product line, maintain efficient, timely
and cost-effective production and delivery of its products, and manage its growth; changes in foreign tax rates; rising commodity costs; the Company’s
ability to retain members of its senior management team; the effects of increased interest rates; the market price for the Company’s common stock
prevailing from time to time; and the nature of other investment opportunities presented to the Company from time to time.
Additional
information concerning these and other risks and uncertainties are discussed in
the Company's filings with the Securities and Exchange
Commission, including without limitation the Company's annual report on Form 10-K under the headings "Special Note Regarding Forward-Looking
Statements" and "Risk Factors". Any forward-looking statement speaks only as of the date on which it is made, and the Company undertakes no
obligation to update any forward-looking statements for any reason, including to reflect events or circumstances after the date on which such statements
are made or to reflect the occurrence of anticipated or unanticipated events or circumstances.

5
Mark Sarvary
President & Chief Executive Officer

6
Tempur-Pedic Overview
7
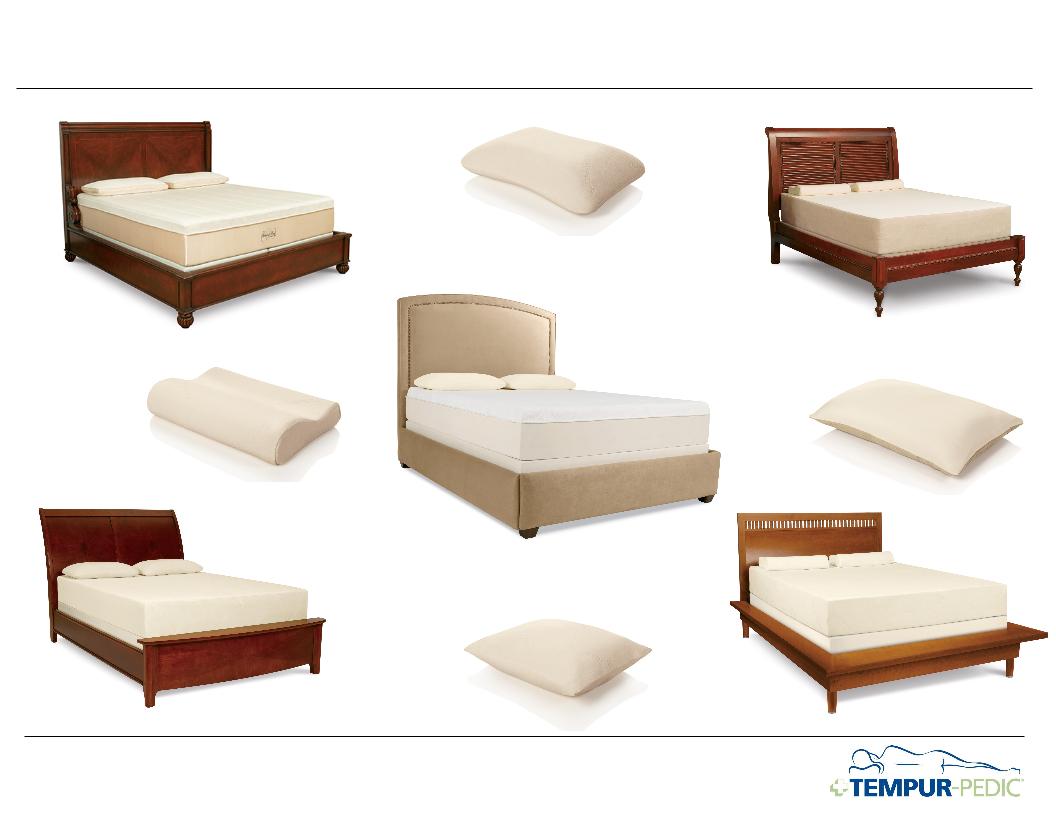
Unique
Range Of Mattresses And Pillows Utilizing The
Proprietary Pressure Relieving Tempur Material
Proprietary Pressure Relieving Tempur Material
The
Grandbed
by
Tempur-Pedic®
The
RhapsodyBed
by
Tempur-Pedic®
The
DeluxeBed
by
Tempur-Pedic™
The
AdvantageBed
by
Tempur-Pedic™
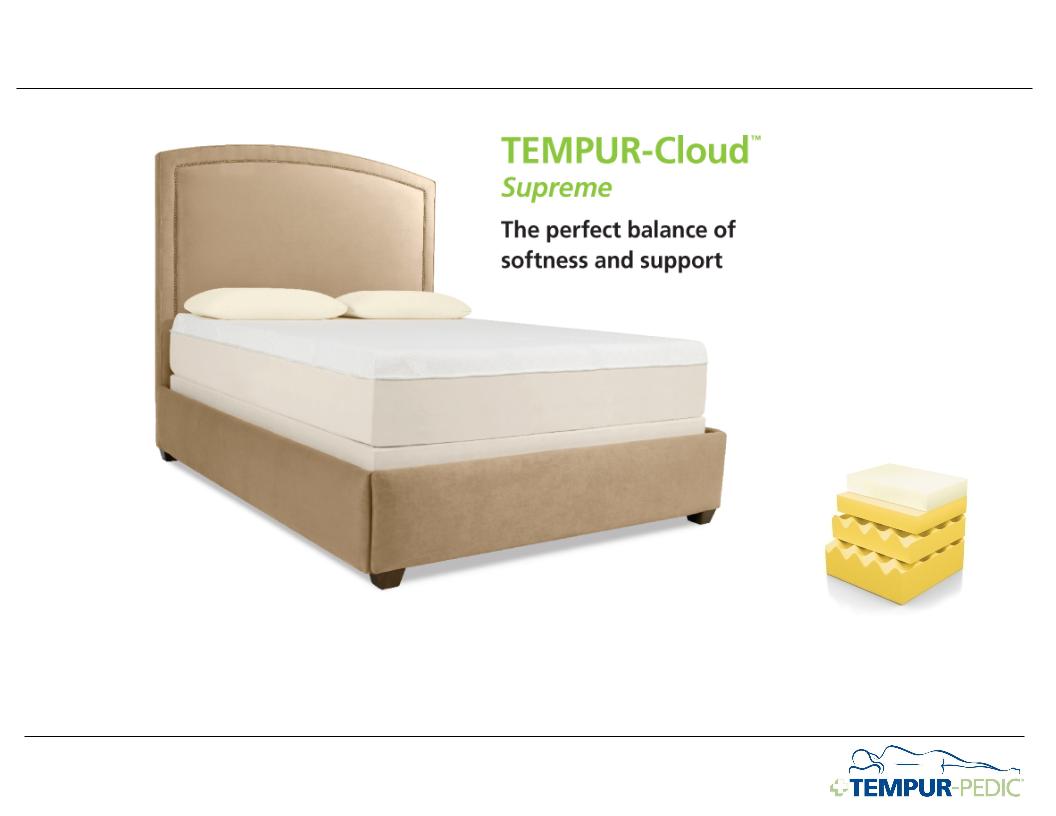
The
TEMPUR-Cloud™ Supreme
The
SymphonyPillow
by
Tempur-Pedic®
The
ComfortPillow
by
Tempur-Pedic®
The
NeckPillow
by
Tempur-Pedic™
The
RhapsodyPillow
by
Tempur-Pedic®

8
Company
Thesis
® Established:
Worldwide leader in
specialty mattresses and premium mattresses
Ø Leader in the $5B
premium segment of the $13B global mattress market
® Differentiated:
Consumer preferred,
branded product line
Ø Most highly
recommended brand by owners, most desired brand for non-owners
Ø Over a decade of
industry-leading brand advertising, very high level of owner
referrals
® Profitable:
Industry-leading
margins and cash flows
Ø Gross margin ~47%,
potential 50%
Ø Operating margin
~17%, potential 25%
Ø Annual depreciation
& amortization is 2x annual capital expenditures
® Growing:
Significant top line
growth opportunity
Ø 2% U.S. mattress
market share
Source:
Management estimates

9
Independent
And Internal Research Confirms Tempur-Pedic Is A
Preferred Product
Preferred Product
Source:
The 2008 and 2009 Gallup Consumer Mattress Market Study and Update
In its
October 2009 issue hot off the press,
Consumer Reports released the results of a survey
in which 17,000 people rated their mattresses. The
article, entitled “Would you buy that mattress
again?”, reports that Tempur-Pedic scored #1 on
“Would Definitely Buy Again” - beating ALL other
brands in the survey.
Consumer Reports released the results of a survey
in which 17,000 people rated their mattresses. The
article, entitled “Would you buy that mattress
again?”, reports that Tempur-Pedic scored #1 on
“Would Definitely Buy Again” - beating ALL other
brands in the survey.
10
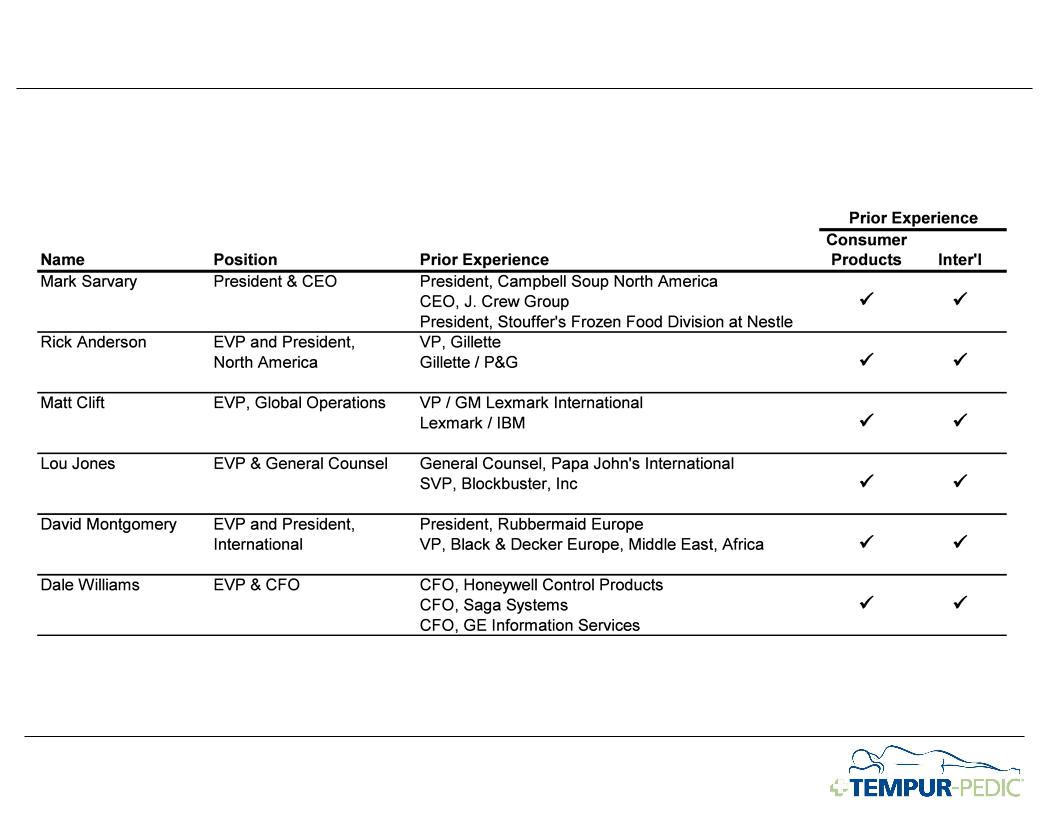
Strong
Management Team With > 150 Years Running Large,
International
Businesses
Businesses
11
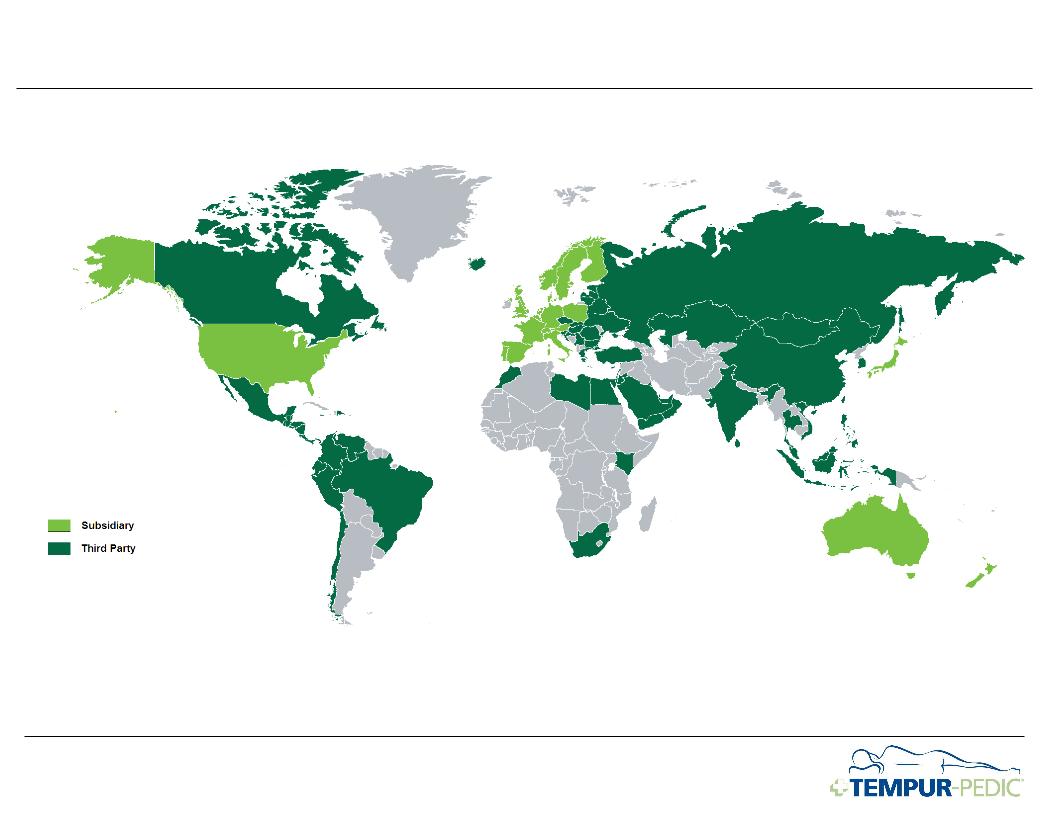
Global
Presence
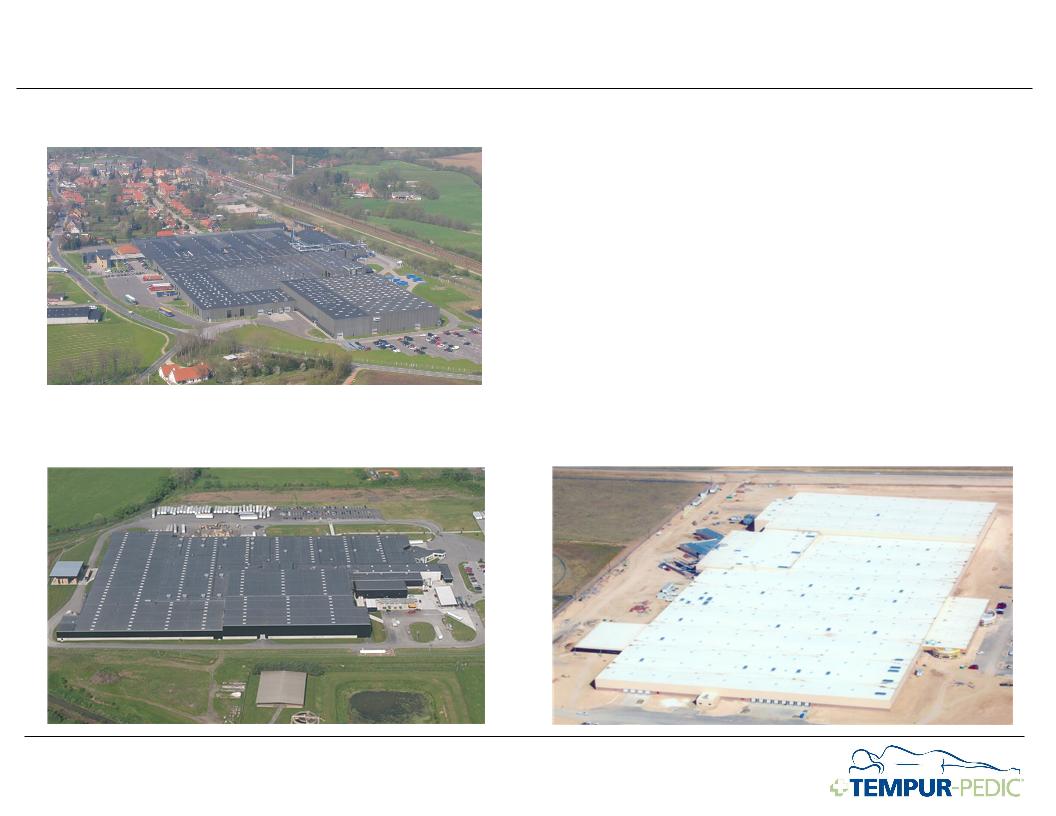
12
Denmark
(500K
sq ft)
Duffield,
VA
(500K
sq ft)
Albuquerque,
NM
(800K
sq ft)
State-of-the-Art
Vertically Integrated Manufacturer
u Highly automated,
ISO-certified plants
u > $200 million
invested

13
2009 Performance

14
2009
Strategic Priorities
u Maintain a
reasonable cushion to financial covenants
u Improve cost
structure to maximize results in 2009 and to set stronger base for
2010
u Improve share versus
relevant competitive set, primarily premium and specialty
u Set stage for growth
in 2010 and beyond
Ø Improve retail
effectiveness
Ø Broaden product
range
Ø Grow direct
channel
Ø Improve household
penetration in International markets
u Maintain flexibility
to respond quickly should the economy recover

Progress
on 2009 Priorities
u Maintain a
reasonable cushion to financial covenants
ü Reduced debt by
>$100 million year to date (September 2009)
ü Lowered Debt to
EBITDA ratio to <2.0 times vs. our 3.0 times bank covenant
u Improve cost
structure to maximize results in 2009 and to set stronger base for
2010
ü Productivity program
on track - Gross margin in Q3 2009 586 bps higher than Q3 2008
ü Lowered SGA spend
16% through first three quarters of 2009 as compared to 2008
u Improve share versus
relevant competitive set, primarily premium and specialty
ü Increased mattress
market share sequentially every month of 2009
u Set stage for growth
in 2010 and beyond
ü Improve retail
effectiveness - Effective promotions, increased investment in
advertising
ü Broaden product
range - Successful launch of Cloud collection
ü Grow direct channel
- Year on year growth in 3rd quarter
2009
ü Improve household
penetration in International markets - Sensation and Sensation Lite
u Maintain flexibility
to respond quickly should the economy recover
ü Above budget
investment in advertising and R&D
ü Guidance raised on
10/15/09:
Ø Sales: $790 - $805MM
- down 15 to 13%
versus 2008
Ø Earnings: $1.00 -
$1.05 - up 6 to 12% versus
2008
Notes:
1. For a reconciliation of Funded Debt to EBITDA and 2008 Adjusted Net Income,
see Appendix to this presentation.
2.
Mattress share based on management estimates and ISPA monthly sample industry
reports for 2009
3.
For a discussion of the Company’s performance, please refer to the Company’s
press release for 3Q09 results and the Company’s prior 10K and 10Q
filings.

16
Industry Review

17
Industry
Situational Assessment
u Mattress industry
experiencing unprecedented downturn, though the market remains
large
large
u 2008 represents the
worst year on record for the bedding industry; 2009 still down
u Consumer credit,
while still available, has tightened
u Retailer
bankruptcies
u Many competitors in
financial distress
18
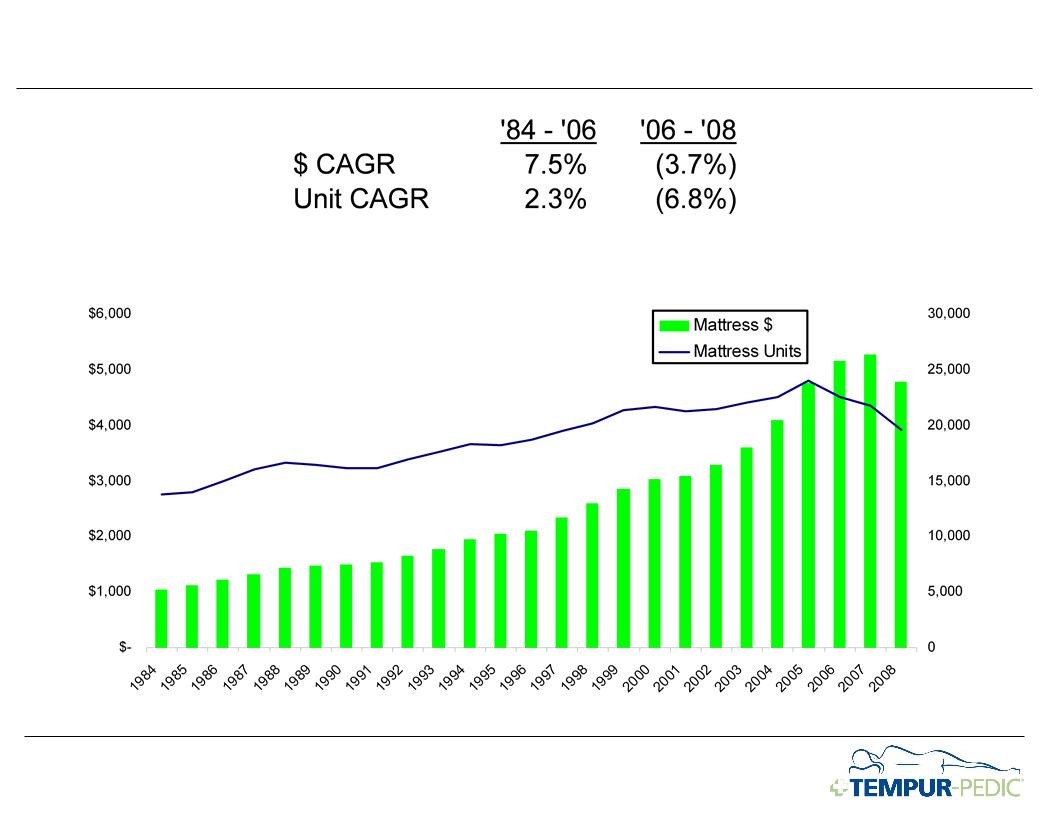
Historically,
A Steadily Growing Industry
Units
(In
Thousands)
Dollars
(In
Millions)
Source:
2008 and 2004 Annual ISPA Report of Sales and Trends
19
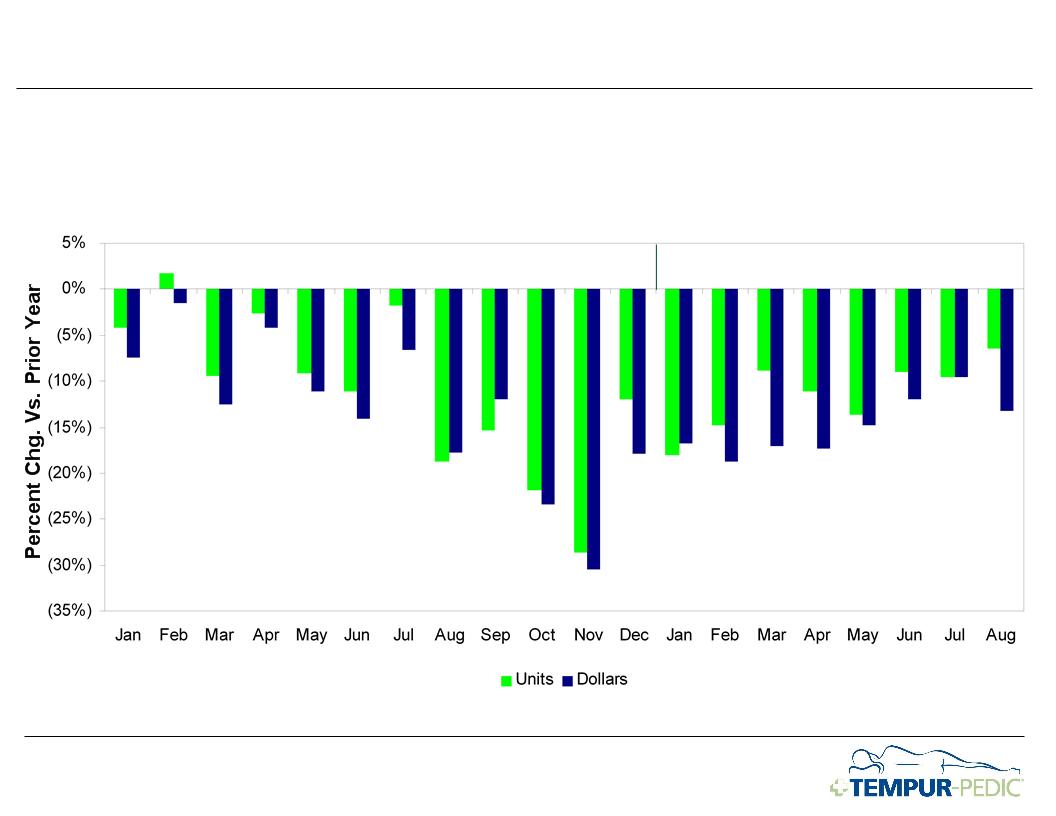
Recent
Trends Remain Weak And Unprecedented
2008
2009
Source:
2009 ISPA Sales Report
ISPA
Performance (vs. Prior Year)
20
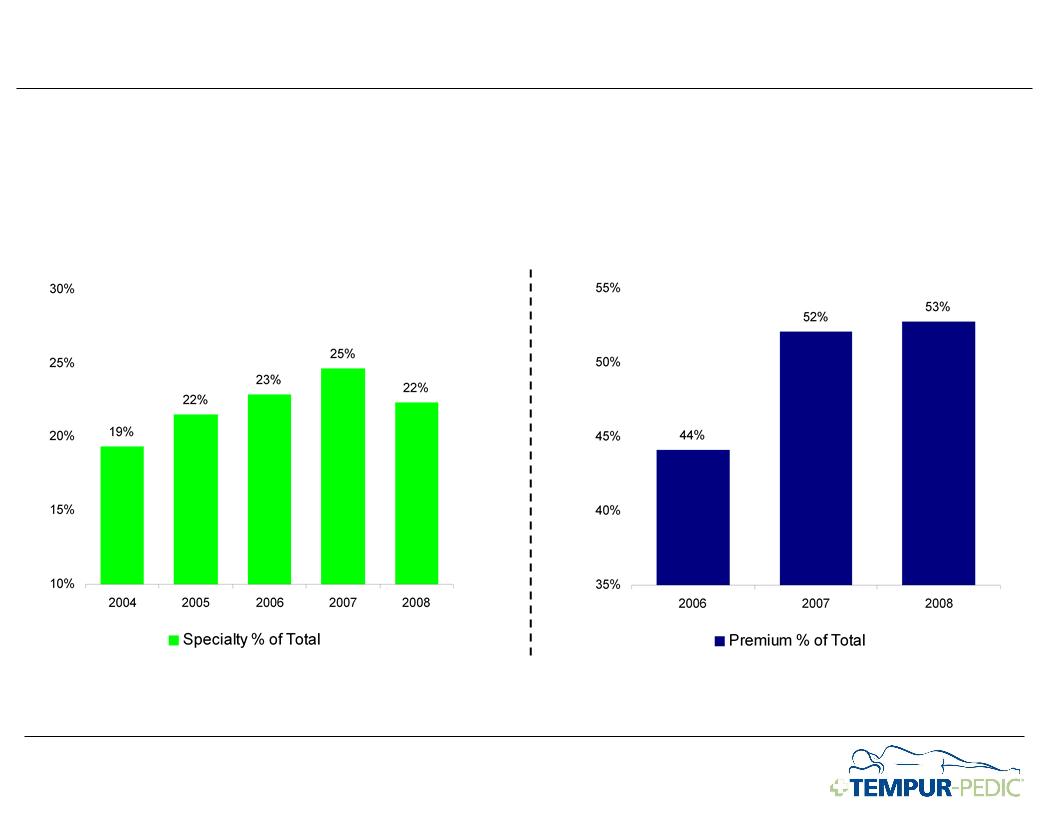
Long-term
Growth Of Specialty & Premium Mattress Segments
Source:
2008 ISPA Sales Report
Note:
Premium mattress category defined as $1,000+
Specialty
Share
Premium
Share

21
Tempur-Pedic Opportunity & Strategy
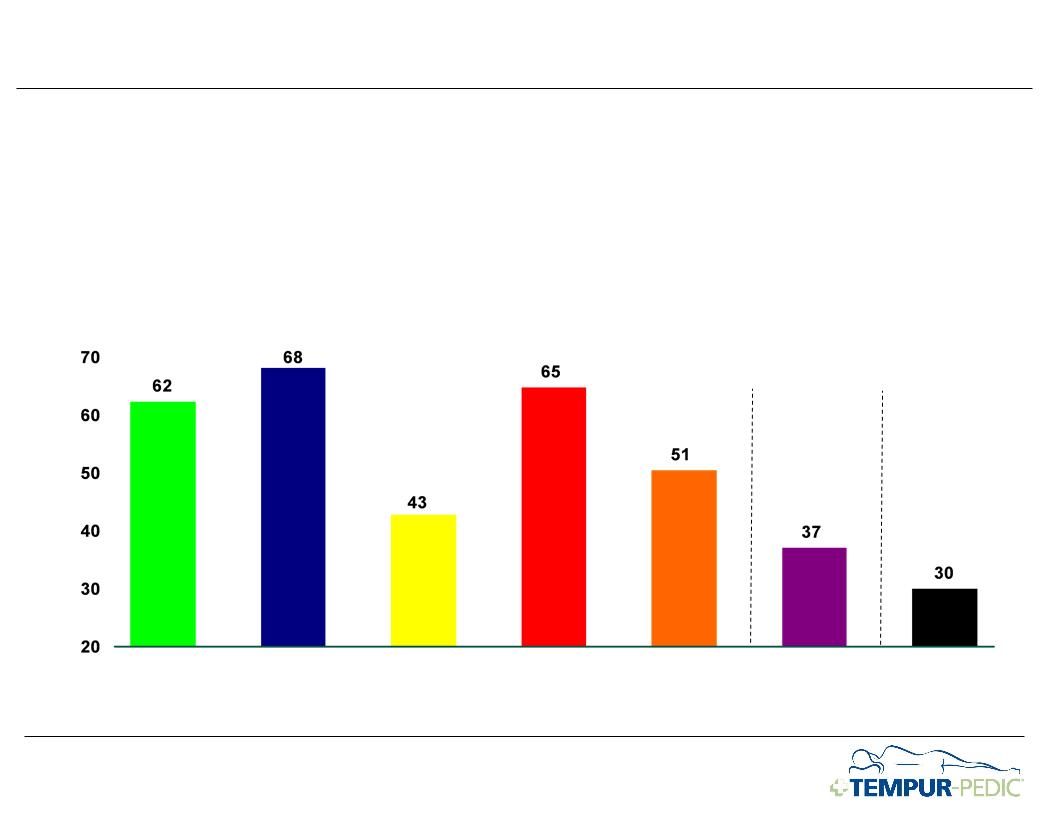
22
Very
Strong Brand Awareness, Particularly Among Premium
Buyers
Buyers
Source:
The 2008 and 2009 Gallup Consumer Mattress Market Study and Update
+28%
+3%
+0%
+4%
2004
2006
2008
All
U.S. Prospective Buyers
U.S.
Premium Prospective Buyers
2004
2006
2008
2004
2006
2008
2004
2006
2008

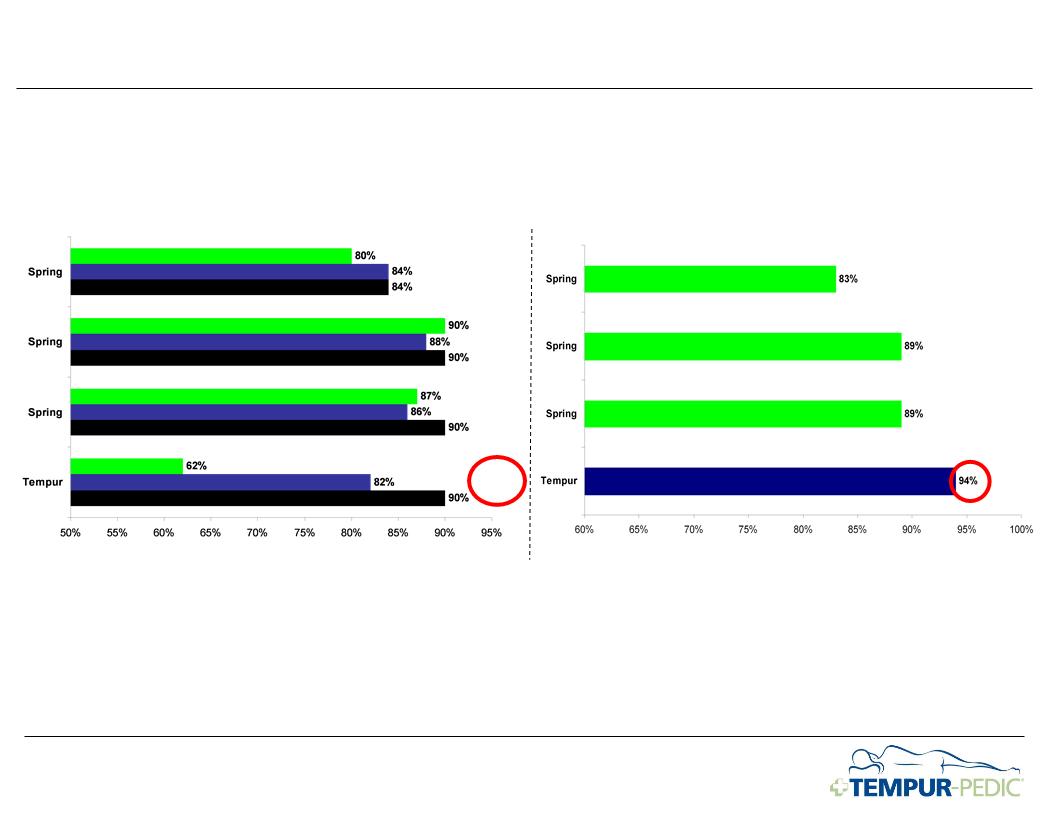
23
Strategic
Research Summary
u Tempur-Pedic owners
like their beds much better than spring mattress owners
Ø Recommend to a
friend (top box): Tempur-Pedic: 65%, Spring 24-27%
Source:
Tempur-Pedic research

24
Strategic
Research Summary
u Tempur-Pedic owners
like their beds much better than spring mattress owners
Ø Recommend to a
friend (top box): Tempur-Pedic: 65%, Spring 24-27%
u Tempur-Pedic also
has very strong perception among the general population
Ø Most comfortable:
Tempur-Pedic 41% vs Spring 21-29%
Source:
Tempur-Pedic research

25
Strategic
Research Summary
u Tempur-Pedic owners
like their beds much better than spring mattress owners
Ø Recommend to a
friend (top box): Tempur-Pedic: 65%, Spring 24-27%
u Tempur-Pedic also
has very strong perception among the general population
Ø Most comfortable:
Tempur-Pedic 41% vs Spring 21-29%
u People say they are
going to consider a Tempur-Pedic for their next bed:
Ø Brands considered:
Tempur-Pedic: 45%, Spring 29-49%
Source:
Tempur-Pedic research

26
Strategic
Research Summary
u Tempur-Pedic owners
like their beds much better than spring mattress owners
Ø Recommend to a
friend (top box): Tempur-Pedic: 65%, Spring 24-27%
u Tempur-Pedic also
has very strong perception among the general population
Ø Most comfortable:
Tempur-Pedic 41% vs Spring 21-29%
u People say they are
going to consider a Tempur-Pedic for their next bed
Ø Brands considered:
Tempur-Pedic: 45%, Spring 29-49%
u Tempur-Pedic has
been voted best bed by Consumer Reports (October 2009)
Source:
Tempur-Pedic research
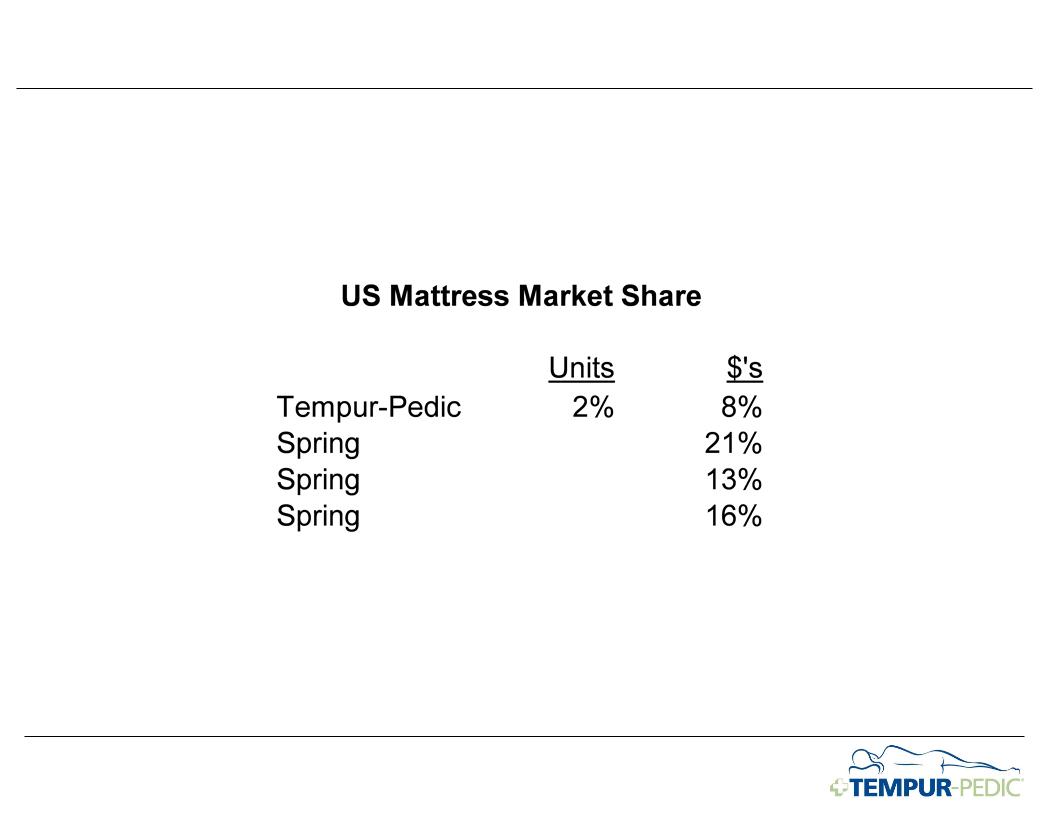
27
Strategic
Research Summary
…..and
yet Tempur-Pedic has a very small market share
Source:
2007 Data - Furniture/Today market research (2008 Bedding Yearbook - Nov. 24,
2008)

28
Our
goal is to become the world’s
favorite
mattress and pillow brand.

29
How
Will We Achieve This Goal?
1. Make Sure Everyone
Knows They Would Sleep Better On Tempur
2. Make Sure There Is A
Tempur Bed And Pillow That Appeals To Everyone
3. Make Sure That
Tempur Is Available To Everyone
4. Make Sure Tempur
Continues To Deliver The Best Sleep
…and
make sure our cost structure is optimized to enable these marketing and
product development investments
product development investments

30
Tempur
Vision
People
who sleep on Tempur sleep better than those
who
don’t.
Our
goal is to become the world’s
favorite
mattress and pillow brand.
To
achieve our goal we will:
1. Make sure everyone
knows they would sleep better on Tempur
2. Make sure there is a
Tempur mattress and pillow that appeals to everyone
3. Make sure that
Tempur is available to everyone
4. Make sure Tempur
continues to deliver the best sleep
Make
sure our cost structure is optimized to enable marketing and product
investments

31
Implementing The Strategy

32
People
who sleep on Tempur sleep better than those
who
don’t.
Our
goal is to become the world’s
favorite
mattress and pillow brand.
To
achieve our goal we will:
1. Make sure everyone
knows they would sleep better on Tempur
2. Make
sure there is a Tempur mattress and pillow that
appeals to everyone
appeals to everyone
3. Make sure that
Tempur is available to everyone
4. Make sure Tempur
continues to deliver the best sleep
Make
sure our cost structure is optimized to enable marketing and product
investments
Tempur
Vision

33
1. “It’s too
expensive”
2. “It’s too
firm”
3. “It’s for ‘other
people’” (e.g. older, back pain, etc.)
Make
Sure There Is A Tempur Mattress And Pillow That Appeals
To Everyone
To Everyone
Why
isn’t Tempur-Pedic already the favorite mattress?
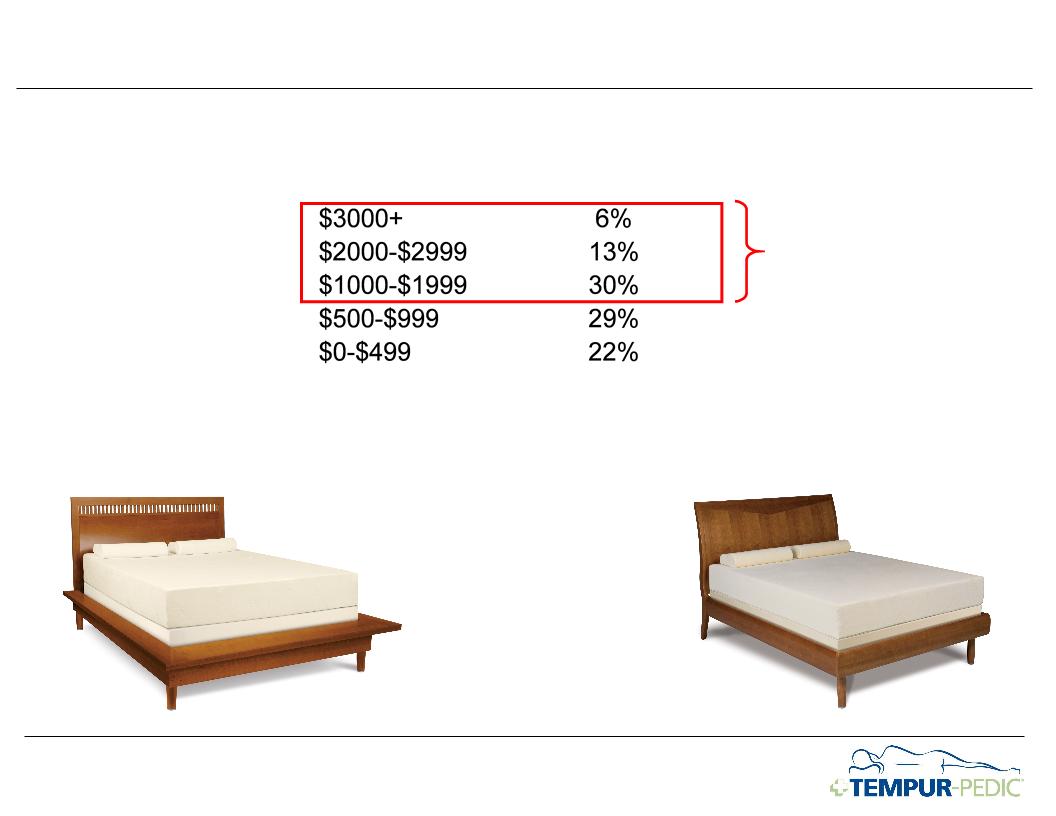
34
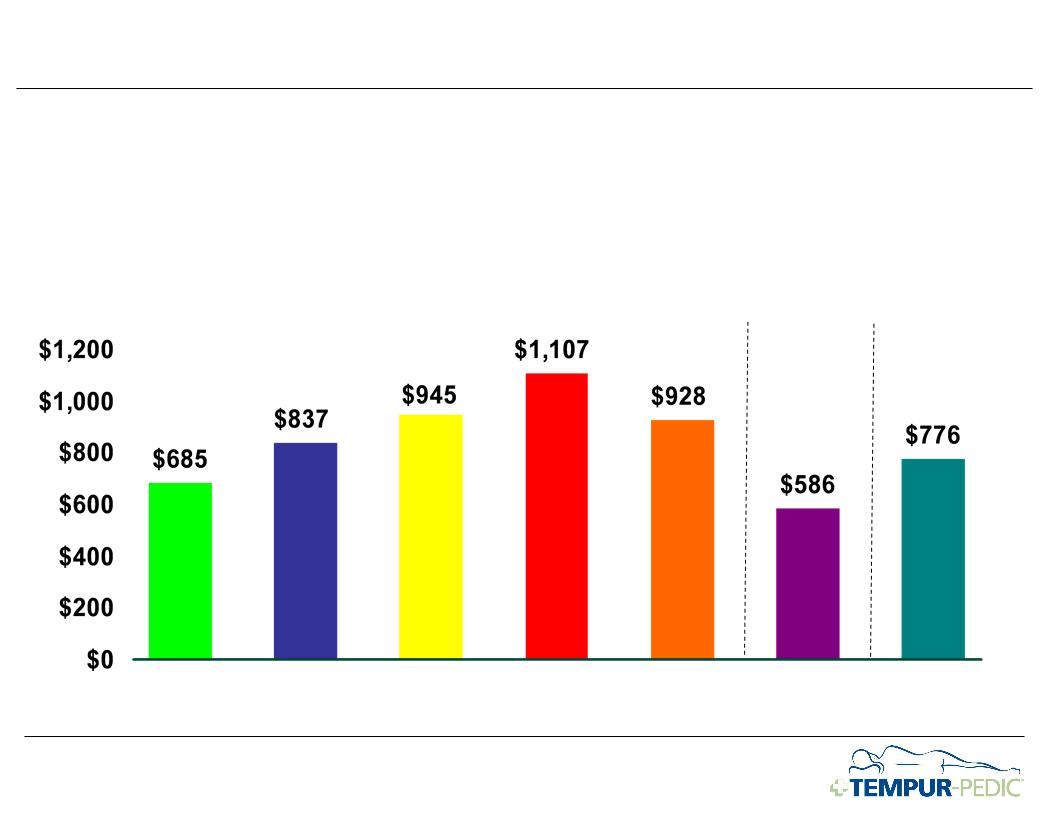
There
Is Enormous Potential For Growth Within The Price Ranges We
Currently Compete In
Currently Compete In
Source:
Tempur-Pedic estimates based on ISPA, Traqline, and management
estimates
The
AdvantageBed
by
Tempur-Pedic™
The
ClassicBed
by
Tempur-Pedic®
Queen
Mattress
$1,299
$1,299
Queen
Mattress
$1,699
$1,699
49%
Retail
Price
Point
Point
%
of Total Annual
U.S. Wholesale
Mattress Sales
U.S. Wholesale
Mattress Sales

35
1. “It’s too
expensive”
2. “It’s too
firm”
3. “It’s for ‘other
people’” (e.g. older, back pain, etc)
Make
Sure There Is A Tempur Mattress And Pillow That Appeals
To Everyone
To Everyone
Why
isn’t Tempur-Pedic already the favorite mattress?
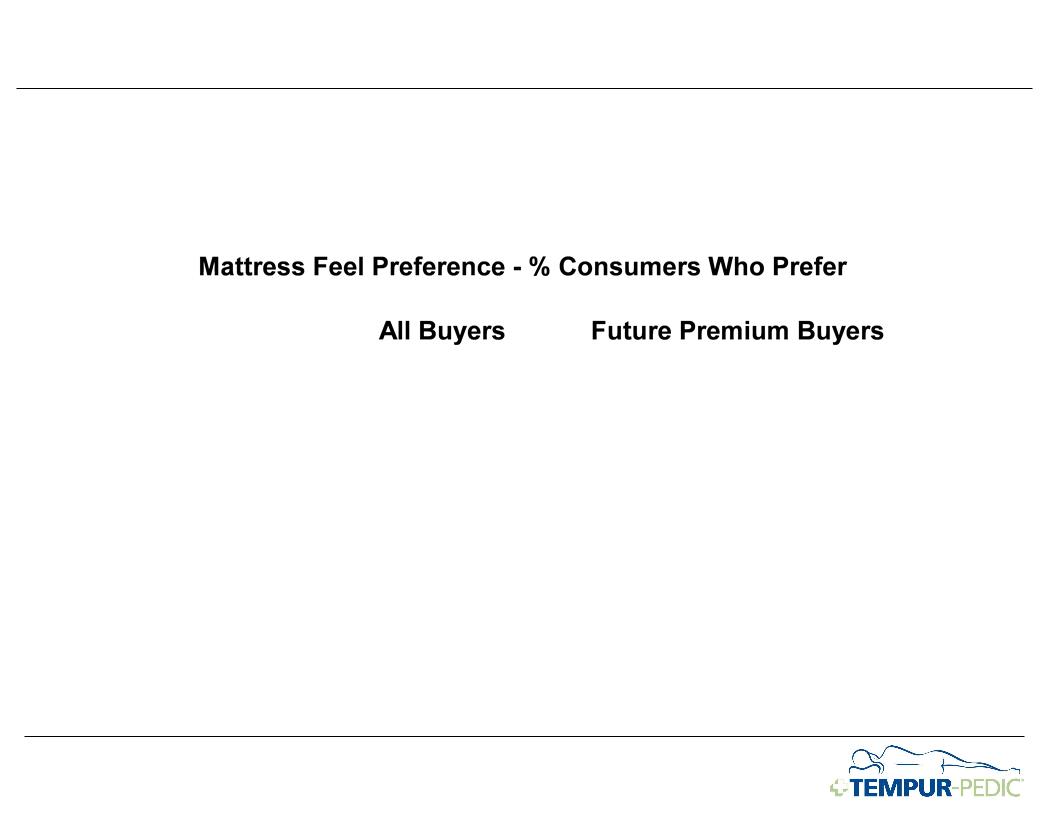
36
Most
Premium Mattress Buyers Prefer Soft / Medium
Source: 2009
SMI/Alcott Mattress Attitude & Usage Study
Premium
= Will spend $1,000+ for my next mattress set
Firm
Soft /
Medium
51%
49%
48%
52%
37
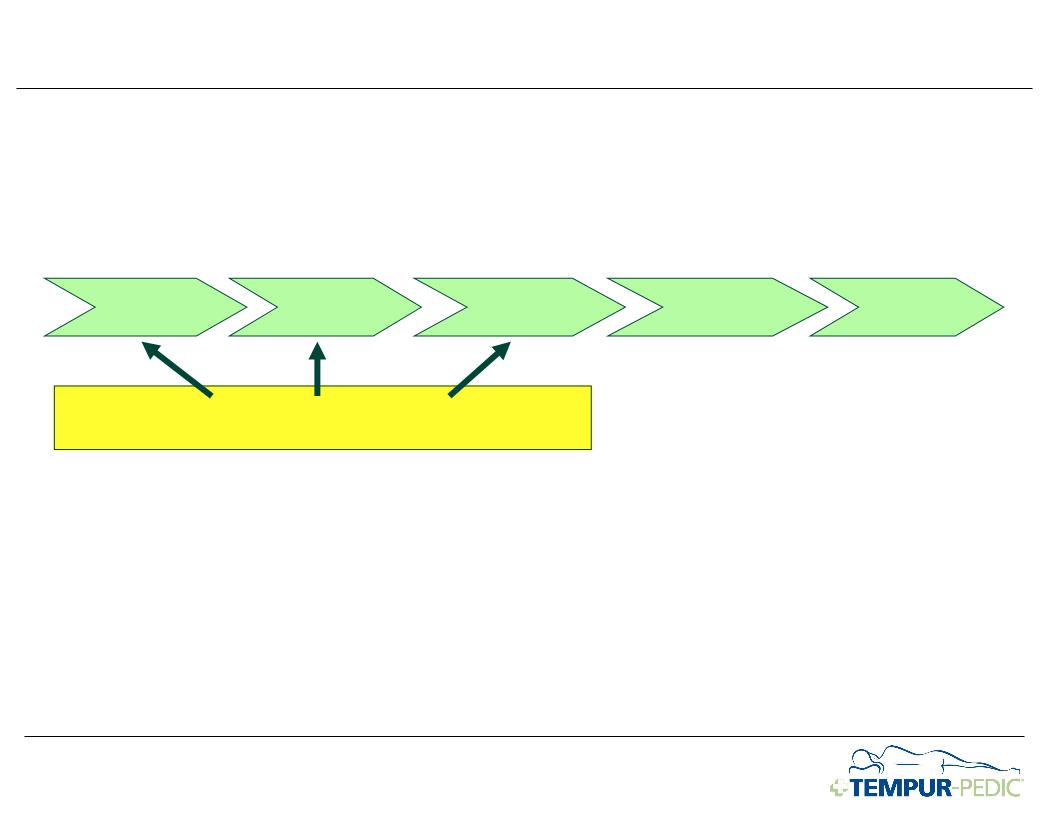
Initiated
A Major Research-Driven New Product Program In 9/08
Concept
Creation
Development
&
Testing
Manufacturing
Ramp-Up
Commercial-
ization
Design
Consumer
Research

38
Unprecedented
Product Research
u 15 months of
consumer research and development
u 6 separate rounds
of consumer testing
u Over 1,150 consumer
prototype evaluations
u Tested against
strong marketplace basket of competitors
u Tested via in-home
consumer sleep evaluations
u Tested among
premium buyers who prefer soft & pillow-tops
39
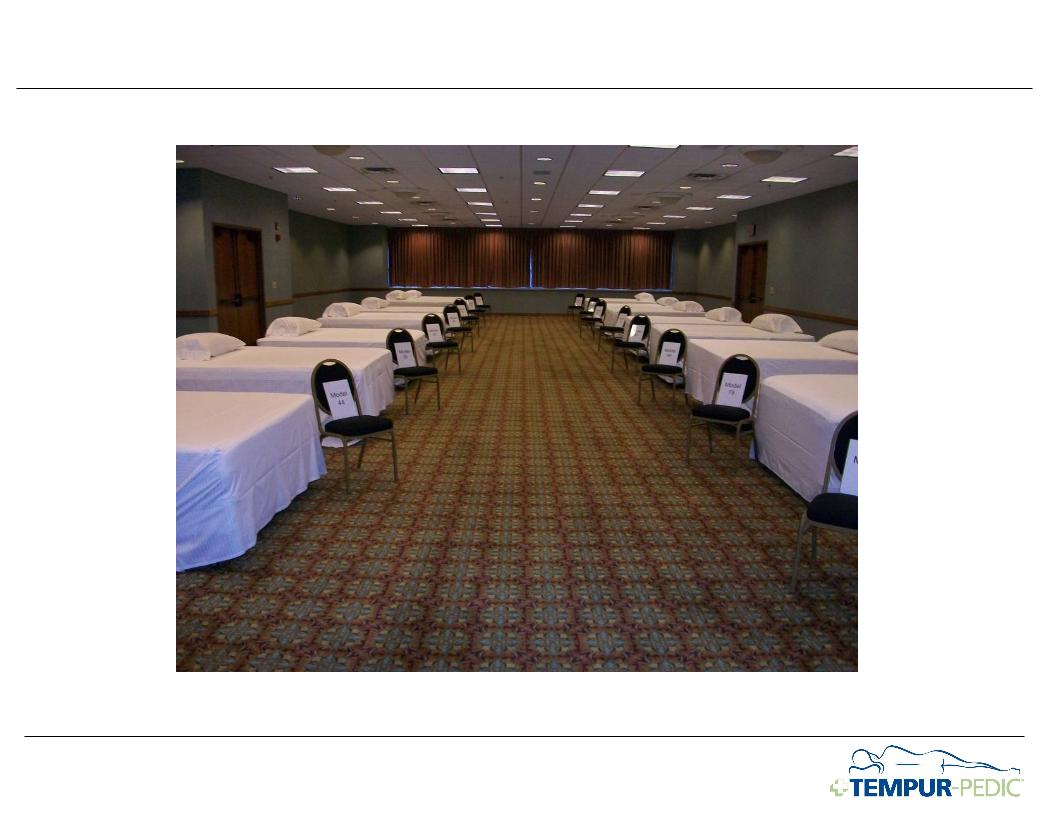
Innovation Research: Blind Sensory Room
40
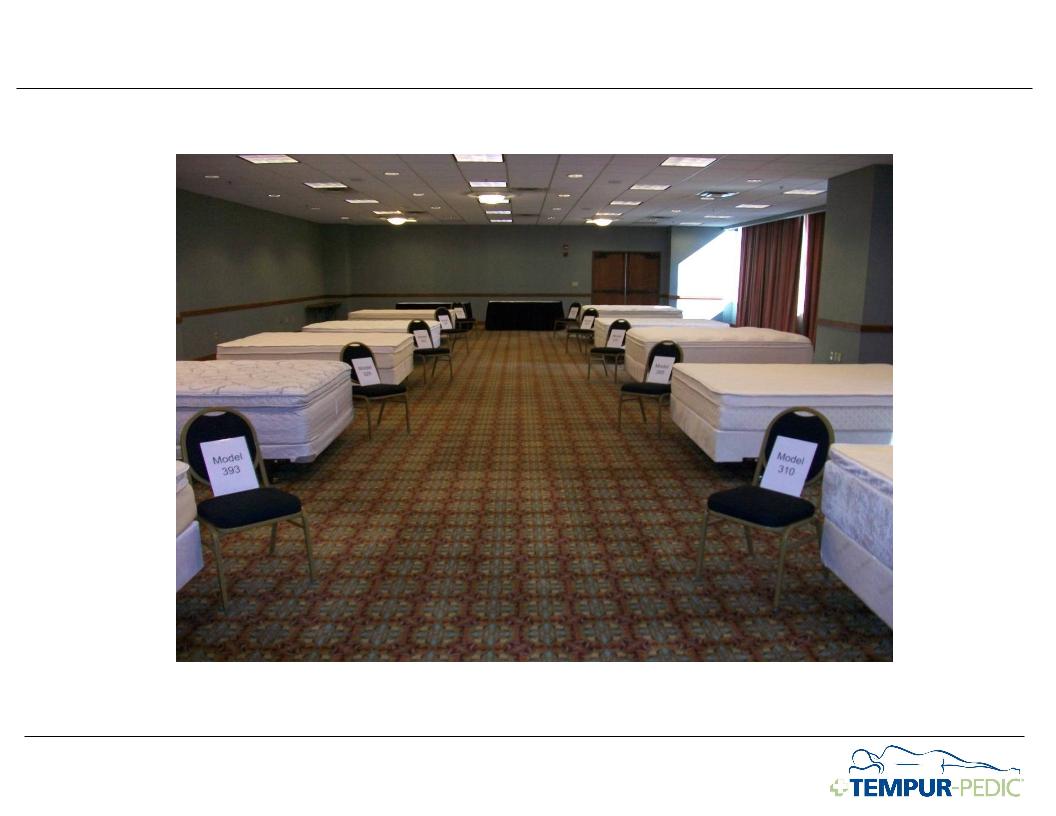
Innovation
Research: Visual Design Room Layout
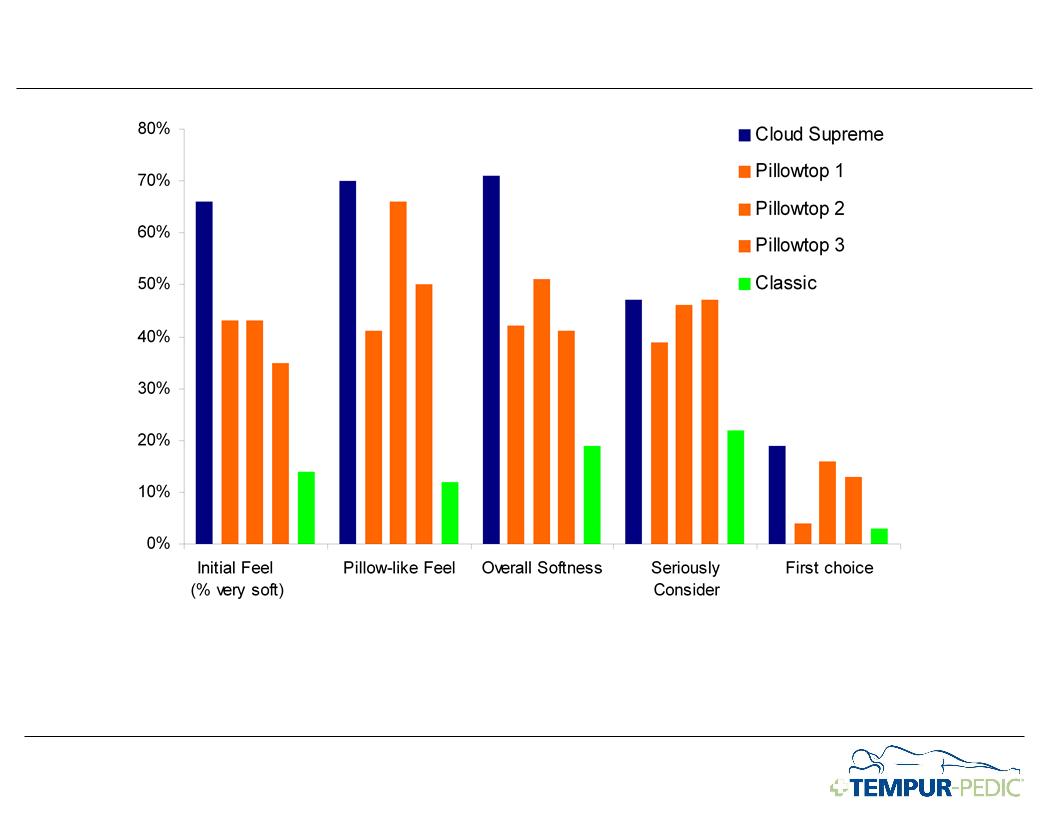
41
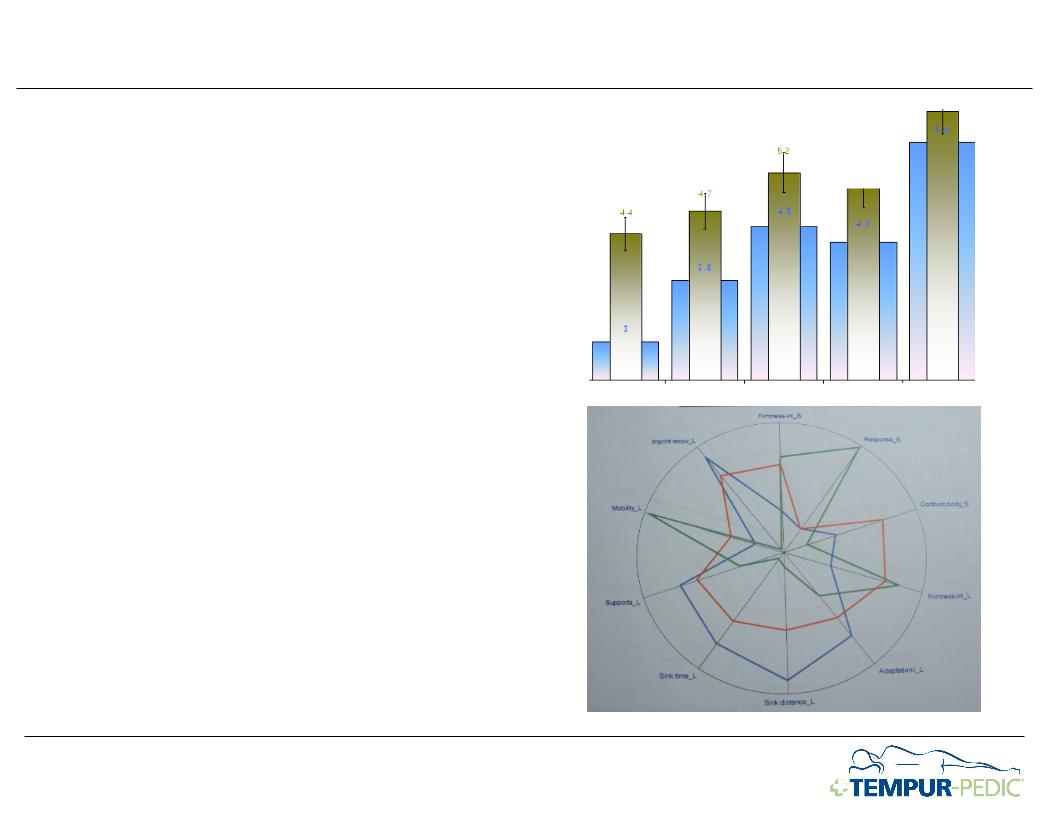
Research
Results Are Clear - Among Consumers Who Previously
Rejected
Tempur-Pedic
Tempur-Pedic
Source:
2009 Tempur-Pedic company research
Note: %
of people rating a 6 or 7 on a 7 point scale.
Better
Than
Competition
,
Different
From
Classic
42
TEMPUR-Cloud™
Supreme: 4th Quarter 2009
$1,999
Queen Mattress
Featuring
our latest formula, TEMPUR-ES™
43
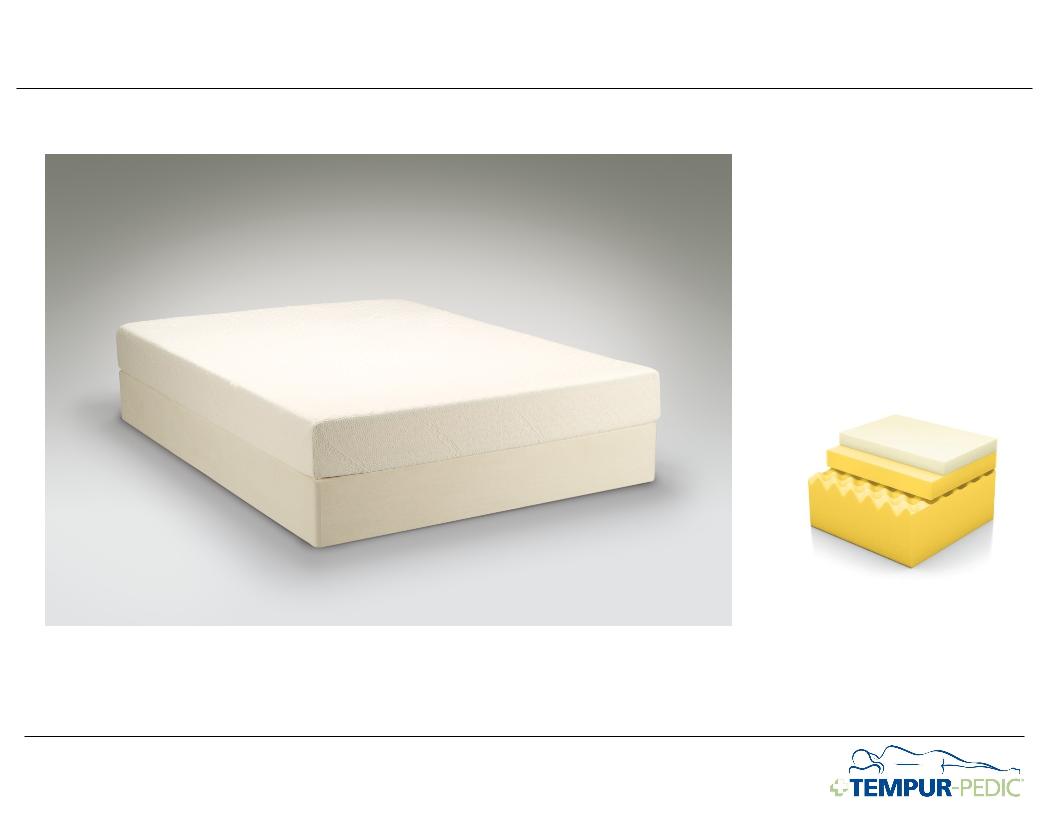
TEMPUR-Cloud™:
1st Quarter 2010
$1,499
Queen Mattress
Featuring
our latest formula, TEMPUR-ES™
44
TEMPUR®
Collection
featuring
TEMPUR®
material
on
top
AdvantageBed
ClassicBed
DeluxeBed
BellaFina
Bed
CelebrityBed
Firm
Initial Feel
Excellent
Pressure Relief
Very
Supportive
Also
Introduced An Improved Brand Architecture
TEMPUR-HD®
Collection
featuring
TEMPUR-HD
® material
on
top
RhapsodyBed
BellaSonna
Bed
AlluraBed
GrandBed
Medium
Soft Initial Feel
Ultimate
in Pressure Relief
Very
Supportive
TEMPUR-Cloud™
Collection
featuring
TEMPUR-ES
™
material
on
top
TEMPUR-Cloud™
TEMPUR-Cloud™
Supreme
TEMPUR-Cloud™
Luxe
Pillowy
Soft Initial Feel
Uniquely
Responsive
Very
Good Pressure Relief
Very
Supportive
Tempur-Pedic’s
unsurpassed SUPPORT Technology is always underneath.
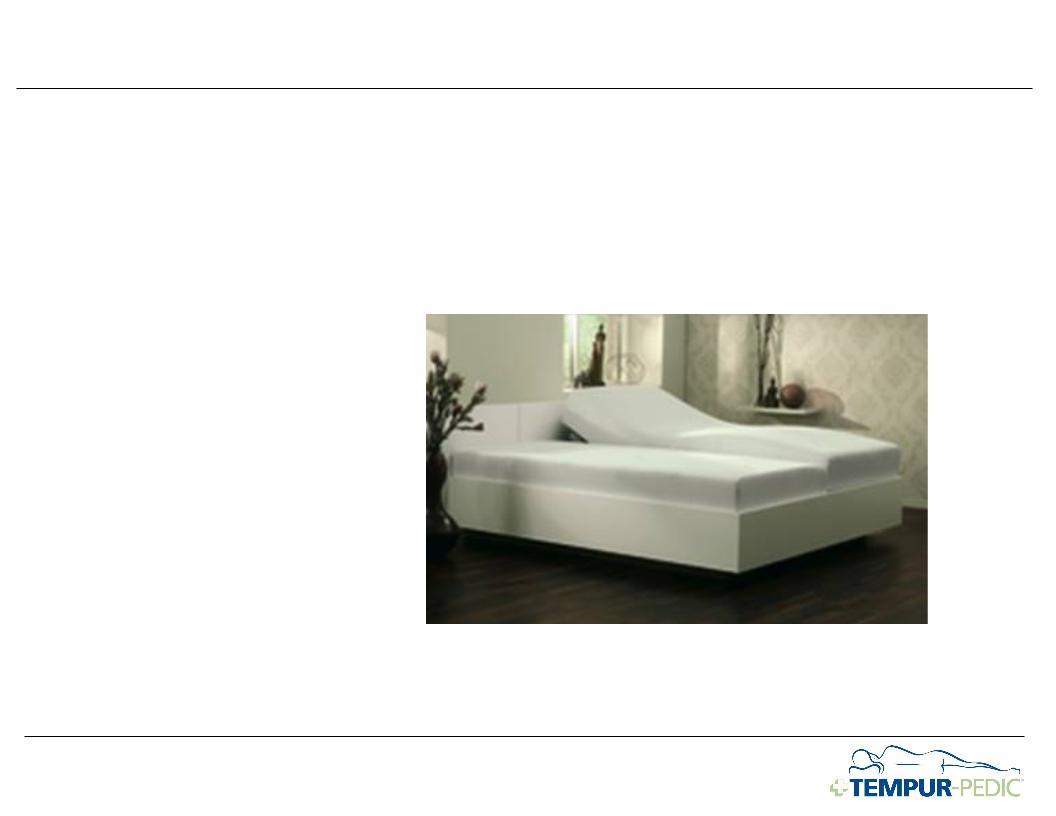
45
Our Sensation
mattress line has a unique, dynamic support base
We
Are Currently Working On Our Next Generation Of Products
And Product Improvements
And Product Improvements
u Our R&D teams
are capable of designing products for nearly any consumer
requirement
requirement
u We continue to use
consumer research as a foundation

46
1. “It’s too
expensive”
2. “It’s too
firm”
3. “It’s for ‘other
people’” (e.g. older, back pain, etc.)
Make
Sure There Is A Tempur Mattress And Pillow That Appeals
To Everyone
To Everyone
Why
isn’t Tempur-Pedic already the favorite mattress?

47
u Tempur-Pedic is
rightly associated with the relief its unique
support provides people with back and neck pain…
support provides people with back and neck pain…
u But, Tempur-Pedic
owners are extraordinarily satisfied - and the
satisfaction doesn’t vary by age or medical condition
satisfaction doesn’t vary by age or medical condition
u Furthermore, desire
for Tempur-Pedic beds is greatest among the
younger, fitter generations…!
younger, fitter generations…!
Tempur-Pedic
Is For Everyone
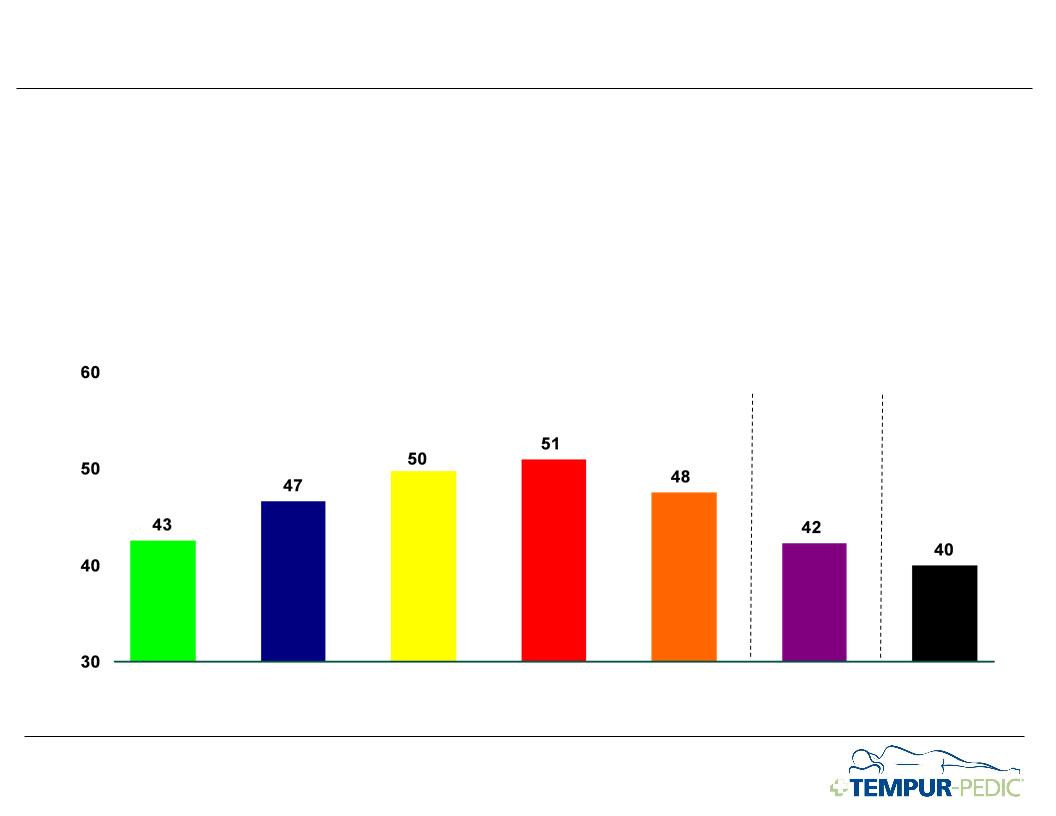
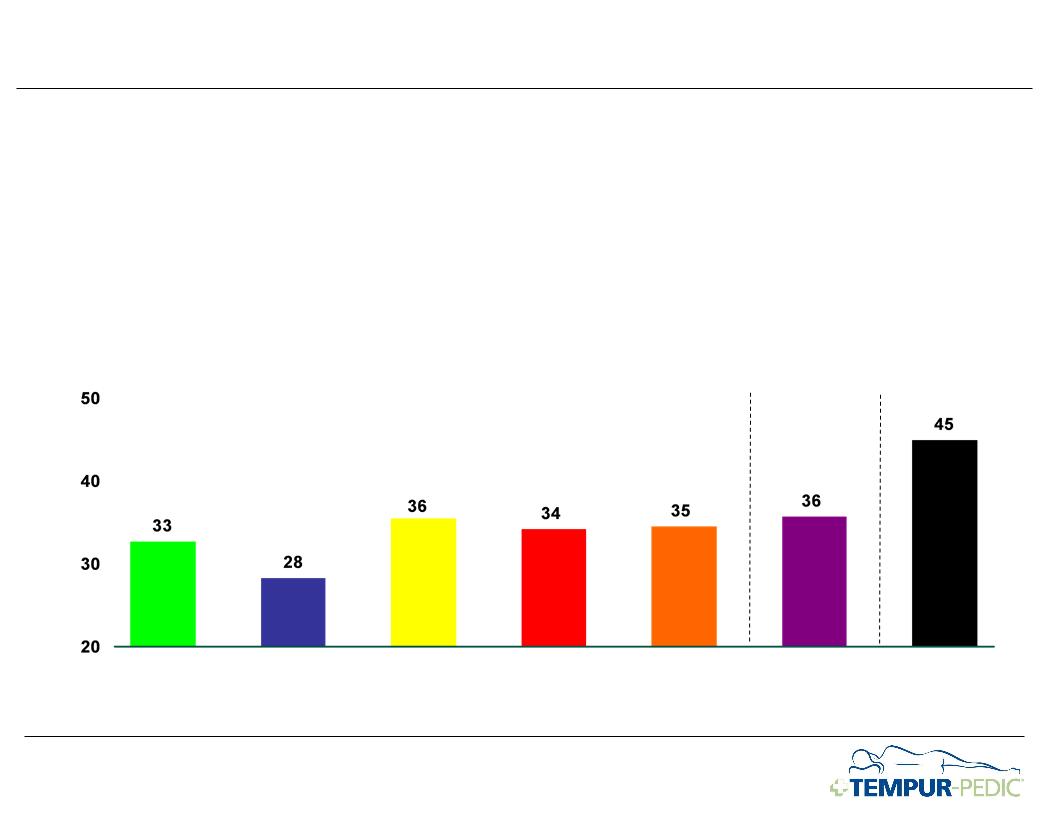
48
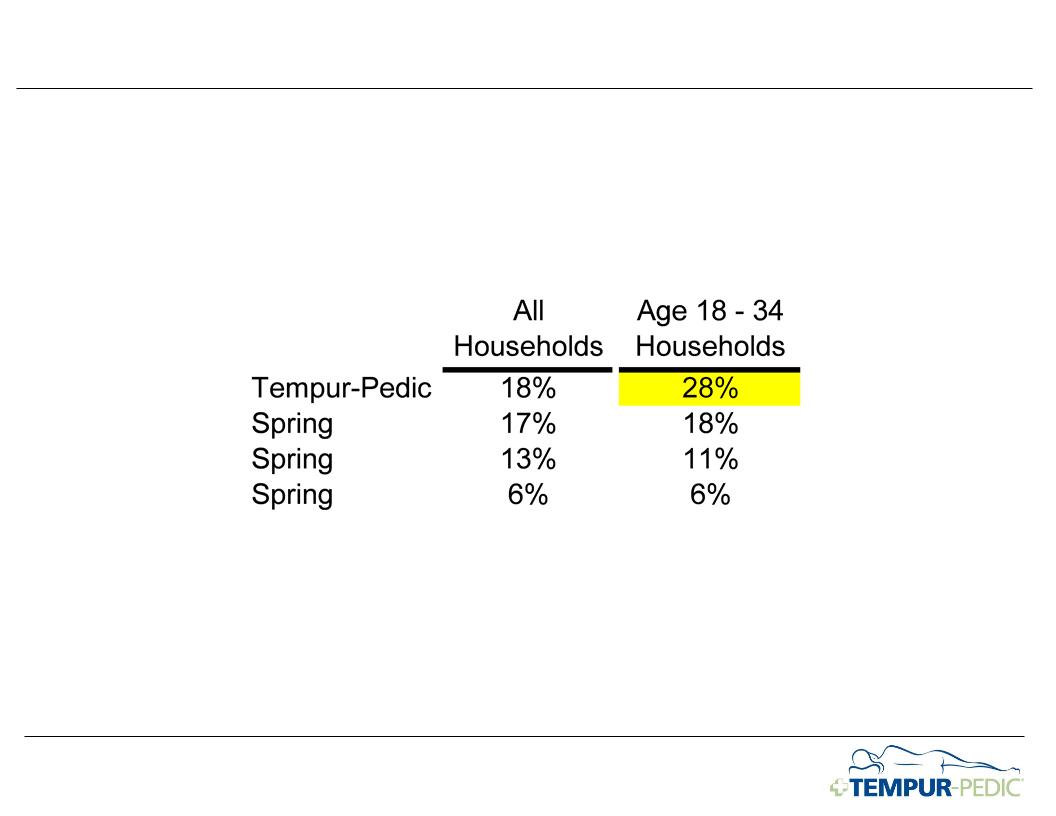
Brand
Consideration Is Strongest Among Younger Consumers
u Which
One
Brand
Are You Most Likely To Buy Next?
Source:
The 2008 and 2009 Gallup Consumer Mattress Market Study and
Update

49
People
who sleep on Tempur sleep better than those
who
don’t.
Our
goal is to become the world’s
favorite
mattress and pillow brand.
To
achieve our goal we will:
1. Make
sure everyone knows
they would sleep better on
Tempur
Tempur
2. Make sure there is a
Tempur mattress and pillow that appeals to everyone
3. Make sure that
Tempur is available to everyone
4. Make sure Tempur
continues to deliver the best sleep
Make
sure our cost structure is optimized to enable marketing and product
investments
Tempur
Vision

50
u On average,
Tempur-Pedic owners tell 14 people about their
mattress during their first year of ownership
mattress during their first year of ownership
u Consumers today
trust recommendations from friends, and even
strangers, more than advertising from businesses
strangers, more than advertising from businesses
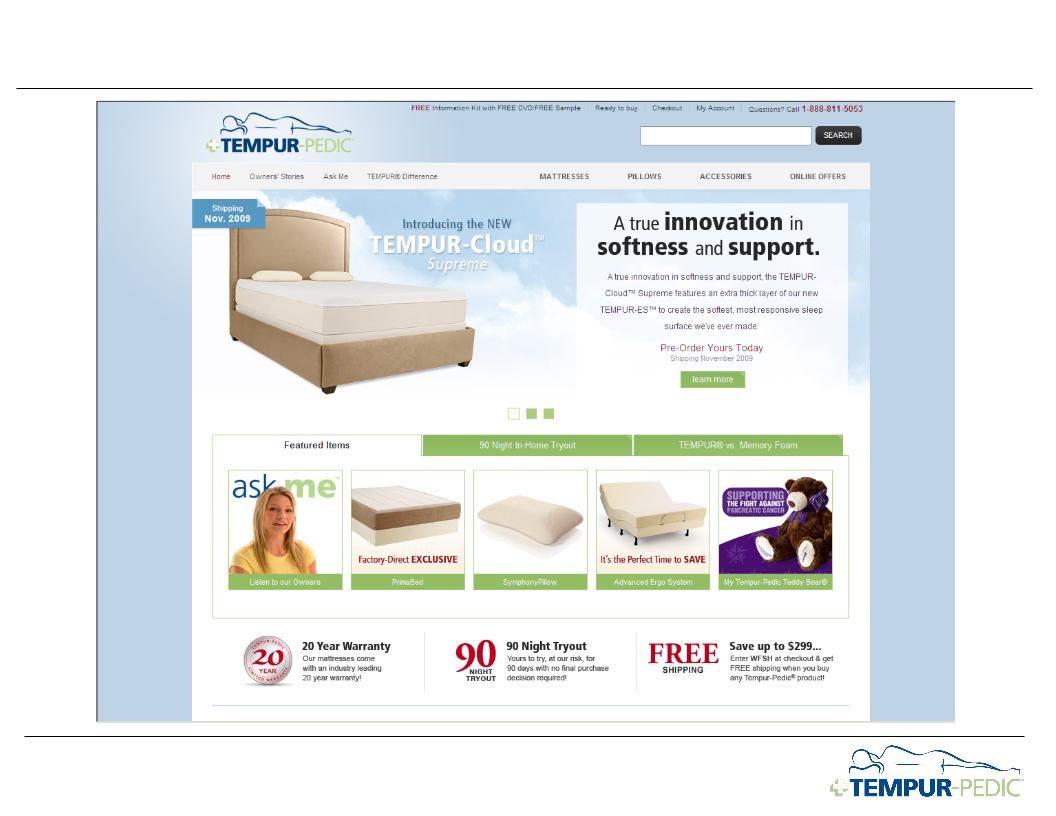
u New advertising
campaign designed to communicate that
Tempur-Pedic is for everybody….
Tempur-Pedic is for everybody….
Leveraging
The Passion Of Our Owners
Source:
2008 Tempur-Pedic Owners Study

51
Unleashing
The Power Of Owner Satisfaction & Recommendations

52
People
who sleep on Tempur sleep better than those
who
don’t.
Our
goal is to become the world’s
favorite
mattress and pillow brand.
To
achieve our goal we will:
1. Make sure everyone
knows they would sleep better on Tempur
2. Make sure there is a
Tempur mattress and pillow that appeals to everyone
3. Make
sure that Tempur is available to everyone
4. Make sure Tempur
continues to deliver the best sleep
Make
sure our cost structure is optimized to enable marketing and product
investments
Tempur
Vision

53
Make
Sure Tempur Is Available To Everyone
u Expanding
points of distribution
Ø Opportunity for
distribution growth in the US:
Ø Potentially 500 -
1,500 incremental doors
Ø Significant
opportunity for growth in other developed markets
Ø Potentially 1,500 -
2,000 incremental doors
Ø Currently laying
groundwork for growth in China and Eastern Europe
u Improving
Effectiveness of Distribution
Ø Continuing to
strengthen the effectiveness of our promotions
Ø Improving focus and
effectiveness of our sales force
Ø Increasing the
integration of retailer and Tempur advertising
Source:
The 2008 and 2009 Gallup Consumer Mattress Market Study and
Update
54
Make
Sure Tempur Is Available To Everyone

55
People
who sleep on Tempur sleep better than those
who
don’t.
Our
goal is to become the world’s
favorite
mattress and pillow brand.
To
achieve our goal we will:
1. Make sure everyone
knows they would sleep better on Tempur
2. Make sure there is a
Tempur mattress and pillow that appeals to everyone
3. Make sure that
Tempur is available to everyone
4. Make
sure Tempur continues to deliver the best sleep
Make
sure our cost structure is optimized to enable marketing and product
investments
Tempur
Vision
56
56
Make
Sure That Tempur Continues To Deliver The Best Sleep
uTempur is developing
new
technologies to accurately
measure the physical
characteristics of mattresses
technologies to accurately
measure the physical
characteristics of mattresses
uThis is correlated
with consumer
sensory research to set design
parameters for new materials and
mattresses
sensory research to set design
parameters for new materials and
mattresses

57

58
Dale Williams
Executive Vice President & Chief Financial Officer

59
TPX
Financial Overview
60
u Difficult economy
negatively affected revenues
u Trends improving for
two consecutive quarters
($
in millions)
For
a discussion of the Company’s performance, please refer to the Company’s press
release for 3Q09 results and the Company’s prior 10K and 10Q
filings.
2004
2005
2006
2007
2008
TTM
Sept 09
Sept 09
YTD
Sept 09
Sept 09
TPX
Net Sales
61
For
a discussion of the Company’s performance, please refer to the Company’s press
release for 3Q09 results and the Company’s prior 10K and 10Q
filings.
$213M
$373M
3Q09
YTD Sales
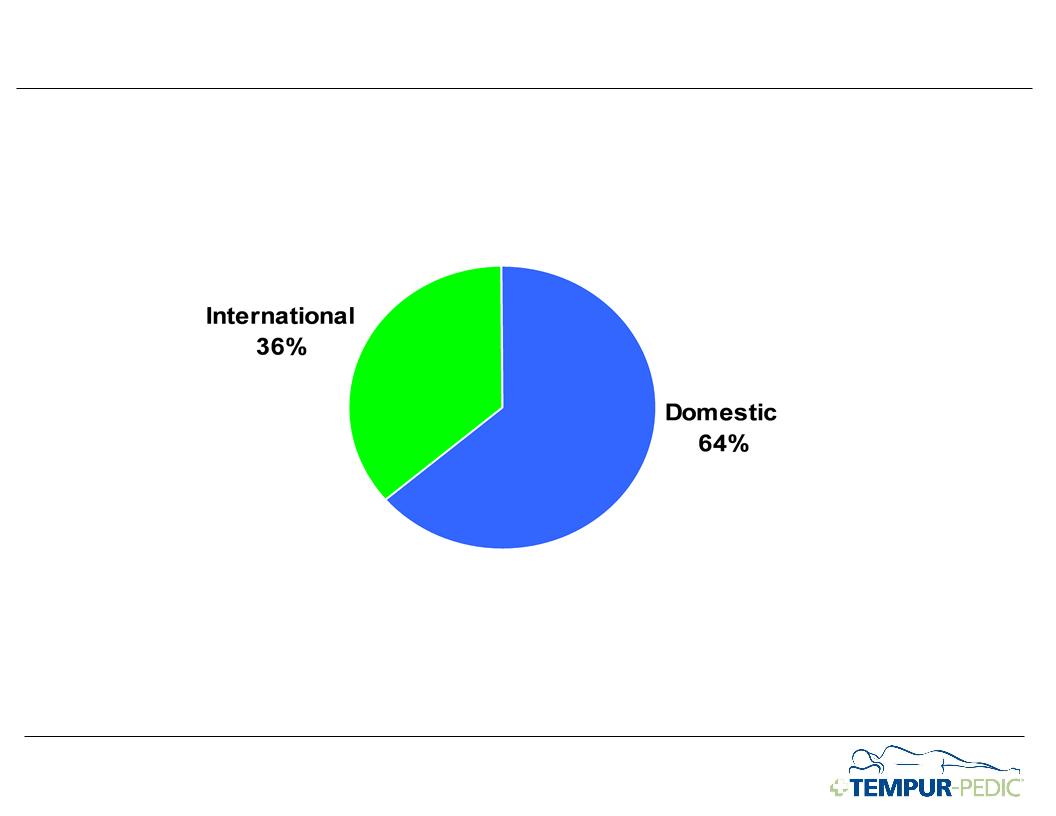
Significant
International Segment
62
International
Domestic
For
a discussion of the Company’s performance, please refer to the Company’s press
release for 3Q09 results and the Company’s prior 10K and 10Q
filings.
3Q09
YTD Sales
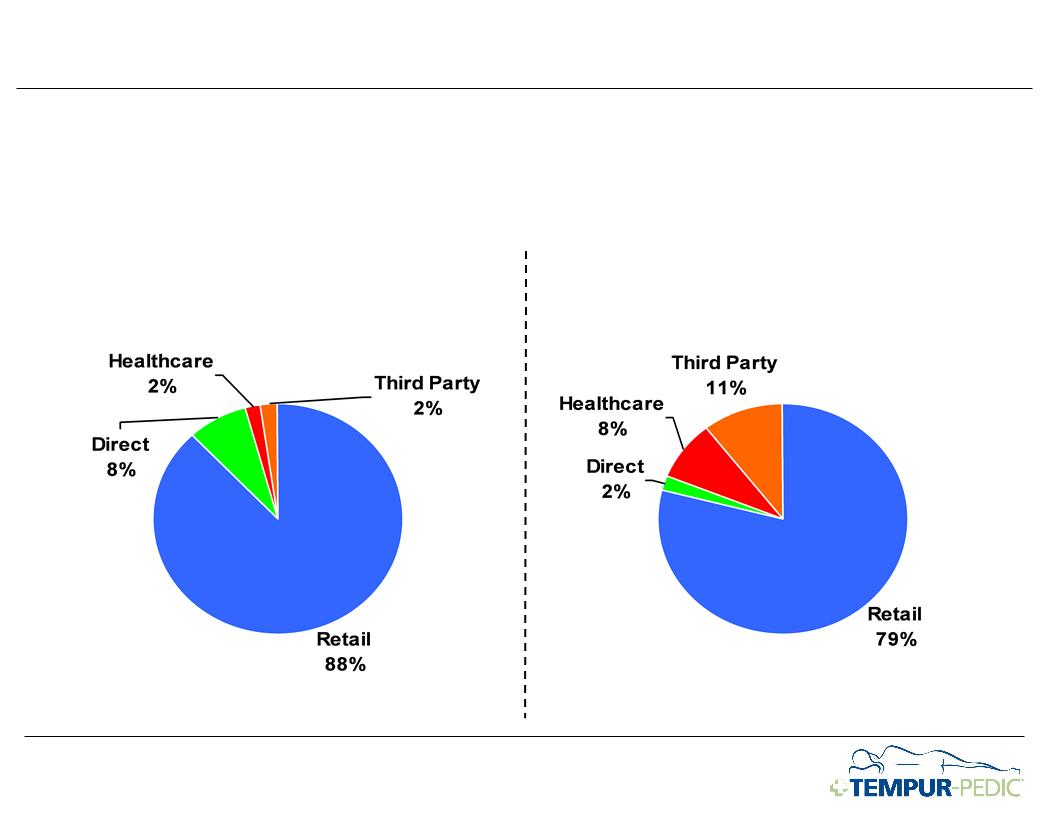
Sell
Globally Through Four Primary Channels
63
International
Domestic
For
a discussion of the Company’s performance, please refer to the Company’s press
release for 3Q09 results and the Company’s prior 10K and 10Q
filings.
3Q09
YTD Sales
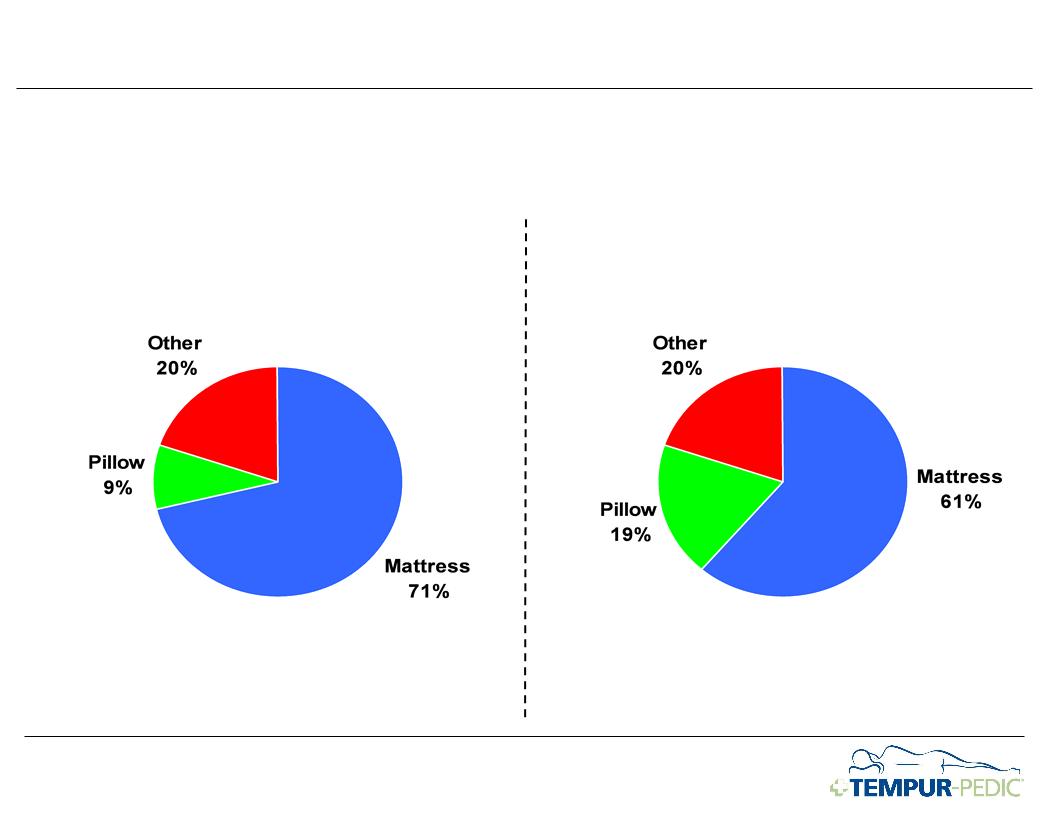
Mattresses
Drive Global Business, Yet Significant Revenue In Other
Product
Lines
Lines

64
Cost
Imperative: Make Sure Our Cost Structure Is Optimized To
Enable Marketing And Product Development Investments
Enable Marketing And Product Development Investments
u Achieve Gross Profit
of ~50% with Operating Margin at ~25% of Net sales
u Invest ~9% of sales
in advertising and ~1% of sales in R&D
u Optimize effective
tax rate
u Optimize the use of
all capital and maintain debt at conservative levels
65
u Channel and product
mix has historically been a source of margin pressure
u In 1st year of 4 year
productivity program to drive +700 basis points of margin
u We plan to invest in
our product line to drive value and continue our technological
leadership
leadership
For
a discussion of the Company’s performance, please refer to the Company’s press
release for 3Q09 results and the Company’s prior 10K and 10Q
filings.
2004
2005
2006
2007
2008
Long
Range
Target
Range
Target
3Q09
YTD
Sept 09
Sept 09
~50%
TPX
Gross Margin
66
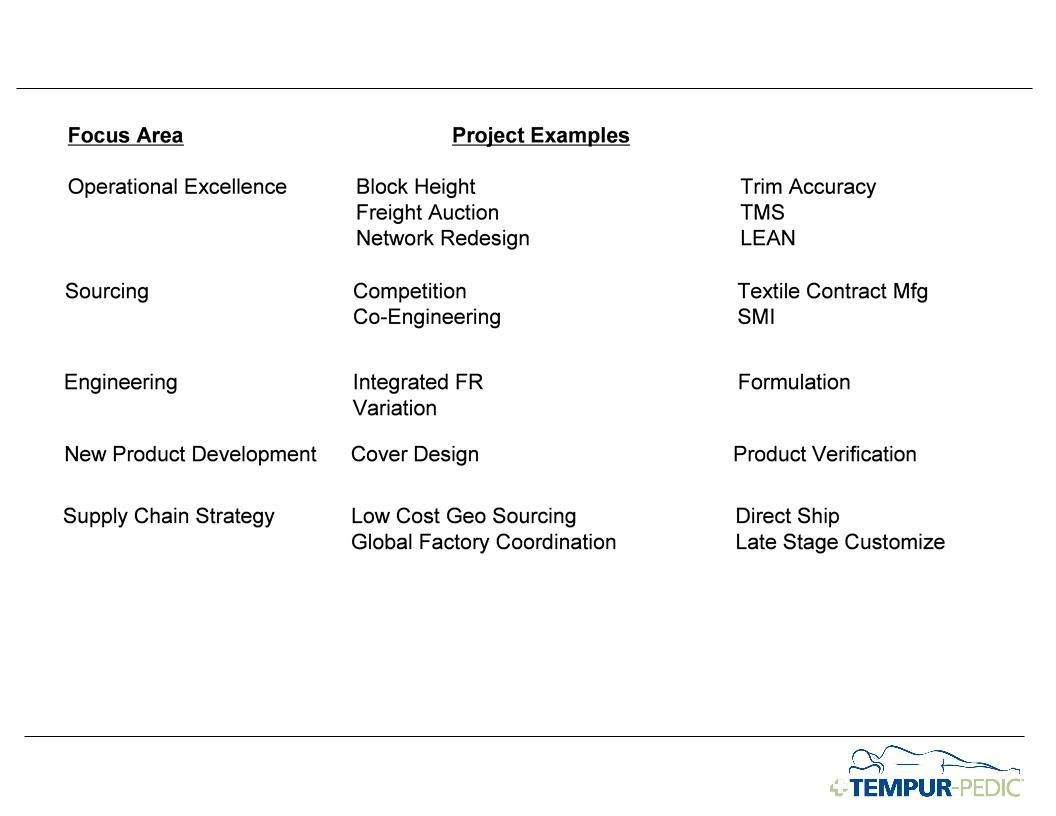
Significant
Effort Across The Business To Improve COGS
67
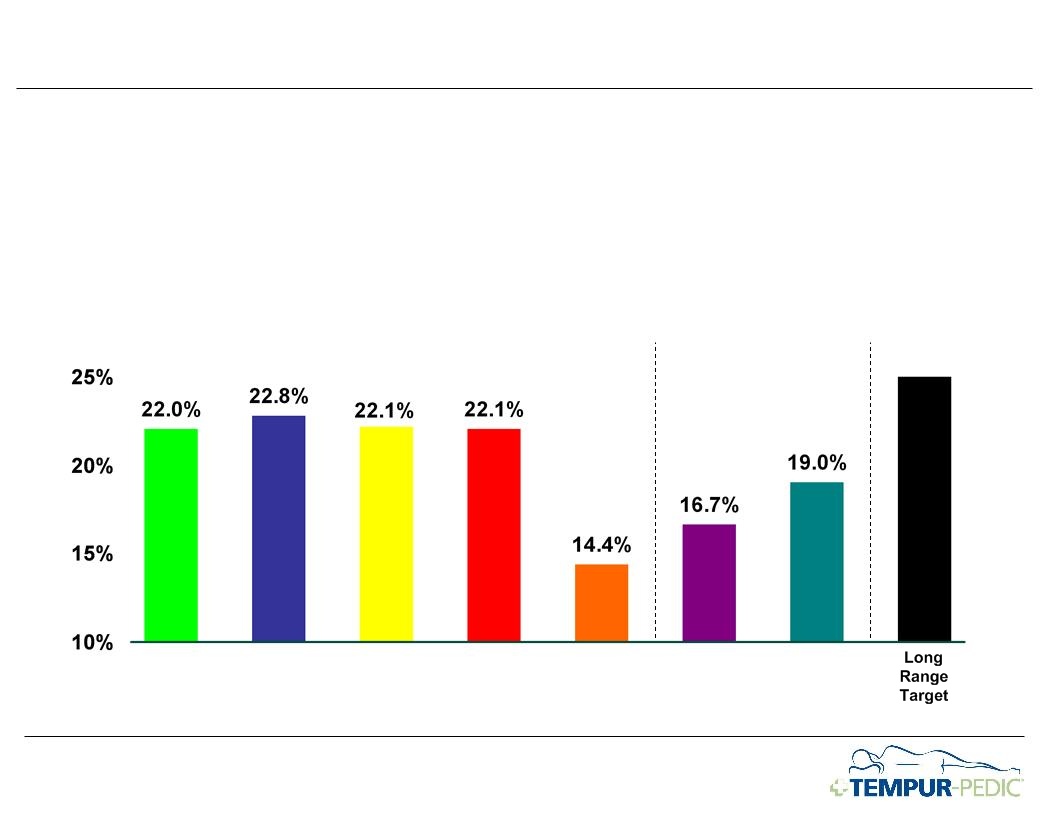
u Operating Margin has
been under pressure due to sales declines
u Over the long term,
our target for Operating Margin is ~25%
Ø Sales growth drives
leverage of fixed overheads in SG&A
Ø Maintain investment
in advertising and R&D
For
a discussion of the Company’s performance, please refer to the Company’s press
release for 3Q09 results and the Company’s prior 10K and 10Q
filings.
2004
2005
2006
2007
2008
Long
Range
Target
Range
Target
3Q09
YTD
Sept 09
Sept 09
~25%
TPX
Operating Margin

68
u We estimate our
manufacturing capacity is approximately $2.3 billion of net sales
u Based on current
plant utilization and net sales levels, believe we could triple
manufacturing output with existing plant capacity
manufacturing output with existing plant capacity
u In addition, see
opportunities to increase capacity ~5% annually above that without
significant additional capital expenditures
significant additional capital expenditures
u Implies strong
return on assets and invested capital
For
a discussion of the Company’s performance, please refer to the Company’s press
release for 3Q09 results and the Company’s prior 10K and 10Q
filings.
Manufacturing
Capacity In Place To Grow Sales ~3x
69
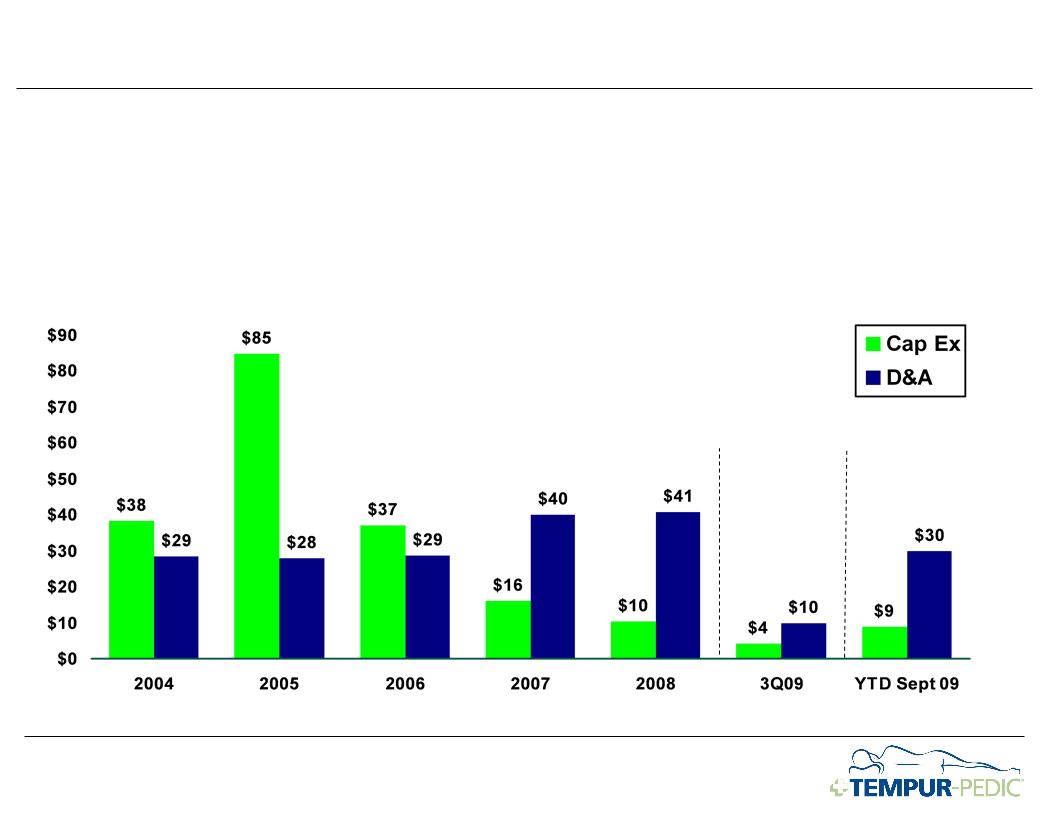
u Multi-year add back
to Net Income as Depreciation and Amortization should exceed
Capital Expenditures
Capital Expenditures
u Invested in
manufacturing footprint 2001-2006
u Anticipate annual
capital expenditures of $20 million or less for the foreseeable
future
($
in millions)
For
a discussion of the Company’s performance, please refer to the Company’s press
release for 3Q09 results and the Company’s prior 10K and 10Q
filings.
Depreciation
& Amortization vs. Capital Expenditures
For
a discussion of the Company’s performance, please refer to the Company’s press
release for 3Q09 results and the Company’s prior 10K and 10Q
filings.
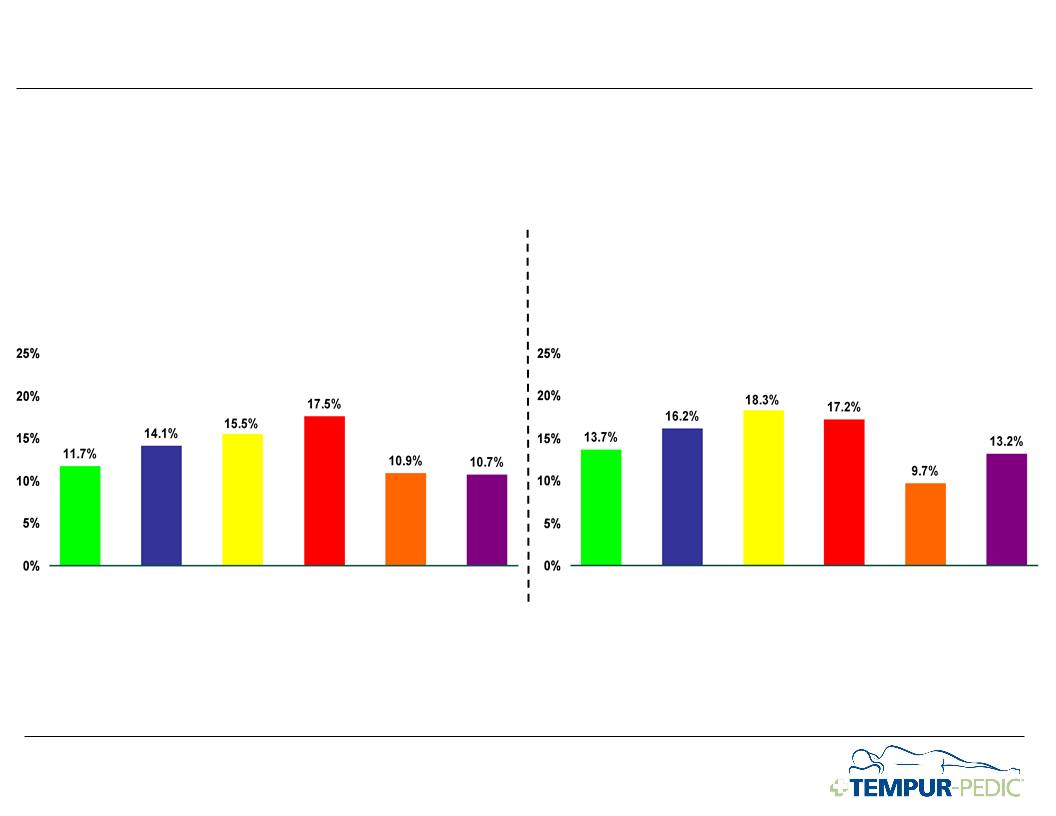
Note:
For a reconciliation of 2008 Adjusted Net Income, Return on Assets, Return on
Invested Capital and a reconciliation of non-GAAP to GAAP financial
measures,
please see Appendix of this presentation.
please see Appendix of this presentation.
2004
*
*
2005
2006
2007
2008
TTM
Sept 09
Sept 09
2004
*
*
2005
2006
2007
2008
TTM
Sept 09
Sept 09
Return
on Assets
Return
on Invested Capital
Low
Levels Of Capital Should Drive High Returns Going
Forward

71
u We are focused on
driving working capital
u Significant
opportunities exist over the long term
u Long term goal of 25
day cash cycle
We
Are Focused On Driving Balance Sheet Metrics
72
u Strict credit
policies
u Will continue to
drive future improvements
For
a discussion of the Company’s performance, please refer to the Company’s press
release for 3Q09 results and the Company’s prior 10K and 10Q
filings.
2004
2005
2006
2007
2008
Long
Range
Target
Range
Target
3Q09
Days
Sales Outstanding
73
u Have been taking
early pay discounts, which shortens payables cycle è longer
term, see opportunities to extend
term, see opportunities to extend
For
a discussion of the Company’s performance, please refer to the Company’s press
release for 3Q09 results and the Company’s prior 10K and 10Q
filings.
2004
2005
2006
2007
2008
Long
Range
Target
Range
Target
3Q09
Days
Payable
74
u Significant
improvement in Inventory investment
u Optimizing
distribution network to drive further improvement
u Inventory too low as
of 3Q09 è Plan to modestly
increase inventory in 4Q09
For
a discussion of the Company’s performance, please refer to the Company’s press
release for 3Q09 results and the Company’s prior 10K and 10Q
filings.
2004
2005
2006
2007
2008
Long
Range
Target
Range
Target
3Q09
Days
Inventory
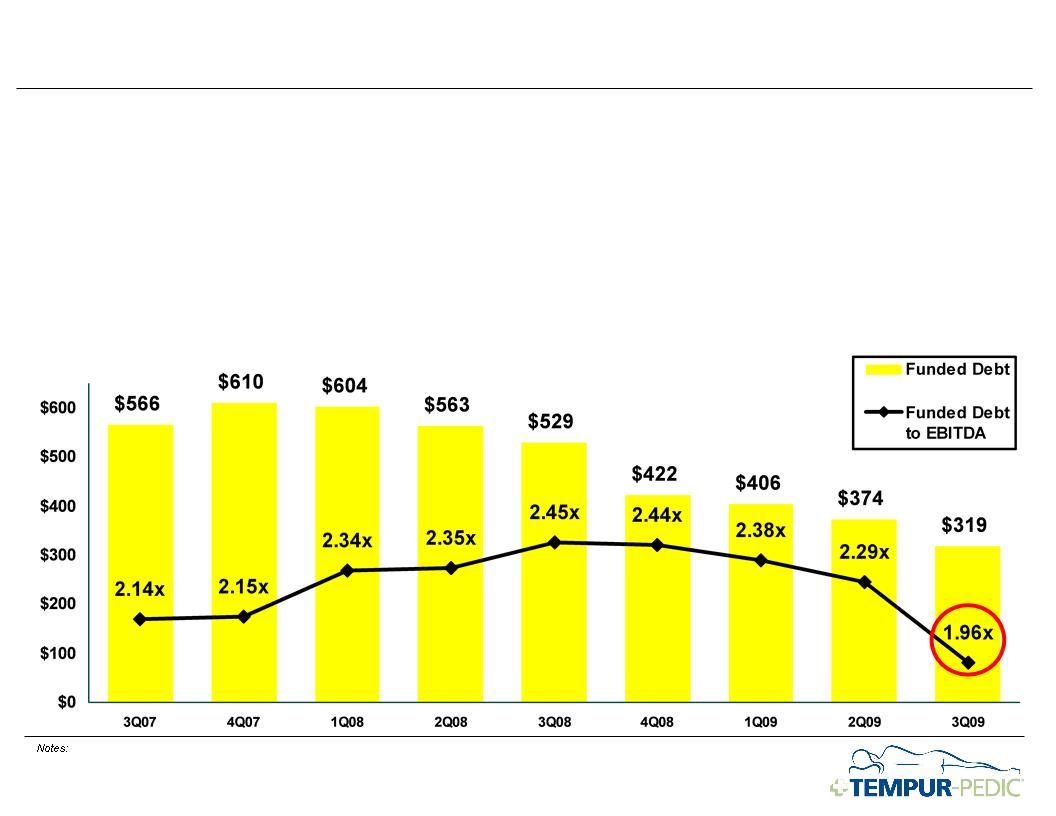
1. For
a discussion of the Company’s performance, please refer to the Company’s press
release for 3Q09 results and the Company’s prior 10K and 10Q
filings
2. Please
see Appendix A to this presentation for a
reconciliation of GAAP to Non-GAAP measures and calculation of Funded Debt to
EBITDA ratio.
u 3.0x covenant
through July 2012 (maturity)
u Substantial covenant
cushion
($
in millions)
Funded
Debt to EBITDA Covenant

76
Note
1: For a discussion of the Company’s performance, please refer to the Company’s
press release for 3Q09 results and the Company’s prior 10K and 10Q
filings
Note
2: Management estimates and assumptions.
u We believe the
actions we have taken have substantially improved our
profitability
profitability
u Ongoing productivity
program will be supplemented with volume leverage
Ø Targeting Gross
Profit Margin to expand to 50% vs. 48.3% in ‘07
u At increasing rates
of sales, we expect margins to expand
Ø Targeting Operating
Profit Margin to expand to 25% vs. 22.1% in ‘07
Ø Driven by Gross
Profit Margin expansion and fixed cost leverage of
operating expenses
operating expenses
u Improved Capital
Structure results in lower interest expense
Ø Run rate ~1/2 of ’07
interest cost
Enhanced
Earnings Power In Our Business Model


78
Appendix
79
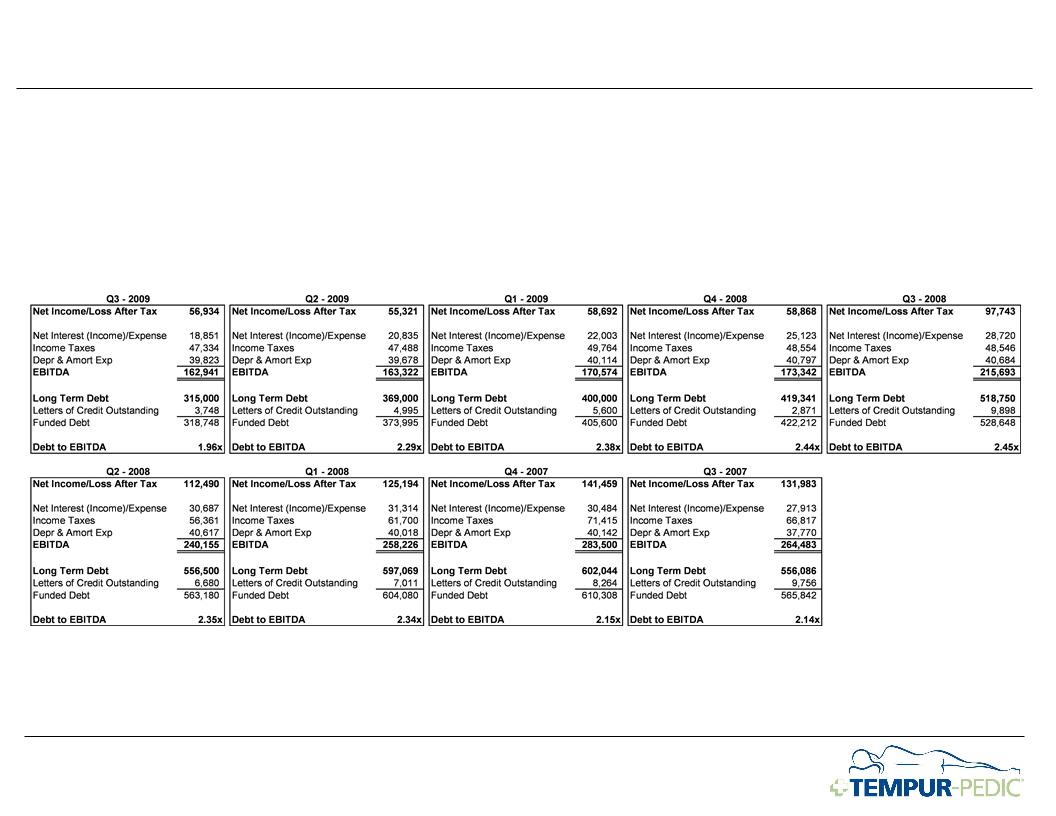
Reconciliation
of EBITDA to Net Income and Funded debt to Total debt
Non-GAAP
Measures
The
Company provides information regarding EBITDA and Funded debt which are not
recognized terms under GAAP (Generally Accepted Accounting
Principles) and do not purport to be alternatives to Net income as a measure of operating performance or Total debt. Because not all companies use
identical calculations, these presentations may not be comparable to other similarly titled measures of other companies. A reconciliation of EBITDA to the
Company’s Net income and a reconciliation of Funded debt to Total debt are provided below. Management believes that the use of these non-GAAP
financial measures provides investors with additional useful information with respect to the terms of the Company’s credit facility.
The
following tables set forth the reconciliation of the Company’s reported Net
income to the calculation of EBITDA and the reconciliation of the
Company’s reported Total debt to the calculation of Funded debt:
Company’s reported Total debt to the calculation of Funded debt:
GAAP
To Non-GAAP Reconciliations - Funded Debt / EBITDA
80
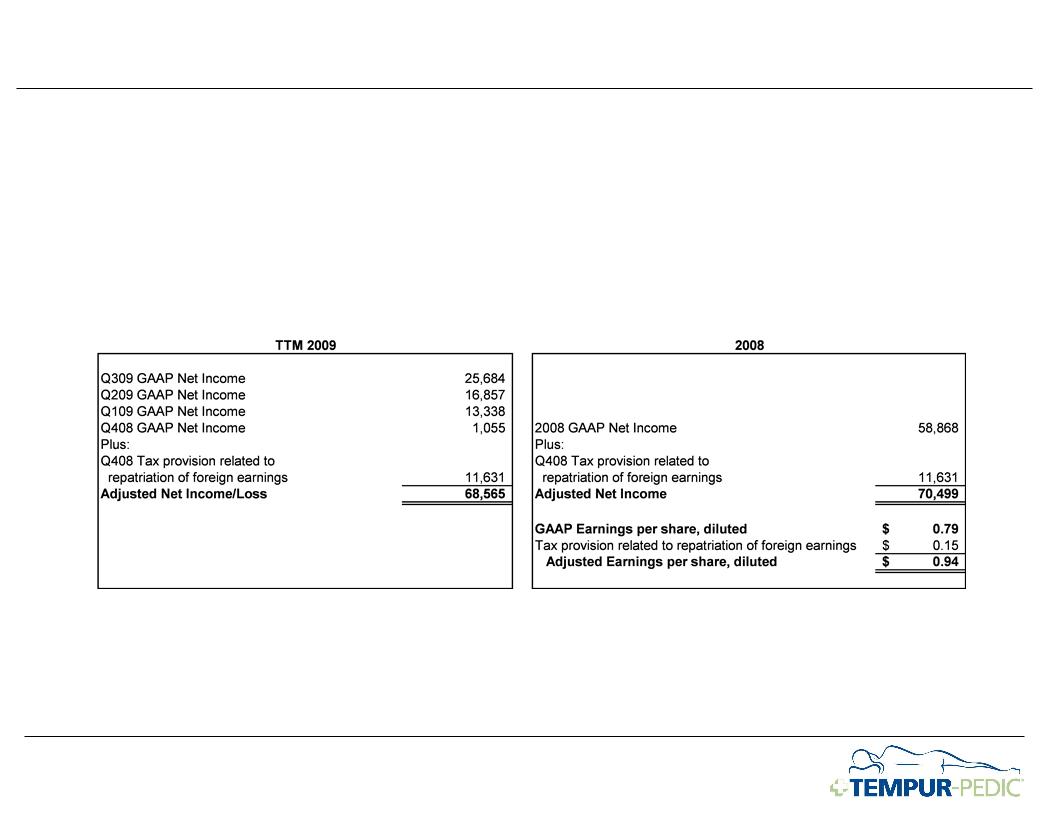
Reconciliation of
Adjusted Net Income to Net Income TTM 2009 and 2008 and Adjusted Earnings Per
Share for 2008
Non-GAAP
Measures
The
Company provides information regarding Adjusted Net income and Adjusted Earnings
per share which are not recognized terms under GAAP
(Generally Accepted Accounting Principles) and do not purport to be alternatives to Net income and Earnings per share as a measure of operating
performance. Because not all companies use identical calculations, these presentations may not be comparable to other similarly titled measures of other
companies. A reconciliation of Adjusted Net income and Adjusted Earnings per share to the Company’s Net income and Earnings per share is provided
below. Management believes that the use of these non-GAAP financial measures provides investors with additional useful information with respect to the
impact of the repatriation of foreign earnings.
The
following table sets forth the reconciliation of the Company’s reported Net
income to the calculation of Adjusted Net income for the trailing nine
months ending September 30, 2009 and twelve months ended December 31, 2008 and the reconciliation of the Company’s reported Earnings per share
to the calculation of Adjusted Earnings per share for the twelve months ended December 31, 2008.
months ending September 30, 2009 and twelve months ended December 31, 2008 and the reconciliation of the Company’s reported Earnings per share
to the calculation of Adjusted Earnings per share for the twelve months ended December 31, 2008.
GAAP
To Non-GAAP Reconciliations - Net Income and Earnings
Per Share
Per Share
81
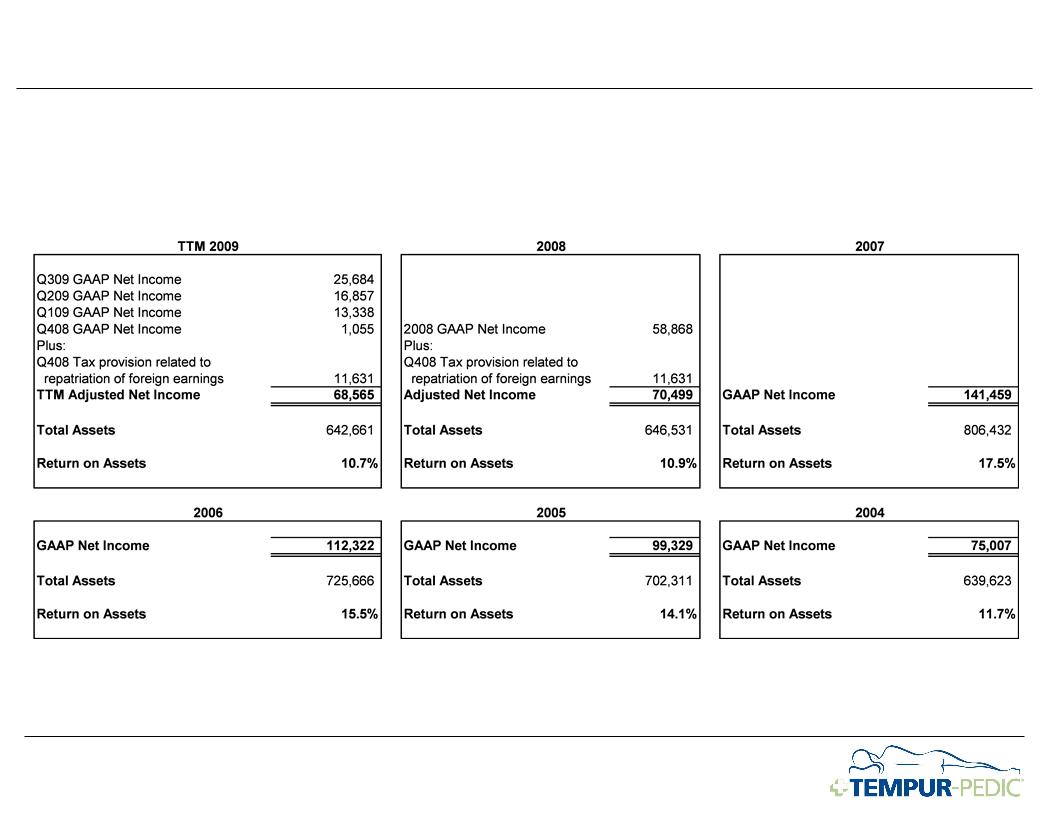
The
Company provides information regarding Return on Assets as the Company believes
it provides investors with
useful information. Return on Assets is calculated by dividing Net Income/Loss by Total Assets as reported in the
Company's 10K and 10Q filings. No adjustment for dividends was made in this calculation. See the GAAP to Non-GAAP
Reconciliation for a reconciliation of Adjusted Net Income in 2008.
useful information. Return on Assets is calculated by dividing Net Income/Loss by Total Assets as reported in the
Company's 10K and 10Q filings. No adjustment for dividends was made in this calculation. See the GAAP to Non-GAAP
Reconciliation for a reconciliation of Adjusted Net Income in 2008.
Calculation
Of Return On Assets
82
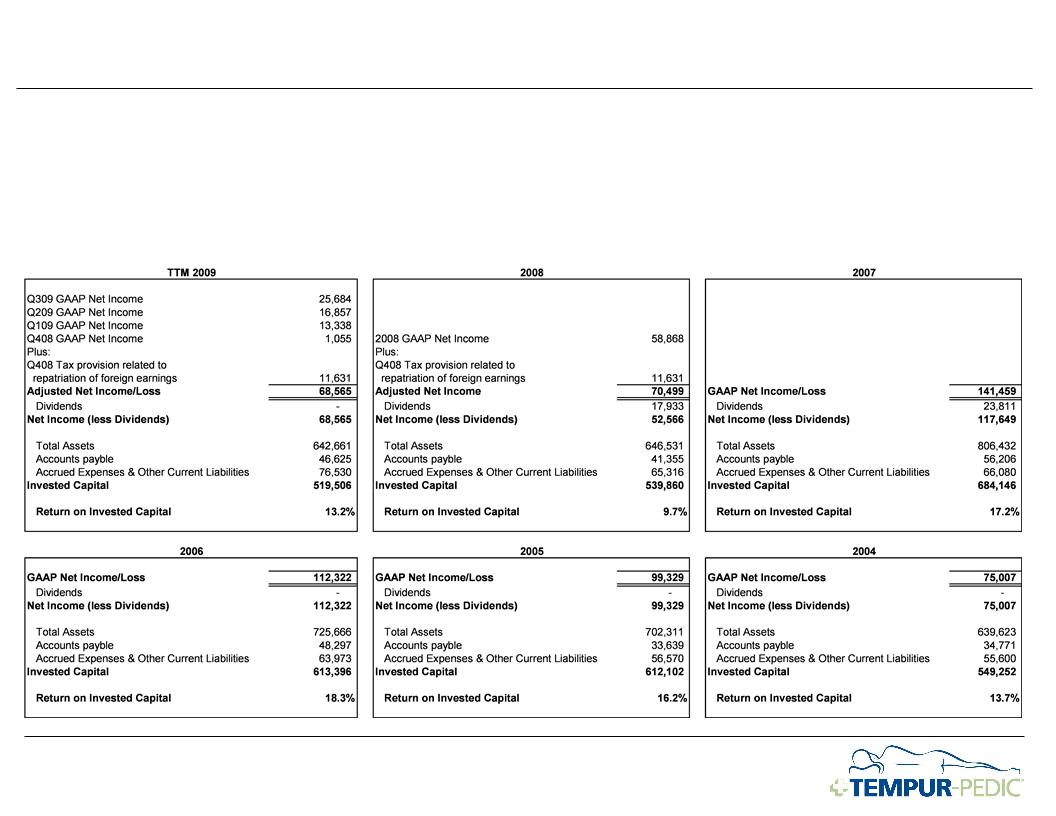
The
Company provides information regarding Return on Invested Capital as the Company
believes it provides investors
with useful information. We consider our Invested Capital to be Total Assets less Accounts Payable and Accrued
Expenses & Other Current Liabilities as reported in the company's 10K and 10Q filings. Return on Invested Capital is
calculated by dividing Net Income/Loss (less any dividends) by Invested Capital. See the GAAP to Non-GAAP
Reconciliation for a reconciliation of Adjusted Net Income in 2008.
Calculation
Of Return On Invested Capital