Attached files
 2009
Third-Quarter Results 22 October 2009 Exhibit 99.3 |
 Philip Morris
International 2 Introduction Introduction Unless otherwise stated, we will be talking about results in the third quarter 2009 and comparing them with the same period in 2008 References to PMI volumes refer to shipment data Industry volume and market shares are sourced from A.C. Nielsen, other third party sources and internal estimates Organic volume refers to volume excluding acquisitions Net revenues exclude excise taxes Data tables showing adjustments to revenues and Operating Companies Income (OCI) for currency and acquisitions, adjustments to EPS, and other reconciliations to U.S. GAAP measures are at the end of today’s web cast slides and are posted on our web site |
| Philip Morris
International 3 Forward-Looking and Cautionary Statements Forward-Looking and Cautionary Statements This presentation and related discussion contain statements that, to the extent they do not relate strictly to historical or current facts, constitute “forward-looking statements” within the meaning of the Private Securities Litigation Reform Act of 1995. Such forward- looking statements are based on current plans, estimates and expectations, and are not guarantees of future performance. They are based on management’s expectations that involve a number of business risks and uncertainties, any of which could cause actual results to differ materially from those expressed in or implied by the forward-looking statements. PMI undertakes no obligation to publicly update or revise any forward-looking statements, except in the normal course of its public disclosure obligations. The risks and uncertainties relating to the forward-looking statements in this presentation include those described under Item 1A. “Risk Factors” in PMI’s Form 10-K for the year ended December 31, 2008, and Form 10-Q for the quarter ended June 30, 2009, filed with the Securities and Exchange Commission. |
 Philip Morris
International 4 Third-Quarter 2009 Results Third-Quarter 2009 Results Excluding 18.3% 13.7% 6.9% Currency - % 0.93 Adjusted Diluted EPS ($ / share) 10.6% (1.5)% 2.9 Adjusted OCI ($ billion) (b) 4.1% (5.3)% 6.6 Net Revenues ($ billion) (a) (4.0)% (2.9)% 219.3 Cigarette Volume (units billion) Currency & Acquisitions Increase / (Decrease) Q3, 2009 Growth Q3, 2009 vs. Q3, 2008 (a) Excluding excise taxes (b) Less asset impairment and exit costs Source: PMI Financials |
 Philip Morris
International 5 2009 Results 2009 Results 2009 Growth Rates Q3 Q2 Q1 YTD Sept (4.0)% (1.1)% (1.1)% (2.1)% 1 % Cigarette Volume (a) Mid to Long-Term Growth Targets (a) Excluding acquisitions Source: PMI Financials |
 Philip Morris
International 6 2009 Results 2009 Results 2009 Growth Rates Q3 (d) Q2 (d) Q1 (d) YTD Sept 18.3 % 17.2 % 11.3 % 15.4 % 10 – 12 % Adjusted Diluted EPS (c) 10.6 % 9.5 % 5.3 % 8.6 % 6 – 8 % Adjusted OCI (b) 4.1 % 6.1 % 3.9 % 4.7 % 4 – 6 % Net Revenues (a)(b) Mid to Long-Term Growth Targets (a) Excluding excise taxes (b) Excluding currency and acquisitions (c) Excluding currency (d) Please see relevant quarterly reconciliation slides, posted on our web site Source: PMI Financials |
 Philip Morris
International 7 2009 EPS Guidance 2009 EPS Guidance Revised guidance: $3.20 - $3.25 Previous guidance: $3.10 - $3.20 Revised guidance represents both an
increase and a narrowing of the range Increased guidance reflects both the strength of our underlying business and slightly more favorable exchange rates Source: PMI Financials |
 Philip Morris
International 8 Pricing Pricing In 2009, PMI implemented price increases notably in: Pricing variance was $590 million in the third quarter of 2009 and $1.5 billion YTD September 2009 Argentina Brazil Canada Dominican Rep. Australia Indonesia Pakistan Philippines Thailand Romania Russia South Africa Turkey Ukraine Germany Italy Poland Spain UK LA & Canada Asia EEMA EU Source: PMI Financials |
 Philip Morris
International 9 Consumer Behavior Consumer Behavior Consumer behavior has remained resilient Consumer downtrading has remained globally manageable though the impact has been substantial in Russia, Spain and Ukraine Ukraine downturn exacerbated by very significant excise tax increases Positive trends continue in other emerging markets, such as Argentina, Indonesia and Mexico Sharp rises in unemployment are key economic indicator Source: PMI Financials and PMI estimates |
 Philip Morris
International 10 Excise Taxes and VAT Excise Taxes and VAT Governments treating excise taxes rationally in 2009 (key exceptions: Brazil and Ukraine) Rational approach expected to continue in 2010 Although we expect some VAT increases, as well as excise tax increases, next year, as governments seek to boost revenues, we expect them to remain globally manageable |
 Philip Morris
International 11 Volume Analysis Volume Analysis Organic volume decline in Q3, 2009, is not representative of expected full-year performance Nearly two thirds of Q3, 2009, organic volume decline can be attributed to: – Ukraine: market disruption resulting from massive excise tax driven price increase in May – Spain: recession and price increases, exacerbated by weak tourism and the impact of unfavorable distributor inventory movements on PMI shipments – Pakistan: trade inventory movements subsequent to the excise tax increase of June 2009 Source: PMI Financials and PMI estimates |
 Philip Morris
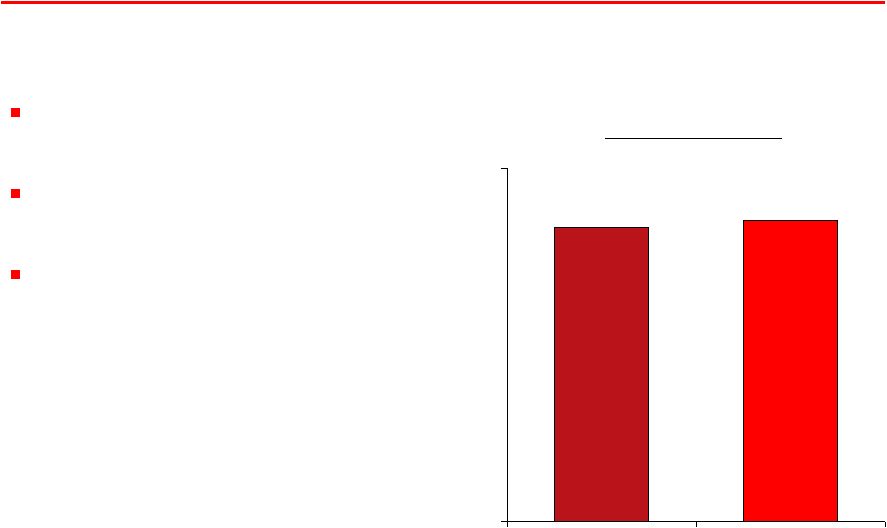
International 12 Russia Russia PMI Market Share Total market trending down 3-4% in 2009 PMI shipments in Q3, 2009, decreased by just 0.8% PMI market share in Q3, 2009, was up 0.6 pp to 25.6%: – growth of Bond Street in the value and Optima in the low price segment – resilience of Parliament – overall strength and range of brand portfolio Source: A.C. Nielsen, PMI estimates and PMI Financials (%) 25.0 25.6 0 30 Q3, 2008 Q3, 2009 |
 Philip Morris
International 13 Indonesia Indonesia Total industry growing by 3-4% in 2009 Timing of Ramadan resulted in PMI volume decline of 1.1% in Q3, 2009 A Mild continued to gain share, up 0.5 pp to 10.7% in July/Aug 2009 OCI increased at double-digit rate, excluding currency, in Q3, 2009 Source: AC Nielsen, PMI estimates and PMI Financials |
 Philip Morris
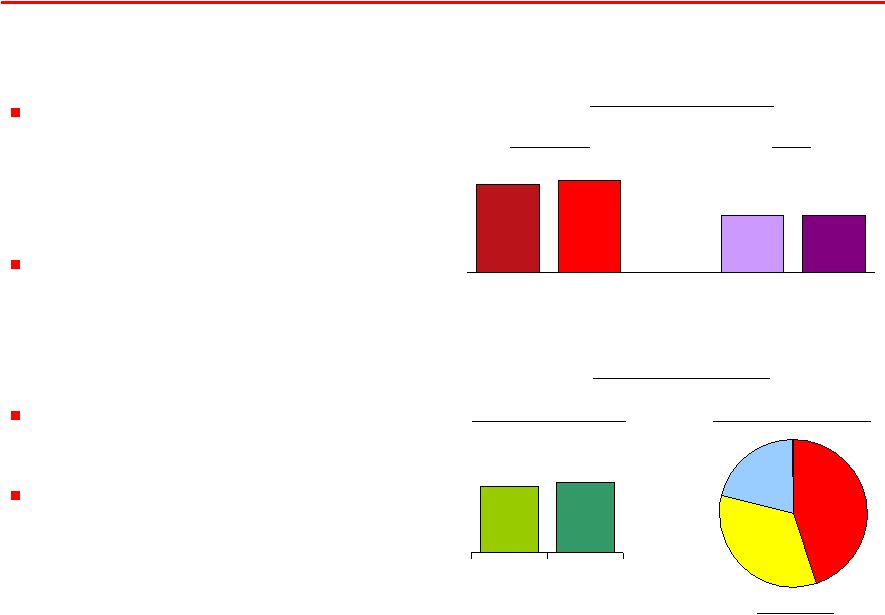
International 14 22.1 23.2 Q3 2008 Q3 2009 45% 34% 21% 10.2 10.6 6.6 6.6 Q3 2008 Q3 2009 Q3 2008 Q3 2009 Japan Japan JT PMI BAT Menthol SoM (%) Menthol Segment Market Shares (%) Source: Tobacco Institute of Japan and PMI estimates Share of Segment Marlboro Lark Q3, 2009 Marlboro growth driven by success of Marlboro Black Menthol and Marlboro Filter Plus National roll-out of Lark Mint Splash, as well as Lark Classic Milds, helping to stabilize the brand Total market down 3.0% in Q3, 2009 No decisions yet on tobacco issues by new Japanese government |
 Philip Morris
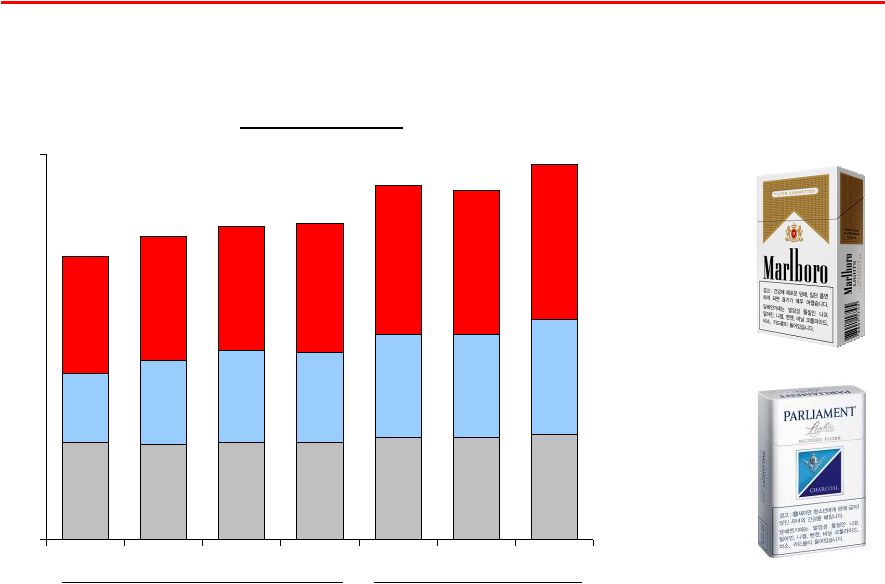
International 15 2.7 3.3 3.6 3.5 4.0 4.0 4.5 4.5 4.8 4.8 5.0 5.8 5.6 6.0 11.0 11.8 12.2 12.3 13.8 13.6 14.6 0 15 Q1 Q2 Q3 Q4 Q1 Q2 Q3 Korea Korea (%) Market Shares Parliament Marlboro PMI Total 2008 2009 Source: PMI estimates Other |
 Philip Morris
International 16 European Union Region European Union Region Improved financial performance with adjusted OCI excluding currency and acquisitions up 5.3% in Q3, 2009 Key driver is pricing, notably in Germany and Spain Adjusted OCI margin excluding currency reached 52.2% in Q3, 2009, up 2.2 pp Market share down slightly by 0.2 pp to 38.9%: – Marlboro share decline in France, Germany and Spain – L&M share gains in Germany, Poland and Spain Roll-out across EU Region of innovations behind Marlboro expected to help improve the brand going forward Source: PMI Financials, A.C. Nielsen and PMI estimates |
 Philip Morris
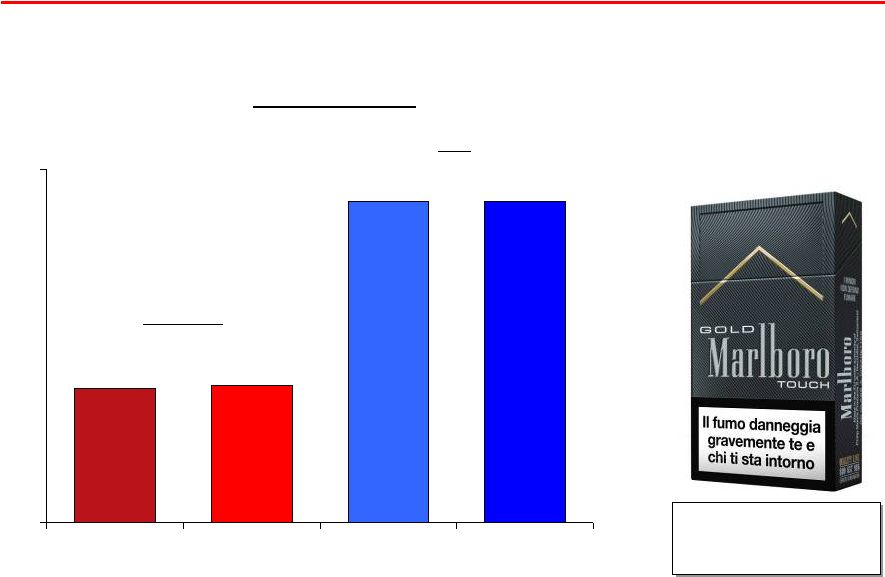
International 17 22.6 23.1 54.5 54.5 0 60 Q3 Q3 Q3 Q3 Italy Italy (%) Market Shares PMI Marlboro 2008 2009 2008 2009 Source: PMI estimates 1.4% market share in Q3, 2009 |
 Philip Morris
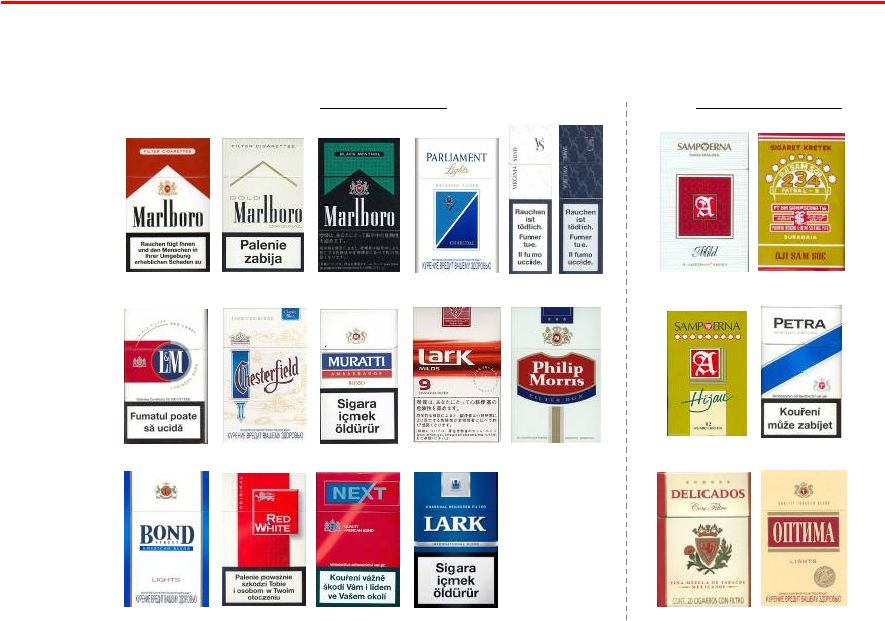
International 18 Brand Portfolio Brand Portfolio Mid Price Premium & Above Local Heritage International Low Price |
 Philip Morris
International 19 Marlboro Marlboro Architecture Architecture “Smooth taste and style” “Fresh taste sensations” Red Gold Fresh “Flavor enjoyment” |
 Philip Morris
International 20 Marlboro Marlboro Architecture Architecture “Flavor enjoyment” Line extensions in 34 markets “Smooth taste and style” Line extensions in 17 markets “Fresh taste sensations” Line extensions in 33 markets Red Gold Fresh |
 Philip Morris
International 21 Red Line: Marlboro Filter / Flavor Plus Red Line: Marlboro Filter / Flavor Plus Tobacco included in filter to enhance flavor Innovative sliding pack Market shares (July/Aug): – Romania 2.4% – Kuwait 2.3% – Paraguay 1.8% – Kazakhstan 1.3% Source: AC Nielsen, PMI estimates and Business Analytica |
 Philip Morris
International 22 Marlboro Gold Marlboro Gold |
 Philip Morris
International 23 Fresh Line: Marlboro Black Menthol Fresh Line: Marlboro Black Menthol Available at different tar levels Refreshing high menthol content Attractive pack Market shares in Q3, 2009: – Hong Kong 3.3% – Japan 1.4% Launched this year also in Indonesia, Malaysia and Philippines Source: A.C. Nielsen and Tobacco Institute of Japan |
 Philip Morris
International 24 Marlboro Superpremium Marlboro Superpremium |
 Philip Morris
International 25 Cash Flow Cash Flow Free cash flow in the third quarter totaled $1.7 billion and reached $5.9 billion year-to-date (a) Excluding the impact of currency on net earnings, free cash flow was 17.0% higher in the quarter and 12.4% higher in 2009 through the end of September (a) Free cash flow equals net cash provided by operating activities less capital
expenditures. In Q3, 2009, net cash flow provided by operating activities was $1,846 million and capital expenditures $160 million. YTD September 2009, net cash flow provided by operating activities was $6,419 million and capital expenditures $483 million. Source: PMI Financials |
 Philip Morris
International 26 Shareholder Returns Shareholder Returns Quarterly dividend increased in September by 7.4% to $0.58 per share A further $1.5 billion in share repurchases in Q3, 2009 This year so far, $7.4 billion returned to shareholders through dividends and share repurchases Since March 2008 spin-off, $15.0 billion returned to shareholders, representing more than 15% of our current market capitalization Source: PMI Financials |
 Philip Morris
International 27 Conclusions Conclusions Financial strength is a key component of our success Excellent business momentum Consistently delivering against our constant currency financial targets Higher pricing, good business performance in most key markets and cost savings driving our profitability growth Increased 2009 EPS guidance of $3.20 - $3.25, representing a currency neutral growth rate of 12% - 14% Source: PMI Financials |
 Questions & Answers |
 Philip Morris
International 29 PHILIP MORRIS INTERNATIONAL INC. (in millions) (Unaudited) For the Quarters Ended September 30, and Subsidiaries Reconciliation of Non-GAAP Measures Adjustments for the Impact of Currency and Acquisitions Reported Net Revenues Less Excise Taxes Reported Net Revenues excluding Excise Taxes Less Currency Reported Net Revenues excluding Excise Taxes & Currency Less Acquisi- tions Reported Net Revenues excluding Excise Taxes, Currency & Acquisitions Reported Net Revenues Less Excise Taxes Reported Net Revenues excluding Excise Taxes Reported Reported excluding Currency Reported excluding Currency & Acquisitions 7,783 $ 5,375 $ 2,408 $ (304) $ 2,712 $ 12 $ 2,700 $ European Union 8,451 $ 5,780 $ 2,671 $ (9.8)% 1.5% 1.1% 3,722 1,892 1,830 (425) 2,255 4 2,251 EEMA 4,163 2,054 2,109 (13.2)% 6.9% 6.7% 3,170 1,519 1,651 (7) 1,658 - 1,658 Asia 3,188 1,578 1,610 2.5 % 3.0% 3.0% 1,898 1,200 698 (110) 808 180 628 Latin America & Canada 1,563 1,000 563 24.0 % 43.5% 11.5% 16,573 $ 9,986 $ 6,587 $ (846) $ 7,433 $ 196 $ 7,237 $ PMI Total 17,365 $ 10,412 $ 6,953 $ (5.3)% 6.9% 4.1% Reported Operating Companies Income Less Currency Reported Operating Companies Income excluding Currency Less Acquisi- tions Reported Operating Companies Income excluding Currency & Acquisitions Reported Operating Companies Income Reported Reported excluding Currency Reported excluding Currency & Acquisitions 1,267 $ (147) $ 1,414 $ 9 $ 1,405 $ European Union 1,325 $ (4.4)% 6.7% 6.0% 761 (290) 1,051 5 1,046 EEMA 946 (19.6)% 11.1% 10.6% 653 44 609 - 609 Asia 558 17.0 % 9.1% 9.1% 226 (56) 282 77 205 Latin America & Canada 110 100+% 100+% 86.4% 2,907 $ (449) $ 3,356 $ 91 $ 3,265 $ PMI Total 2,939 $ (1.1)% 14.2% 11.1% 2009 2008 % Change in Reported Operating Companies Income 2009 2008 % Change in Reported Net Revenues excluding Excise Taxes |
 Philip Morris
International 30 Reconciliation of Adjusted Operating Companies Income Margin, Excluding Currency (in millions) PHILIP MORRIS INTERNATIONAL INC. and Subsidiaries Reconciliation of Non-GAAP Measures (Unaudited) Reconciliation of Reported Operating Companies Income to Adjusted Operating Companies Income
& For the Quarters Ended September 30, (1) For the calculation of net revenues excluding excise taxes and currency, refer to slide
28 Reported Operating Companies Income Less Asset Impairment & Exit Costs Adjusted Operating Companies Income Less Currency Adjusted Operating Companies Income excluding Currency Less Acquisi- tions Adjusted Operating Companies Income excluding Currency & Acquisitions Reported Operating Companies Income Less Asset Impairment & Exit Costs Adjusted Operating Companies Income Adjusted Adjusted excluding Currency Adjusted excluding Currency & Acquisitions 1,267 $ (1) $ 1,268 $ (147) $ 1,415 $ 9 $ 1,406 $ European Union 1,325 $ (10) $ 1,335 $ (5.0)% 6.0% 5.3% 761 - 761 (290) 1,051 5 1,046 EEMA 946 - 946 (19.6)% 11.1% 10.6% 653 - 653 44 609 - 609 Asia 558 - 558 17.0 % 9.1% 9.1% 226 - 226 (56) 282 77 205 Latin America & Canada 110 (3) 113 100.0 % 100+% 81.4% 2,907 $ (1) $ 2,908 $ (449) $ 3,357 $ 91 $ 3,266 $ PMI Total 2,939 $ (13) $ 2,952 $ (1.5)% 13.7% 10.6% % Points Change Adjusted Operating Companies Income excluding Currency Net Revenues excluding Excise Taxes & Currency (1) Adjusted Operating Companies Income Margin excluding Currency Adjusted Operating Companies Income Net Revenues excluding Excise Taxes (1) Adjusted Operating Companies Income Margin Adjusted Operating Companies Income Margin excluding Currency 1,415 $ 2,712 $ 52.2% European Union 1,335 $ 2,671 $ 50.0% 2.2 pp 1,051 2,255 46.6% EEMA 946 2,109 44.9% 1.7 pp 609 1,658 36.7% Asia 558 1,610 34.7% 2.0 pp 282 808 34.9% Latin America & Canada 113 563 20.1% 14.8 pp 3,357 $ 7,433 $ 45.2% PMI Total 2,952 $ 6,953 $ 42.5% 2.7 pp 2008 2009 2009 2008 % Change in Adjusted Operating Companies Income |
 Philip Morris
International 31 Reconciliation of Reported Diluted EPS to Adjusted Diluted EPS and Adjusted Diluted EPS, Excluding
Currency For the Quarters Ended September 30, (Unaudited) PHILIP MORRIS INTERNATIONAL INC. and Subsidiaries Reconciliation of Non-GAAP Measures 2009 2008 % Change Reported Diluted EPS 0.93 $
1.01 $ (7.9)% Less: Asset impairment and exit costs - - Tax items - 0.08 Adjusted Diluted EPS 0.93 $
0.93 $ - Less: Currency Impact (0.17) Adjusted Diluted EPS, Excluding Currency 1.10 $
0.93 $ 18.3 % |
 Philip Morris
International 32 Reconciliation of Reported Diluted EPS to Reported Diluted EPS, Excluding Currency For the Quarters Ended September 30, (Unaudited) PHILIP MORRIS INTERNATIONAL INC. and Subsidiaries Reconciliation of Non-GAAP Measures 2009 2008 % Change Reported Diluted EPS 0.93 $
1.01 $ (7.9)% Less: Currency Impact (0.17) Reported Diluted EPS, Excluding Currency 1.10 $
1.01 $ 8.9 % |
 Philip Morris
International 33 (in millions) For the Nine Months Ended September 30, and Subsidiaries Reconciliation of Non-GAAP Measures Adjustments for the Impact of Currency and Acquisitions (Unaudited) PHILIP MORRIS INTERNATIONAL INC. Reported Net Revenues Less Excise Taxes Reported Net Revenues excluding Excise Taxes Less Currency Reported Net Revenues excluding Excise Taxes & Currency Less Acquisi- tions Reported Net Revenues excluding Excise Taxes, Currency & Acquisitions Reported Net Revenues Less Excise Taxes Reported Net Revenues excluding Excise Taxes Reported Reported excluding Currency Reported excluding Currency & Acquisitions 20,988 $ 14,313 $ 6,675 $ (1,008) $ 7,683 $ 50 $ 7,633 $ European Union 23,427 $ 15,866 $ 7,561 $ (11.7)% 1.6% 1.0% 9,953 5,031 4,922 (1,198) 6,120 7 6,113 EEMA 11,248 5,544 5,704 (13.7)% 7.3% 7.2% 8,974 4,160 4,814 (195) 5,009 - 5,009 Asia 9,334 4,617 4,717 2.1 % 6.2% 6.2% 5,157 3,250 1,907 (308) 2,215 462 1,753 Latin America & Canada 4,413 2,812 1,601 19.1 % 38.4% 9.5% 45,072 $ 26,754 $ 18,318 $ (2,709) $ 21,027 $ 519 $ 20,508 $ PMI Total 48,422 $ 28,839 $ 19,583 $ (6.5)% 7.4% 4.7% Reported Operating Companies Income Less Currency Reported Operating Companies Income excluding Currency Less Acquisi- tions Reported Operating Companies Income excluding Currency & Acquisitions Reported Operating Companies Income Reported Reported excluding Currency Reported excluding Currency & Acquisitions 3,397 $ (572) $ 3,969 $ 36 $ 3,933 $ European Union 3,779 $ (10.1)% 5.0% 4.1% 1,982 (758) 2,740 7 2,733 EEMA 2,439 (18.7)% 12.3% 12.1% 1,933 67 1,866 - 1,866 Asia 1,631 18.5 % 14.4% 14.4% 452 (138) 590 202 388 Latin America & Canada 282 60.3 % 100+% 37.6% 7,764 $ (1,401) $ 9,165 $ 245 $ 8,920 $ PMI Total 8,131 $ (4.5)% 12.7% 9.7% (1) As discussed in Note 1. Background and Basis of Presentation of our 2008 consolidated
financial statements which appears in our Annual Report on Form 10-K, prior to 2008, certain of our subsidiaries reported their results up to ten days before the end of December, rather than on December 31. During 2008, these subsidiaries moved to a December 31 closing date. As a result, certain amounts in the first quarter of 2008 were revised to reflect this change. 2009 2008 (1) % Change in Reported Net Revenues excluding Excise Taxes 2009 2008 (1) % Change in Reported Operating Companies Income |
 Philip Morris
International 34 Reconciliation of Adjusted Operating Companies Income Margin, Excluding Currency (Unaudited) For the Nine Months Ended September 30, (in millions) PHILIP MORRIS INTERNATIONAL INC. and Subsidiaries Reconciliation of Non-GAAP Measures Reconciliation of Reported Operating Companies Income to Adjusted Operating Companies Income
& (3) Represents 2008 equity loss from RBH legal settlement ($124 million) and asset impairment
and exit costs ($3 million). (4) For the calculation of net revenues excluding excise taxes and currency, refer to slide 32. (2) Represents 2009 Colombian investment and cooperation agreement charge. (1) As discussed in Note 1. Background and Basis of Presentation of our 2008 consolidated
financial statements which appears in our Annual Report on Form 10-K, prior to 2008, certain of our subsidiaries reported their results up to ten days before the end of December, rather than on December 31.
During 2008, these subsidiaries moved to a December 31 closing date. As a result, certain amounts in the first quarter of 2008 were revised to reflect this change. Reported Operating Companies Income Less Asset Impairment/ Exit Costs and Other Adjusted Operating Companies Income Less Currency Adjusted Operating Companies Income excluding Currency Less Acquisi- tions Adjusted Operating Companies Income excluding Currency & Acquisitions Reported Operating Companies Income Less Asset Impairment/ Exit Costs and Other Adjusted Operating Companies Income Adjusted Adjusted excluding Currency Adjusted excluding Currency & Acquisitions 3,397 $ (3) $ 3,400 $ (572) $ 3,972 $ 36 $ 3,936 $ European Union 3,779 $ (66) $ 3,845 $ (11.6)% 3.3% 2.4% 1,982 - 1,982 (758) 2,740 7 2,733 EEMA 2,439 (1) 2,440 (18.8)% 12.3% 12.0% 1,933 - 1,933 67 1,866 - 1,866 Asia 1,631 (14) 1,645 17.5 % 13.4% 13.4% 452 (135) (2) 587 (138) 725 202 523 Latin America & Canada 282 (127) (3) 409 43.5 % 77.3% 27.9% 7,764 $ (138) $ 7,902 $ (1,401) $ 9,303 $ 245 $ 9,058 $ PMI Total 8,131 $ (208) $ 8,339 $ (5.2)% 11.6% 8.6% % Points Change Adjusted Operating Companies Income excluding Currency Net Revenues excluding Excise Taxes & Currency (4) Adjusted Operating Companies Income Margin excluding Currency Adjusted Operating Companies Income Net Revenues excluding Excise Taxes (4) Adjusted Operating Companies Income Margin Adjusted Operating Companies Income Margin excluding Currency 3,972 $ 7,683 $ 51.7% European Union 3,845 $ 7,561 $ 50.9% 0.8 pp 2,740 6,120 44.8% EEMA 2,440 5,704 42.8% 2.0 pp 1,866 5,009 37.3% Asia 1,645 4,717 34.9% 2.4 pp 725 2,215 32.7% Latin America & Canada 409 1,601 25.5% 7.2 pp 9,303 $ 21,027 $ 44.2% PMI Total 8,339 $ 19,583 $ 42.6% 1.6 pp 2009 2008 2009 2008 (1) % Change in Adjusted Operating Companies Income |
 Philip Morris
International 35 PHILIP MORRIS INTERNATIONAL INC. and Subsidiaries Reconciliation of Non-GAAP Measures Reconciliation of Reported Diluted EPS to Adjusted Diluted EPS and Adjusted Diluted EPS, Excluding
Currency For the Nine Months Ended September 30, (Unaudited) 2009 2008 % Change Reported Diluted EPS 2.44 $
2.60 $ (6.2)% Less: Colombian investment and cooperation agreement charge (0.04) - Asset impairment and exit costs - (0.02) Equity loss from RBH legal settlement - (0.06) Tax items - 0.08 Adjusted Diluted EPS 2.48 $
2.60 $ (4.6)% Less: Currency Impact (0.52) Adjusted Diluted EPS, Excluding Currency 3.00 $
2.60 $ 15.4 % |
 Philip Morris
International 36 Reconciliation of Reported Diluted EPS to Reported Diluted EPS, Excluding Currency For the Nine Months Ended September 30, (Unaudited) PHILIP MORRIS INTERNATIONAL INC. and Subsidiaries Reconciliation of Non-GAAP Measures 2009 2008 % Change Reported Diluted EPS 2.44 $
2.60 $ (6.2)% Less: Currency Impact (0.52) Reported Diluted EPS, Excluding Currency 2.96 $
2.60 $ 13.8 % |
 Philip Morris
International 37 PHILIP MORRIS INTERNATIONAL INC. and Subsidiaries Reconciliation of Non-GAAP Measures Reconciliation of Net Cash Provided by Operating Activities to Free Cash Flow & Free Cash Flow,
excluding Currency For the Quarters and Nine Months Ended September 30, (Unaudited) (in millions) 2009 2008 % Change 2009 2008 % Change Net cash provided by operating activities (a) 1,846 $ 2,003 $ (7.8)% 6,419 $ 7,102 $ (9.6)% Less: Capital expenditures 160 250 483 824 Free cash flow 1,686 $ 1,753 $ (3.8)% 5,936 $ 6,278 $ (5.4)% Less: Currency impact on net earnings (365) - (1,118) - Free cash flow, excluding currency impact on net earnings 2,051 $ 1,753 $ 17.0 % 7,054 $ 6,278 $ 12.4 % September 30, September 30, For the Quarters Ended For the Nine Months Ended (a) Operating cash flow |
 Philip Morris
International 38 Calculation of Total Debt to EBITDA and Net Debt to EBITDA Ratios (in millions, except ratios) (Unaudited) PHILIP MORRIS INTERNATIONAL INC. and Subsidiaries Reconciliation of Non-GAAP Measures For the Year Ended September 30, December 31, 2009 2008 October~December January~September 12 months 2008 2009 rolling Earnings before income taxes 2,120 $
7,027 $
9,147 $ 9,937 $
Interest expense, net
106 572 678 311 Depreciation and amortization 217 607 824 842 EBITDA 2,443 $
8,206 $
10,649 $ 11,090 $
September 30, December 31, 2009 2008 Short-term borrowings 313 $
375 $
Current
portion of long-term debt 197 209 Long-term debt 13,741 11,377 Total debt 14,251 $ 11,961 $
Less: Cash and cash equivalents
1,602 1,531 Net Debt 12,649 $ 10,430 $
Ratios Total Debt to EBITDA 1.34 1.08 Net Debt to EBITDA 1.19 0.94 |
 2009 Third-Quarter Results 22 October 2009 |