Attached files
| file | filename |
|---|---|
| 8-K - FORM 8-K - NEWFIELD EXPLORATION CO /DE/ | nfx8k-10212009.htm |
| EX-99.1 - EARNINGS PRESS RELEASE - NEWFIELD EXPLORATION CO /DE/ | nfx8k-10212009ex991.htm |
Exhibit
99.2

@NFX is
periodically published to keep shareholders aware of current operating
activities at Newfield. It may include estimates of expected production volumes,
costs and expenses, recent changes to hedging positions and commodity
pricing.
October
21, 2009
This
edition of @NFX includes:
|
·
|
2009
THIRD QUARTER DRILLING ACTIVITY BY
AREA
|
|
·
|
RECENT
HIGHLIGHTS
|
|
·
|
OPERATIONAL
SUMMARIES BY FOCUS AREA
|
|
·
|
FOURTH
QUARTER ESTIMATES
|
|
·
|
UPDATED
TABLES DETAILING COMPLETE HEDGE
POSITIONS
|
Third Quarter 2009 Drilling
Activity*
|
NFX
Operated
|
Non-Operated
|
Gross
Wells
|
Dry
Holes
|
|||||||||||||
|
Mid-Continent
|
25 | 15 | 40 | 0 | ||||||||||||
|
Rocky
Mount.
|
47 | 4 | 51 | 0 | ||||||||||||
|
Onshore
GC
|
2 | 0 | 2 | 1 | ||||||||||||
|
Gulf
of Mexico
|
2 | 0 | 2 | 0 | ||||||||||||
|
International
|
1 | 5 | 6 | 0 | ||||||||||||
|
Total:
|
77 | 24 | 101 | 1 | ||||||||||||
*Represents
a 99% success rate
YTD Total
gross wells: 317; YTD dry wells: 6
RECENT
HIGHLIGHTS
|
-
|
Declining service costs,
reduced water handling fees related to deferred completions and efficiency
improvements throughout the Company have led to a significant decrease in
lease operating expense (LOE) throughout the year. Domestic
recurring LOE was $0.81 per Mcfe in the third
quarter.
|
|
-
|
We have invested approximately
$950 million year-to-date and paid down more than $100 million of debt on
our revolver during the year. Significant new projects have been
included throughout the year that will help build for the future, and were
funded within our $1.45 billion 2009 capital
budget.
|
|
-
|
Our production in the third
quarter of 2009 was 65.5 Bcfe, an increase of 7% over the third quarter of
2008. The volumes exclude approximately 2.6 Bcfe of voluntary
natural gas curtailments in the second quarter of 2009 in response to low
natural gas prices. Full year 2009 production is expected to be in the
upper half of original guidance – or greater than 255
Bcfe.
|
|
-
|
Oil liftings in the third
quarter were 3.8 MMBbls, or more than 40,500 BOPD net. This
represents a 40% increase over the same period in 2008. The increase is
attributable to a 4% increase in our domestic crude volumes and a
near-doubling of our international oil liftings. Throughout the second
half of 2009, we have shifted capital investments to “oily” projects. Our
diversified portfolio provides us with flexibility and multiple
options.
|
1
|
-
|
Strong 2010 hedge position.
We have hedged approximately 70% of estimated 2010 natural gas
production and approximately 30% of estimated 2011 natural gas production.
Approximately 40% of our estimated 2010 crude oil is hedged at more than
$100 per barrel.
|
ENTERING
THE MARCELLUS SHALE
On
October 14, we entered the Marcellus Shale through a joint exploration agreement
with Hess. The agreement covers up to 140,000 gross acres primarily in
Susquehanna and Wayne Counties, Pennsylvania. We will operate with a 50
percent interest. Initial drilling is not
expected to commence until 2010.
Our
proven expertise from large scale developments like the Woodford Shale, Granite
Wash and Monument Butte ranks us among a handful of companies that have
developed large-scale unconventional plays. We have drilled approximately 300
horizontal wells in the Woodford and over a four-year time span held
substantially all of 165,000 net-acre position by production. Our field
production today is 317 MMcfe/d gross and we have firm transportation agreements
in place to keep pace with our future growth. These activities have led to the
development of “core competencies” within our company that will guide our
success in the Marcellus.
The 2009
portion of our Marcellus Shale activities, estimated at approximately $20
million, will be funded within our existing $1.45 billion capital budget. We
expect to grow our business in the Marcellus play, just as we have created
businesses with scale in the Mid-Continent and Rocky Mountains.
MID-CONTINENT
Mid-Continent
gross operated production recently reached a new high and is currently 460
MMcfe/d, or 323 MMcfe/d net during the third quarter. The significant
increase is primarily attributable to curtailed wells that are being turned to
sales, as well as initial production from deferred completions. Newfield has a
remaining inventory of 30 wells (28 Woodford and 2 Granite Wash) that have been
drilled but not completed. Completions are commencing and will continue through
January 2010.
Woodford
Shale


Gross
operated production in the Woodford Shale set a recent new high, and today is
308 MMcfe/d, up nearly 30% from 240 MMcfe/d at the end of the second quarter. We
have drilled approximately 300 horizontal wells and continue to make
improvements in both drilling and completion operations. In 2008, we entered
development mode in the Woodford and continued efficiency gains have been
demonstrated through pad drilling, longer laterals and completion
optimization.
2
We are
operating 10 rigs under term contract, with three of the remaining rigs rolling
off of term in November and December 2009. Spot market rates on these rigs are
significantly lower than term rates.
Over the
last several years, we have increased our lateral lengths significantly. We
expect that our average completed lateral length will be more than 5,000’ in
2009. The following chart shows the significant increase in lateral length by
year:

Shown
another way in the chart below, the increasing lateral lengths are leading to
marked improvements in finding and development costs. Over the last 12 months,
our completed wells costs are down more than 25%.

We are
referring to our wells with laterals exceeding 8,000’ as “super extended
laterals” or SXLs. Regulatory rules in Oklahoma allow for drilling on stand-up
640 acre units… or units that are ½-mile wide by 2-miles long. This
configuration accommodates a 10,000’ lateral. We have drilled two 10,000’
laterals to date and expect to have eight SXLs drilled by year-end ‘09. These
wells have planned lateral lengths between 8,000’ and 9,000’. Initial production
data from the first SXLs are expected in late 2009.
3
We also
are fracture stimulating our wells with greater efficiency in 2009. The average
number of fracs per day has increased to more than five on recent pad
completions, compared to just three fracs per day in 2008. This eliminates
approximately six days off a standard completion; saving money and allowing us
to turn wells to production more quickly.
One of
the largest contributors to our Woodford cost reductions has been pad drilling
-- a common development technique in resource plays. Now that approximately 95%
of our acreage is held-by-production, our development drilling is dominated by
multi-well pads. Approximately 85% of our wells in 2009 will be drilled from
common pad locations.
Two
recent notable Woodford wells that typify increased cost efficiencies
include:
|
·
|
The
Cunningham 3H-22, located in Coal County, was drilled and cased in 26 days
for $3.3 million gross. The well was the first on a three-well pad and had
a 5,100’ lateral length. The completion was deferred until late
2009.
|
|
·
|
The
Tollett 7H-22, located in Hughes County, was drilled and cased in 17 days
for $2.7 million. The well had a 5,100’ lateral length. The completion was
deferred until late 2009.
|
The new
Mid-Continent Express Pipeline (MEP) links our Woodford production to
Perryville, La. For 2009, we have 310 MMcf/d of firm transportation on MEP and
an additional 50 MMcf/d on CEGT. We have staged additional firm transportation
on Boardwalk to coincide with our future growth needs. In total, we have
approximately 650 MMcf/d of firm transportation, helping to ensure we obtain the
best possible pricing for our Woodford gas.
The
Granite Wash
Based on
the success of our initial drilling program in the Granite Wash play, we added a
fourth operated rig in our Stiles Ranch field, located in Wheeler County, Texas.
In July, we announced that the first seven horizontal wells in our Stiles Ranch
field had an average initial production rate of 22 MMcfe/d. Recent well
completions have been deferred and the Company expects to have production
results from 6 – 8 additional completions in early 2010.
We have
increased lateral lengths on recent wells to approximately 4,000’, compared to
about 3,500’ on average for our initial seven wells.
(For
additional information on Granite Wash, please see @NFX July 22, 2009 and the
Granite Wash feature in Oil and Gas Investor magazine, October
2009.)
ROCKY
MOUNTAINS
Monument
Butte Field
Despite
dropping two operated rigs in Monument Butte in early 2009, production from our
Rocky Mountain division is expected to be up about 9% in 2009. Due to
higher oil prices and improved differentials, we recently added a fourth rig at
Monument Butte and expect to add a fifth rig in early 2010. Monument Butte
production is approximately 16,000 BOPD gross and a five-rig program is expected
to grow annual volumes by more than 10%.
4
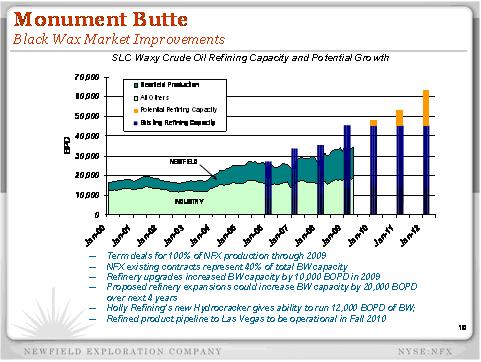
Monument
Butte Well Costs

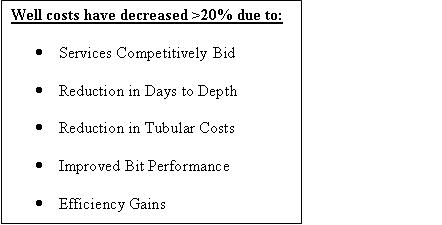
Differentials
for Black Wax crude have narrowed in 2009. The chart below shows our position in
the overall Black Wax market and in that area refining capacity has been
increasing. Monument Butte is a giant resource with more than 2 billion barrels
in place. Through the drilling of several thousand additional wells, we expect
to recover 18-20% of the original oil in place. We have more than a decade-long
inventory of drilling locations and significant growth through this large oil
asset.
Williston
Basin
We expect
to add up to two additional operated rigs in our Williston Basin development
areas. We have been running a one-rig program since early 2009. We have
approximately 200,000 net acres in prospective development areas, located
primarily on the Nesson Anticline and west of the Nesson. An additional 200,000
net acres are located in northern Montana where several exploration plays are
underway. We have drilled 12 successful oil wells in the North Dakota portion of
the Williston, focusing to date primarily on the Bakken Shale and Three
Forks/Sanish formations.
5
Two wells
were drilled since the last quarter’s update: Trigger is our first well in Big
Valley, an area covering more than 50,000 net acres in northern North Dakota.
The well was recently fracture stimulated and continues to clean-up. Early
results warrant additional drilling to asses this large area. Sergeant Major was
drilled in the Catwalk area, which covers 25,300 net acres. Completion
operations on the well are expected to commence next week.
GULF
OF MEXICO
We have
seven deepwater developments underway in the Gulf of Mexico which are expected
to provide significant future growth. Our most recent development is Fastball,
located at Viosca Knoll 1003. Fastball commenced production on October 19. Gross
production is expected to ramp up to 40 MMcf/d and 3,200 BOPD. We operate
Fastball with a 66% interest.
Pyrenees -- In the second quarter of
2009, we announced a significant operated discovery on its Pyrenees Prospect,
located at Garden Banks 293 in approximately 2,100 feet of water. A recent
sidetrack delineated the downdip limits in the three proven pay sands seen in
the discovery well and provided encouragement for the exploration potential of
both the shallow and deep sand sections on the feature. Additional drilling is
planned for 2010. We operate the development with a 40% working
interest.
Over the
last several years, we have assembled a substantial inventory of exploration
prospects in the deepwater Gulf of Mexico. We own interests in 88 deepwater
blocks (approximately 500,000 gross acres). We plan to drill 3-5 deepwater Gulf
of Mexico wells each year for the next several years.
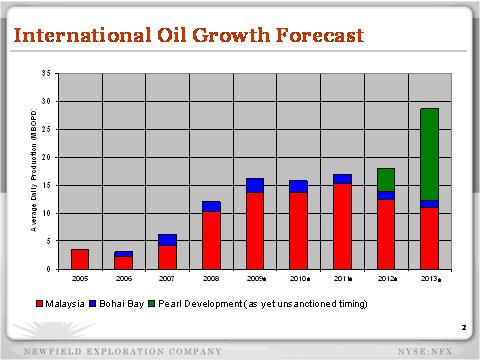
INTERNATIONAL
International
oil liftings in the third quarter of 2009 increased more than 90% over the same
period in 2008. We lifted 2.1 MMBbls in the third quarter, or an average of
23,380 BOPD net. The increased liftings reflects production recent developments
offshore Malaysia as well as timing of liftings in the quarter.
Malaysia
During
the third quarter, liftings from Malaysia average 21,270 BOPD net. Production
increases are attributable to higher rates from the East Belumut and Chermingat
oil fields. We recently accelerated the timing of our planned East Belumut
“Phase II” program, with plans to drill six development wells in late 2009 and
an additional six wells in 2010. We expect to invest approximately $18 million
in 2009 and $18 million in early 2010 associated with Phase II. Our developments
are located on two shallow water blocks – PM 318 and PM 323. We have a 50%
interest in PM 318 and a 60% operated interest in PM 323.
China
For the
third quarter of 2009, our offshore China liftings averaged 2,108 BOPD net. We
recently announced a significant operated oil discovery on our Pearl prospect,
located in the Pearl River Mouth Basin. The Pearl development is underway with
first production expected in 2012. The LF 7-1 well encountered more than 250’ of
high-quality oil pay in multiple sands and tested a single zone at 6,000 BOPD,
which was the maximum limit of the test equipment on location. The well was an
exploration offset to a downthrown anticline and was an offset to our 2008 oil
discovery – the LF 7-2. The two successes confirmed a commercial oil
development with first production expected in late 2012. There is significant
additional reserve potential in deeper objectives at Pearl, as well as with
prospects along a structural ridge located to the northeast. We call these our
Jade prospects.
6
Prior to
year-end 2009, we expect to spud an exploration well on our first Jade prospect.
We have a 100% working interest in the Pearl development; CNOOC has a 51%
back-in election to any commercial development.

7
FOURTH
QUARTER ESTIMATES
|
4Q09
Estimates
|
||||||||||||
|
Domestic
|
Int’l
|
Total
|
||||||||||
|
Production/Liftings
|
||||||||||||
|
Natural
gas – Bcf
|
44.7 – 45.5 | – | 44.7 – 45.5 | |||||||||
|
Oil
and condensate – MMBbls
|
1.7 – 1.8 | 1.4 – 1.5 | 3.1 – 3.3 | |||||||||
|
Total
Bcfe
|
54.9 – 56.3 | 8.4 – 9.0 | 63.3 – 65.3 | |||||||||
|
Average
Realized Prices
|
||||||||||||
|
Natural
gas – $/Mcf
|
Note
1
|
|||||||||||
|
Oil
and condensate – $/Bbl
|
Note
2
|
Note
3
|
||||||||||
|
Mcf
equivalent – $/Mcfe
|
||||||||||||
|
Operating
Expenses:
|
||||||||||||
|
Lease
operating
|
||||||||||||
|
Recurring
($MM)
|
$ | 34.2 - $37.8 | $ | 18.4 - $20.3 | $ | 52.6 - $58.1 | ||||||
|
per/Mcfe
|
$ | 0.62 - $0.67 | $ | 2.19 - $2.25 | $ | 0.83 - $0.89 | ||||||
|
Major
(workover, repairs, etc.) ($MM)
Note 4
|
$ | 13.1 - $14.5 | -- | $ | 13.1 - $14.5 | |||||||
|
per/Mcfe
|
$ | 0.24 - $0.26 | -- | $ | 0.21 - $0.22 | |||||||
|
Production and other taxes
($MM)Note
5
|
$ | 14.0 - $15.4 | $ | 13.3 - $14.7 | $ | 27.3 - $30.1 | ||||||
|
per/Mcfe
|
$ | 0.26 - $0.27 | $ | 1.58 - $1.63 | $ | 0.43 - $0.46 | ||||||
|
General and administrative
(G&A), net ($MM)
|
$ | 29.8 - $33.0 | $ | 1.4 - $1.5 | $ | 31.2 - $34.5 | ||||||
|
per/Mcfe
|
$ | 0.54 - $0.59 | $ | 0.16 - $0.17 | $ | 0.49 - $0.53 | ||||||
|
Capitalized
internal costs ($MM)
|
$ | (18.5 - $20.4 | ) | |||||||||
|
per/Mcfe
|
$ | (0.29 - $0.31 | ) | |||||||||
|
Interest
expense ($MM)
|
$ | 29.0 - $32.0 | ||||||||||
|
per/Mcfe
|
$ | 0.46 - $0.49 | ||||||||||
|
Capitalized
interest ($MM)
|
$ | (11.0 - $12.1 | ) | |||||||||
|
per/Mcfe
|
$ | (0.17 - $0.19 | ) | |||||||||
|
Tax
rate (%)Note
6
|
36 - 38 | % | ||||||||||
|
Income
taxes (%)
|
||||||||||||
|
Current
|
14% - 16 | % | ||||||||||
|
Deferred
|
84% - 86 | % | ||||||||||
|
Note
1: Gas prices in the Mid-Continent, after basis differentials,
transportation and handling charges, typically average 75–85% of the Henry
Hub Index. Gas prices in the Gulf of Mexico and onshore Gulf Coast, after
basis differentials, transportation and handling charges, typically
averages $0.25–$0.50 per MMBtu less than the Henry Hub Index.
Note
2: Oil prices in the Gulf Coast typically average 90–95% of NYMEX WTI
price. Rockies oil prices are currently averaging about $12–$14 per barrel
below WTI. Oil production from the Mid-Continent typically averages 85–90%
of WTI.
Note
3: Oil in Malaysia typically sells at a slight discount to Tapis, or about
90–95% of WTI. Oil production from China typically sells at $6–$8 per
barrel less than WTI.
Note
4: Domestic major expense includes approximately $6 million for well
workover expense and other projects initiated in response to higher
commodity prices and lower service costs.
Note
5: Guidance for production taxes determined using $75/Bbl oil and
$4.50/MMBtu gas.
Note
6: Tax rate applied to earnings excluding unrealized gains or losses
on commodity derivatives.
|
||||||||||||
8
NATURAL
GAS HEDGE POSITIONS
Please
see the tables below for our complete hedging positions.
The
following hedge positions for the fourth quarter of 2009 and beyond are as of
October 20, 2009:
Fourth Quarter
2009
|
Weighted
Average
|
Range
|
|||||||||||||||||||
|
Volume
|
Fixed
|
Floors
|
Collars
|
Floor
|
Ceiling
|
|||||||||||||||
|
26,120
MMMBtus
|
$ | 7.34 | — | — | — | — | ||||||||||||||
|
8,435
MMMBtus
|
— | — | $ | 8.23 — $11.20 | $ | 8.00 — $8.50 | $ | 8.97 — $14.37 | ||||||||||||
First Quarter
2010
|
Weighted
Average
|
Range
|
|||||||||||||||||||
|
Volume
|
Fixed
|
Floors
|
Collars
|
Floor
|
Ceiling
|
|||||||||||||||
|
31,800
MMMBtus
|
$ | 6.79 | — | — | — | — | ||||||||||||||
|
5,700
MMMBtus
|
— | — | $ | 8.50 — $10.44 | $ | 8.50 | $ | 10.00 — $11.00 | ||||||||||||
Second Quarter
2010
|
Weighted
Average
|
Range
|
|||||||||||||||||||
|
Volume
|
Fixed
|
Floors
|
Collars
|
Floor
|
Ceiling
|
|||||||||||||||
|
34,850
MMMBtus
|
$ | 6.41 | — | — | — | — | ||||||||||||||
Third Quarter
2010
|
Weighted
Average
|
Range
|
|||||||||||||||||||
|
Volume
|
Fixed
|
Floors
|
Collars
|
Floor
|
Ceiling
|
|||||||||||||||
|
35,200
MMMBtus
|
$ | 6.41 | — | — | — | — | ||||||||||||||
Fourth Quarter
2010
|
Weighted
Average
|
Range
|
|||||||||||||||||||
|
Volume
|
Fixed
|
Floors
|
Collars
|
Floor
|
Ceiling
|
|||||||||||||||
|
28,320
MMMBtus
|
$ | 6.49 | — | — | — | — | ||||||||||||||
First Quarter
2011
|
Weighted
Average
|
Range
|
|||||||||||||||||||
|
Volume
|
Fixed
|
Floors
|
Collars
|
Floor
|
Ceiling
|
|||||||||||||||
|
18,900
MMMBtus
|
$ | 6.55 | — | — | — | — | ||||||||||||||
Second Quarter
2011
|
Weighted
Average
|
Range
|
|||||||||||||||||||
|
Volume
|
Fixed
|
Floors
|
Collars
|
Floor
|
Ceiling
|
|||||||||||||||
|
19,110
MMMBtus
|
$ | 6.55 | — | — | — | — | ||||||||||||||
Third Quarter
2011
|
Weighted
Average
|
Range
|
|||||||||||||||||||
|
Volume
|
Fixed
|
Floors
|
Collars
|
Floor
|
Ceiling
|
|||||||||||||||
|
19,320
MMMBtus
|
$ | 6.55 | — | — | — | — | ||||||||||||||
Fourth Quarter
2011
|
Weighted
Average
|
Range
|
|||||||||||||||||||
|
Volume
|
Fixed
|
Floors
|
Collars
|
Floor
|
Ceiling
|
|||||||||||||||
|
6,510
MMMBtus
|
$ | 6.55 | — | — | — | — | ||||||||||||||
9
The
following table details the expected impact to pre-tax income from the
settlement of our derivative contracts, outlined above, at various NYMEX gas
prices, net of premiums paid for these contracts (in millions).
|
Gas
Prices
|
||||||||||||||||||||||||
| $ | 4.00 | $ | 5.00 | $ | 6.00 | $ | 7.00 | $ | 8.00 | $ | 9.00 | |||||||||||||
|
2009
|
||||||||||||||||||||||||
|
4th
Quarter
|
$ | 123 | $ | 88 | $ | 54 | $ | 19 | $ | (15 | ) | $ | (43 | ) | ||||||||||
|
Total
2009
|
$ | 123 | $ | 88 | $ | 54 | $ | 19 | $ | (15 | ) | $ | (43 | ) | ||||||||||
|
2010
|
||||||||||||||||||||||||
|
1st
Quarter
|
$ | 114 | $ | 77 | $ | 40 | $ | 2 | $ | (35 | ) | $ | (70 | ) | ||||||||||
|
2nd
Quarter
|
$ | 84 | $ | 49 | $ | 14 | $ | (21 | ) | $ | (56 | ) | $ | (91 | ) | |||||||||
|
3rd
Quarter
|
$ | 85 | $ | 49 | $ | 14 | $ | (21 | ) | $ | (56 | ) | $ | (91 | ) | |||||||||
|
4th
Quarter
|
$ | 70 | $ | 43 | $ | 14 | $ | (14 | ) | $ | (43 | ) | $ | (71 | ) | |||||||||
|
Total
2010
|
$ | 353 | $ | 218 | $ | 82 | $ | (54 | ) | $ | (190 | ) | $ | (323 | ) | |||||||||
|
2011
|
||||||||||||||||||||||||
|
1st
Quarter
|
$ | 48 | $ | 29 | $ | 10 | $ | (8 | ) | $ | (27 | ) | $ | (46 | ) | |||||||||
|
2nd
Quarter
|
$ | 49 | $ | 30 | $ | 10 | $ | (9 | ) | $ | (28 | ) | $ | (47 | ) | |||||||||
|
3rd
Quarter
|
$ | 49 | $ | 30 | $ | 11 | $ | (9 | ) | $ | (28 | ) | $ | (47 | ) | |||||||||
|
4th
Quarter
|
$ | 17 | $ | 10 | $ | 4 | $ | (3 | ) | $ | (9 | ) | $ | (16 | ) | |||||||||
|
Total
2011
|
$ | 163 | $ | 99 | $ | 35 | $ | (29 | ) | $ | (92 | ) | $ | (156 | ) | |||||||||
In the
Rocky Mountains, we hedged basis associated with approximately 17 Bcf of our
natural gas production from October 2009 through full-year 2012. This is in
addition to the 8,000 mmbtu/d sold on a fixed physical basis for the same term
for a total basis hedged for the period at an average of $(0.94) per
Mmbtu.
In the Mid-Continent, we
hedged basis associated with approximately 14 Bcf of our anticipated
Stiles/Britt Ranch production from October 2009 through August 2011. This is in
addition to the 30,000 mmbtu/d sold on a fixed physical basis for the same term
for a total basis hedged for the period at an average of $(0.52) per Mmbtu. In
addition, we hedged basis associated with approximately 23 Bcf of our natural
gas production from this area for the period September 2011 through December
2012 at an average of $(0.55) per Mmbtu.
Approximately
10% of our natural gas production correlates to Houston Ship Channel, 13% to
Columbia Gulf, 13% to Texas Gas Zone 1, 5% to Southern Natural Gas, 10% to Tenn
100, 6% to CenterPoint/East, 24% to Panhandle Eastern Pipeline, 6% to Waha, 7%
to Colorado Interstate, 6% to others.
CRUDE
OIL HEDGE POSITIONS
The
following hedge positions for the fourth quarter of 2009 and beyond are as of
October 20, 2009:
Fourth Quarter
2009
|
Weighted
Average
|
Range
|
|||||||||||||||||||
|
Volume
|
Fixed
|
Floors
|
Collars
|
Floor
|
Ceiling
|
|||||||||||||||
|
828,000
Bbls
|
$ | 128.93 | — | — | — | — | ||||||||||||||
|
828,000
Bbls
|
— | $ | 107.11 | — | $ | 104.50 — $109.75 | — | |||||||||||||
First Quarter
2010
|
Weighted
Average
|
Range
|
|||||||||||||||||||
|
Volume
|
Fixed
|
Floors
|
Collars
|
Floor
|
Ceiling
|
|||||||||||||||
|
90,000
Bbls
|
$ | 93.40 | — | — | — | — | ||||||||||||||
|
810,000
Bbls
|
— | — | $ | 127.97— $170.00 | $ | 125.50 — $130.50 | $ | 170.00 | ||||||||||||
|
180,000
Bbls*
|
— | — | $ | 60.00— $112.05 | $ | 60 | $ | 112.00—$112.10 | ||||||||||||
10
Second Quarter
2010
|
Weighted
Average
|
Range
|
|||||||||||||||||||
|
Volume
|
Fixed
|
Floors
|
Collars
|
Floor
|
Ceiling
|
|||||||||||||||
|
90,000
Bbls
|
$ | 93.40 | — | — | — | — | ||||||||||||||
|
819,000
Bbls
|
— | — | $ | 127.97— $170.00 | $ | 125.50 — $130.50 | $ | 170.00 | ||||||||||||
|
182,000
Bbls*
|
— | — | $ | 60.00— $112.05 | $ | 60 | $ | 112.00—$112.10 | ||||||||||||
Third Quarter
2010
|
Weighted
Average
|
Range
|
|||||||||||||||||||
|
Volume
|
Fixed
|
Floors
|
Collars
|
Floor
|
Ceiling
|
|||||||||||||||
|
90,000
Bbls
|
$ | 93.40 | — | — | — | — | ||||||||||||||
|
828,000
Bbls
|
— | — | $ | 127.97— $170.00 | $ | 125.50 — $130.50 | $ | 170.00 | ||||||||||||
|
184,000
Bbls*
|
— | — | $ | 60.00— $112.05 | $ | 60 | $ | 112.00—$112.10 | ||||||||||||
Fourth Quarter
2010
|
Weighted
Average
|
Range
|
|||||||||||||||||||
|
Volume
|
Fixed
|
Floors
|
Collars
|
Floor
|
Ceiling
|
|||||||||||||||
|
90,000
Bbls
|
$ | 93.40 | — | — | — | — | ||||||||||||||
|
828,000
Bbls
|
— | — | $ | 127.97— $170.00 | $ | 125.50 — $130.50 | $ | 170.00 | ||||||||||||
|
184,000
Bbls*
|
— | — | $ | 60.00— $112.05 | $ | 60 | $ | 112.00—$112.10 | ||||||||||||
*These 3-way collar contracts are
standard crude oil collar contracts with respect to the periods, volumes and
prices stated above. The contracts have floor and ceiling prices per Bbls as per
the table above until the price drops below a weighted average price of $50 per
Bbls. Below $50 per Bbls, these contracts effectively result in realized prices
that are on average $10 per Bbls higher than the cash price that otherwise would
have been realized.
The following table details the
expected impact to pre-tax income from the settlement of our derivative
contracts, outlined above, at various NYMEX oil prices, net of premiums paid for
these contracts (in millions).
|
Oil
Prices
|
||||||||||||||||||||||||||||
| $ | 40.00 | $ | 50.00 | $ | 60.00 | $ | 70.00 | $ | 80.00 | $ | 90.00 | $ | 100.00 | |||||||||||||||
|
2009
|
||||||||||||||||||||||||||||
|
4th
Quarter
|
$ | 129 | $ | 115 | $ | 99 | $ | 84 | $ | 70 | $ | 54 | $ | 39 | ||||||||||||||
|
Total
2009
|
$ | 129 | $ | 115 | $ | 99 | $ | 84 | $ | 70 | $ | 54 | $ | 39 | ||||||||||||||
|
2010
|
||||||||||||||||||||||||||||
|
1st
Quarter
|
$ | 70 | $ | 61 | $ | 50 | $ | 42 | $ | 33 | $ | 23 | $ | 14 | ||||||||||||||
|
2nd
Quarter
|
$ | 71 | $ | 62 | $ | 51 | $ | 42 | $ | 33 | $ | 24 | $ | 15 | ||||||||||||||
|
3rd
Quarter
|
$ | 72 | $ | 63 | $ | 52 | $ | 42 | $ | 33 | $ | 24 | $ | 15 | ||||||||||||||
|
4th
Quarter
|
$ | 72 | $ | 62 | $ | 52 | $ | 42 | $ | 33 | $ | 24 | $ | 15 | ||||||||||||||
|
Total
2010
|
$ | 285 | $ | 248 | $ | 205 | $ | 168 | $ | 132 | $ | 95 | $ | 59 | ||||||||||||||
We
provide information regarding our outstanding hedging positions in our annual
and quarterly reports filed with the SEC and in our electronic publication --
@NFX. This publication can be found on Newfield’s web page at http://www.newfield.com. Through the web page,
you may elect to receive @NFX through e-mail distributions.
Newfield
Exploration Company is an independent crude oil and natural gas exploration and
production company. The Company relies on a proven growth strategy of growing
reserves through the drilling of a balanced risk/reward portfolio and select
acquisitions. Newfield's domestic areas of operation include the U.S. onshore
Gulf Coast, the Anadarko and Arkoma Basins of the Mid-Continent, the Rocky
Mountains and the Gulf of Mexico. The Company has international operations in
Malaysia and China.
11
**This
publication contains forward-looking information. All information other than
historical facts included in this release, such as information regarding
estimated or anticipated fourth quarter 2009 results, estimated capital
expenditures, cash flow, production and cost reductions, drilling and
development plans and the timing of activities, is forward-looking information.
Although Newfield believes that these expectations are reasonable, this
information is based upon assumptions and anticipated results that are subject
to numerous uncertainties and risks. Actual results may vary significantly from
those anticipated due to many factors, including drilling results, oil and gas
prices, industry conditions, the prices of goods and services, the availability
of drilling rigs and other support services, the availability of refining
capacity for the crude oil Newfield produces from its Monument Butte field in
Utah, the availability and cost of capital resources, labor conditions and
severe weather conditions (such as hurricanes). In addition, the drilling of oil
and gas wells and the production of hydrocarbons are subject to governmental
regulations and operating risks.
12