Attached files
| file | filename |
|---|---|
| 8-K - FORM 8-K - GOODRICH CORP | c91264e8vk.htm |
| EX-99.1 - EXHIBIT 99.1 - GOODRICH CORP | c91264exv99w1.htm |
Exhibit 99.2

| Goodrich Corporation Third Quarter 2009 Results October 22, 2009 |

| Certain statements made in this presentation are forward-looking statements within the meaning of the Private Securities Litigation Reform Act of 1995 regarding the Company's future plans, objectives and expected performance. The Company cautions readers that any such forward- looking statements are based on assumptions that the Company believes are reasonable, but are subject to a wide range of risks, and actual results may differ materially. Important factors that could cause actual results to differ include, but are not limited to: demand for and market acceptance of new and existing products, such as the Airbus A350 XWB and A380, the Boeing 787 Dreamliner, the Embraer 190, the Dassault Falcon 7X, the Lockheed Martin F-35 Lightning II and the Northrop Grumman Joint STARS re-engining program; the health of the commercial aerospace industry, including the impact of bankruptcies and/or mergers in the airline industry; global demand for aircraft spare parts and aftermarket services; and other factors discussed in the Company's filings with the Securities and Exchange Commission and in the Company's October 22, 2009 Third Quarter 2009 Results press release. The Company cautions you not to place undue reliance on the forward-looking statements contained in this presentation, which speak only as of the date on which such statements were made. The Company undertakes no obligation to release publicly any revisions to these forward- looking statements to reflect events or circumstances after the date on which such statements were made or to reflect the occurrence of unanticipated events. Forward Looking Statements |

| Financial and Operational Highlights |

| Third Quarter 2009 Highlights Board of Directors declared increased quarterly dividend $0.27 quarterly dividend payable January 4, 2010 8% increase from prior level Third consecutive annual increase Selected to provide new carbon brakes and boltless wheels for C- 130 aircraft Could generate $400 million in revenue over the life of the program, including original equipment and aftermarket sales to U.S. and international customers Signed agreements to form two joint ventures with XAIC in China Both joint venture companies expected to compete for positions on China's new COMAC C919 single aisle aircraft U.S. Air Force authorized continued development of the Operationally Responsive Space (ORS) program Followed successful Critical Design Review (CDR) First satellite launch scheduled for late 2010 |

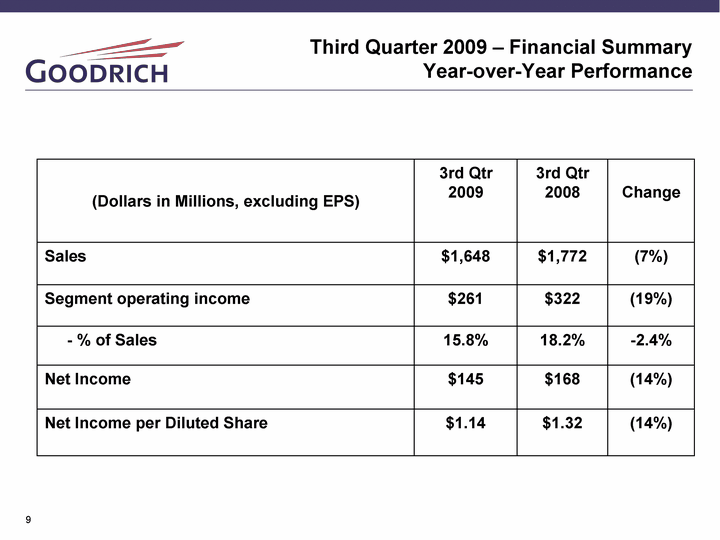
| Third Quarter 2009 Results Third quarter 2009 sales of $1,648 million decreased 7 percent compared to third quarter 2008 sales of $1,772 million Compared to the third quarter 2008, sales were reduced by a total of approximately $67 million for impacts of FX and formation of the engine controls JV with Rolls-Royce Third quarter 2009 net income per diluted share of $1.14 decreased 14 percent compared to third quarter 2008 net income per diluted share of $1.32 Third quarter 2009 total segment operating income margin was 15.8 percent, compared to 18.2 percent in the third quarter 2008 Higher 2009 pension expense reduced third quarter 2009 margins by 1.3%, compared to third quarter 2008 Net cash provided by operating activities, minus capital expenditures, of $211 million 150% conversion of income from continuing operations |

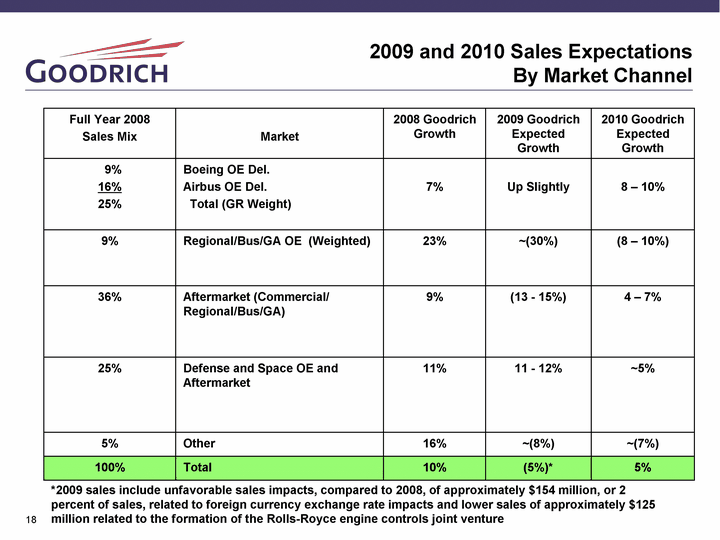
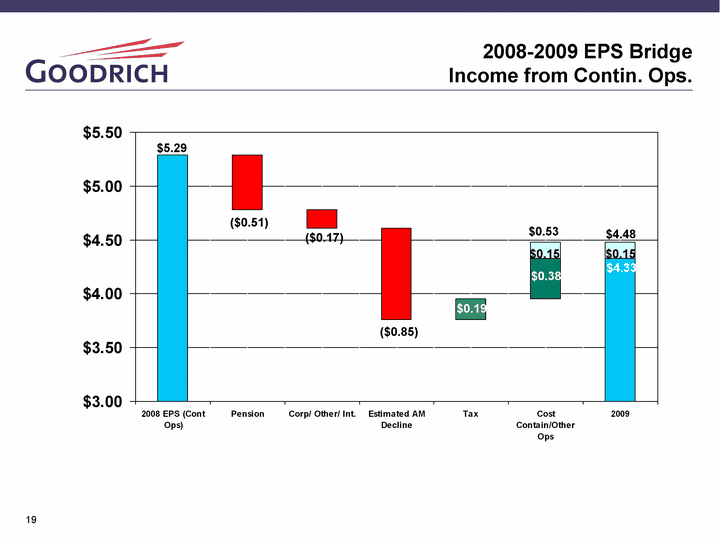
| Full Year 2009 Outlook Sales outlook of approximately $6.7 billion - a decrease of approximately 5% compared to 2008 results Large commercial OE sales expected to increase slightly Regional, business and general aviation OE sales expected to decrease by almost 30% Large commercial, regional business and general aviation aftermarket sales expected to decrease 13 - 15% Defense and space sales expected to increase 11 - 12% Sales outlook includes unfavorable sales impacts, compared to 2008, of: Approximately $154 million (2% of sales) related to foreign currency exchange rate impacts, and Approximately $125 million (2% of sales) related to the formation of the Rolls-Royce engine controls joint venture Outlook for net income per diluted share unchanged at $4.60 - $4.75, including: Higher pension expense of $0.51 per share, compared to 2008 pension expense Income from discontinued operations of approximately $0.27 per diluted share Net cash provided by operating activities, minus capital expenditures, expected to be greater than 75% of net income from continuing operations |

| Full Year 2010 Outlook Sales outlook of approximately $7.0 billion - an increase of approximately 5% compared to 2009 results Large commercial OE sales expected to be increase 8 - 10%, assuming Current narrowbody production rates are maintained through early 2011 787 deliveries begin in late 2010 Regional, business and general aviation OE sales expected to decrease by 8 - 10% Large commercial, regional business and general aviation aftermarket sales expected to increase 4 - 7%, assuming Available seat miles increase in the range of 1 - 3% Defense and space sales increase by about 5% Outlook for net income per diluted share of $4.15 - $4.40, including: Higher pension expense of $0.14 per share, compared to 2009 pension expense Assumes 2009 rate of return on U.S. plan assets of 8.75%, 2010 U.S. discount rate of 5.6%, consistent with experience through September 30, 2009 2010 Pension expense will be finalized based on December 31,2009 actual asset values and discount rates Full year 2010 effective tax rate of 29 - 30%, compared with 26 - 27% expected rate for 2009 Reduces income per diluted share by $0.19, compared to 2009 Net cash provided by operating activities, minus capital expenditures, expected to be approximately 85% of net income from continuing operations |

| Year-over-Year Financial Results |

| (Dollars in Millions, excluding EPS) 3rd Qtr 2009 3rd Qtr 2008 Change Sales $1,648 $1,772 (7%) Segment operating income $261 $322 (19%) - % of Sales 15.8% 18.2% -2.4% Net Income $145 $168 (14%) Net Income per Diluted Share $1.14 $1.32 (14%) Third Quarter 2009 - Financial Summary Year-over-Year Performance |

| (Dollars in Millions, excluding EPS) First Nine Months 2009 First Nine Months 2008 Change Sales $5,043 $5,367 (6%) Segment operating income $825 $940 (12%) - % of Sales 16.4% 17.5% -1.1% Net Income $492 $513 (4%) Net Income per Diluted Share $3.88 $4.01 (3%) First Nine Months 2009 - Financial Summary Year-over-Year Performance |

| Third Quarter 2009 Year-over-Year Financial Change Analysis (Dollars in Millions) (Dollars in Millions) Item Sales After-tax Income Per Diluted Share Third Quarter 2008 - Net Income $1,772 $168 $1.32 Overall volume, cost containment, efficiency, mix, share count, other ($57) ($4) ($0.02) Decrease revision of estimates for certain long-term contracts ($16) ($0.13) Lower effective tax rate $21 $0.17 Increased pension expense ($16) ($0.13) Increased restructuring expenses ($4) ($0.04) Share-based compensation ($2) ($0.02) Increased Interest and Other income (expense) ($5) ($0.04) Discontinued Operations $3 $0.03 Sales impact of FX and formation of JV ($67) N/A N/A Third Quarter 2009 - Net Income $1,648 $145 $1.14 |

| Third Quarter 2009 Year-over-Year Segment Results 3rd Quarter 2009 3rd Quarter 2008 Change Change Dollars in Millions 3rd Quarter 2009 3rd Quarter 2008 $ % Sales Actuation and Landing Systems Nacelles and Interior Systems Electronic Systems Total Sales $ 629.3 $ 561.8 $ 456.6 $1,647.7 $ 664.2 $ 596.5 $ 511.6 $1,772.3 ($ 34.9) ($ 34.7) ($ 55.0) ($ 124.6) (5%) (6%) (11%) (7%) Segment OI Actuation and Landing Systems Nacelles and Interior Systems Electronic Systems Total Segment OI $ 59.7 $130.8 $ 70.4 $260.9 $ 80.0 $ 162.4 $ 79.3 $ 321.7 ($ 20.3) ($ 31.6) ($ 8.9) ($ 60.8) (25%) (19%) (11%) (19%) Segment Margin Actuation and Landing Systems Nacelles and Interior Systems Electronic Systems Overall Segment Margin 9.5% 23.3% 15.4% 15.8% 12.0% 27.2% 15.5% 18.2% N/A N/A N/A N/A -2.5% -3.9% -0.1% -2.4% |

| Summary Cash Flow Information Item (Dollars in Millions) 3rd Quarter 2009 3rd Quarter 2008 Net Income - Continuing Operations $145 $172 Depreciation and Amortization $62 $65 Working Capital - (increase)/decrease - defined as the sum of A/R, Inventory and A/P ($75) ($72) Deferred income taxes and taxes payable $18 $31 Pension Contributions - worldwide ($14) ($81) All other $117 $26 Cash Flow from Operations $253 $141 Capital Expenditures ($42) ($73) |

| Sales by Market Channel |

| Boeing Airbus Regional, Business, GA OE Commercial A/C Aftermarket Regional, Business & GA Aftmkt Military aftermarket Milatary OE Other East 10 16 7 28 5 12 17 5 First Nine Months 2009 Sales by Market Channel Total Sales $5.043 Billion Large Commercial Aircraft Aftermarket 28% Regional, Business & General Aviation Aftermarket 5% Boeing Commercial OE 10% Airbus Commercial OE 16% Defense & Space, OE & Aftermarket 29% Other 5% OE AM Balanced business mix; aftermarket represents 45% of total sales Regional, Business & Gen. Av. OE 7% Total Commercial Aftermarket 33% Total Commercial OE 33% Total Defense and Space 29% |

| Sales by Market Channel 2009 Change Analysis Actual Goodrich Change Comparisons Actual Goodrich Change Comparisons Actual Goodrich Change Comparisons 3Q 2009* vs. 3Q 2008 3Q 2009* vs. 2Q 2009 First 9 Months 2009** vs. First 9 Months 2008 Boeing and Airbus - OE Production Aircraft Deliveries 9% (4%) (2%) Regional, Business & General Aviation - OE Aircraft Deliveries (45%) (22%) (27%) Aftermarket - Large Commercial, Regional, Business and GA ASMs, Age, Cycles, Fleet size (19%) (3%) (14%) Defense and Space - OE and Aftermarket US, UK Defense Budgets 9% 3% 10% Other IGT, Other (12%) (5%) (9%) Goodrich Total Sales (7%) (3%) (6%) *Includes unfavorable sales impacts, compared to 3Q2008, of approximately $67 million related to foreign currency exchange rate impacts and lower sales resulting from the formation of the Rolls-Royce engine controls joint venture ** Includes unfavorable sales impacts, compared to First Nine Months 2008, of approximately $262 million related to foreign currency exchange rate impacts and lower sales resulting from the formation of the Rolls-Royce engine controls joint venture |

| 2009 & 2010 Outlook |

| 2009 and 2010 Sales Expectations By Market Channel Full Year 2008 Sales Mix Market 2008 Goodrich Growth 2009 Goodrich Expected Growth 2010 Goodrich Expected Growth 9% 16% 25% Boeing OE Del. Airbus OE Del. Total (GR Weight) 7% Up Slightly 8 - 10% 9% Regional/Bus/GA OE (Weighted) 23% ~(30%) (8 - 10%) 36% Aftermarket (Commercial/ Regional/Bus/GA) 9% (13 - 15%) 4 - 7% 25% Defense and Space OE and Aftermarket 11% 11 - 12% ~5% 5% Other 16% ~(8%) ~(7%) 100% Total 10% (5%)* 5% *2009 sales include unfavorable sales impacts, compared to 2008, of approximately $154 million, or 2 percent of sales, related to foreign currency exchange rate impacts and lower sales of approximately $125 million related to the formation of the Rolls-Royce engine controls joint venture |

| 2008-2009 EPS Bridge Income from Contin. Ops. 2008 EPS (Cont Ops) Pension Corp/ Other/ Int. Estimated AM Decline Tax Cost Contain/Other Ops 2009 East 5.29 4.78 4.61 3.76 3.76 3.95 4.33 West 0.51 0.17 0.85 0.19 0.38 0.15 0.15 $5.29 ($0.51) ($0.17) ($0.85) $0.19 $0.38 $0.15 $0.15 $4.48 $4.33 $0.53 |

| 2009-2010 EPS Bridge Income from Continuing Operations 2009F Pension Tax Rate (29.5% v 26.5%) Volume & Operational Performance 2010E East 4.33 4.27 4.08 4.08 4.15 0.15 0.25 $4.33 ($0.14) ($0.19) $0.25 $4.15 $4.40 $0.32 Outlook Range Income from Continuing Operations Based on discount rate/ returns through 9/30/09 $0.15 $4.48 |

| Estimate 2009 Estimate 2010 B/(W) Sales ~$6.7B ~$7.0B ~5% Diluted EPS - Continuing Operations $4.33 - $4.48 $4.15 - $4.40 + or - Flat Diluted EPS - Reported $4.60 - $4.75 $4.15 - $4.40 (5 - 11%) Net cash provided by operating activities, minus capital expenditures, as a percent of income from continuing operations >75% ~85% N/A Capital Expenditures $190 - $200 $250 - $275 ($65 - $85) Effective Tax Rate ~26 - 27% ~29 - 30% N/A 2009 and 2010 Outlook Summary ($M) |
