Attached files
| file | filename |
|---|---|
| 8-K - FORM 8-K - ManpowerGroup Inc. | form_8k.htm |
| EX-99.1 - PRESS RELEASE DATED OCTOBER 21, 2009 - ManpowerGroup Inc. | exhibit_99-1.htm |

Exhibit
99.2
Helping Clients and Candidates
Win for Over
Six
Decades
2009 October
21
MANPOWER
INC.
2009
3rd Quarter
Results

2
This presentation
includes forward-looking
statements which are subject to risks and
uncertainties. Actual results might differ
materially from those projected in the forward-
looking statements. Additional information
concerning factors that could cause actual
results to materially differ from those in the
forward-looking statements is contained in the
Company’s Annual Report on Form 10-K
dated December 31, 2008, which information
is incorporated herein by reference, and such
other factors as may be described from time
to time in the Company’s SEC filings.
Forward-Looking
Statement
3
(1) Excludes
non-recurring items for 2009 and 2008 as set forth on page 15.
N/A
26%
22%
CC
90
bps
Operating
Profit ($19M)
OP
Margin -
0.5%
Revenue $4.2B
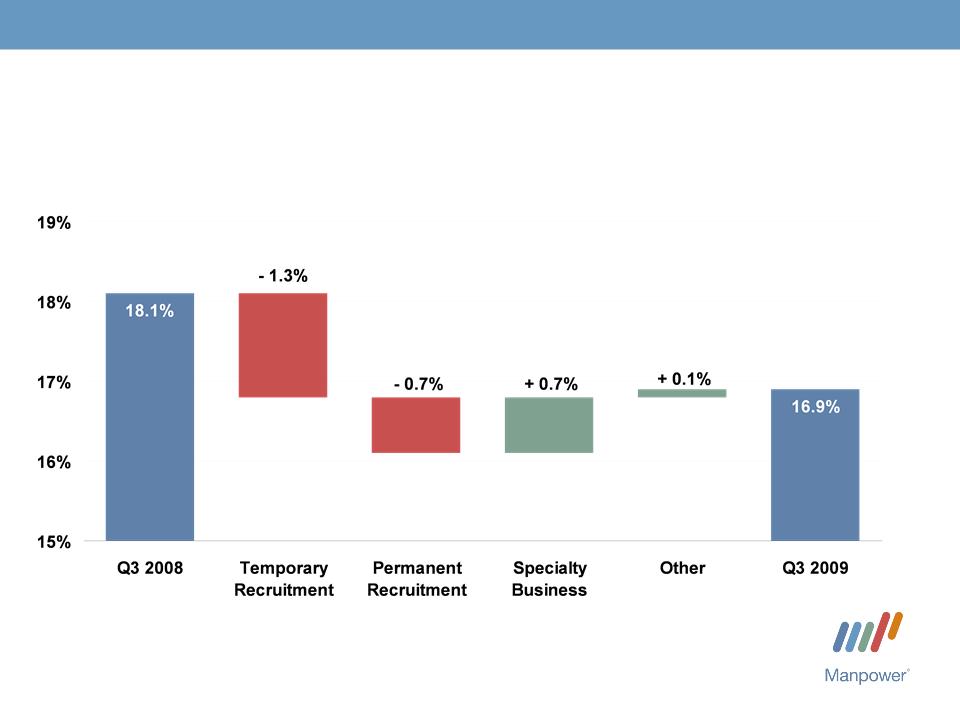
Gross
Margin 16.9%
EPS
($.64)
120
bps
N/A
N/A
N/A
Q3
Highlights
Throughout
this presentation, the difference between reported variances and Constant
Currency (CC) variances
represents the impact of currency on our financial results. Constant Currency is further explained on our Web site.
represents the impact of currency on our financial results. Constant Currency is further explained on our Web site.
As
Reported
Reported
80%
CC
26%
22%
CC
120
bps
230
bps
82%
77%
76%
CC
Excluding
Non-recurring
Items
Items
(1)
Consolidated
Financial Highlights
4
Consolidated Gross
Margin Change
5
14%
CC
Q3
Financial Highlights
20%
OUP
Margin
0.7%
160
bps
Revenue
$653M
OUP
$5M
Operating
Unit Profit (OUP) is the measure that we use to evaluate
segment
performance. OUP is equal to segment revenues less direct costs and branch and
national headquarters operating costs.
performance. OUP is equal to segment revenues less direct costs and branch and
national headquarters operating costs.
(2)
(1) Included in these
amounts is the US, which had revenue of $410M (-21%) and OUP of
$(1M).
(2) The results above
include the impact of acquisitions. On an
organic basis, Americas revenue decreased
21% in USD (16% in CC).
21% in USD (16% in CC).
(2)
(1)
69%
CC
76%
(2)
(2)
Americas
Segment
(16% of Revenue)
(16% of Revenue)
6
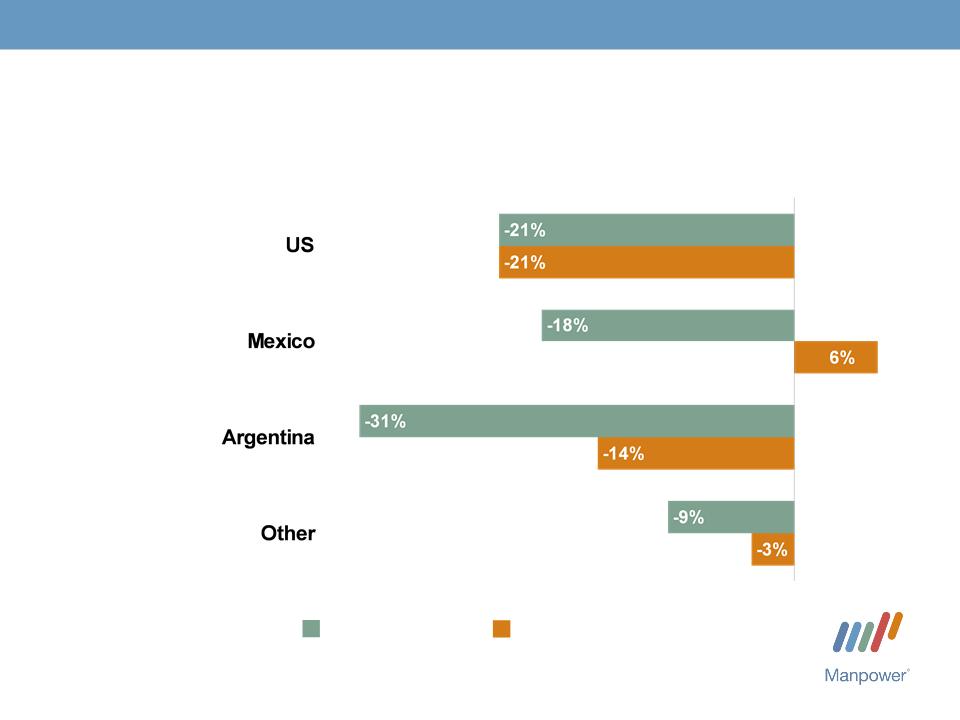
Revenue
Growth - CC
Revenue
Growth
%
of Segment
Revenue
63%
13%
6%
18%
(1)
(1) On an organic
basis, US revenue decreased 24% in USD.
Americas - Q3
Revenue Growth YoY
7
Q3
Financial Highlights
OUP
Margin
0.8%
Revenue
$1.3B
OUP
$11M
31%
27%
CC
270
bps
84%
83%
CC
France
Segment
(31% of Revenue)
(31% of Revenue)
8
Q3
Financial Highlights
OUP
Margin
1.6%
Revenue
$1.6B
OUP
$26M
31%
24%
CC
290
bps
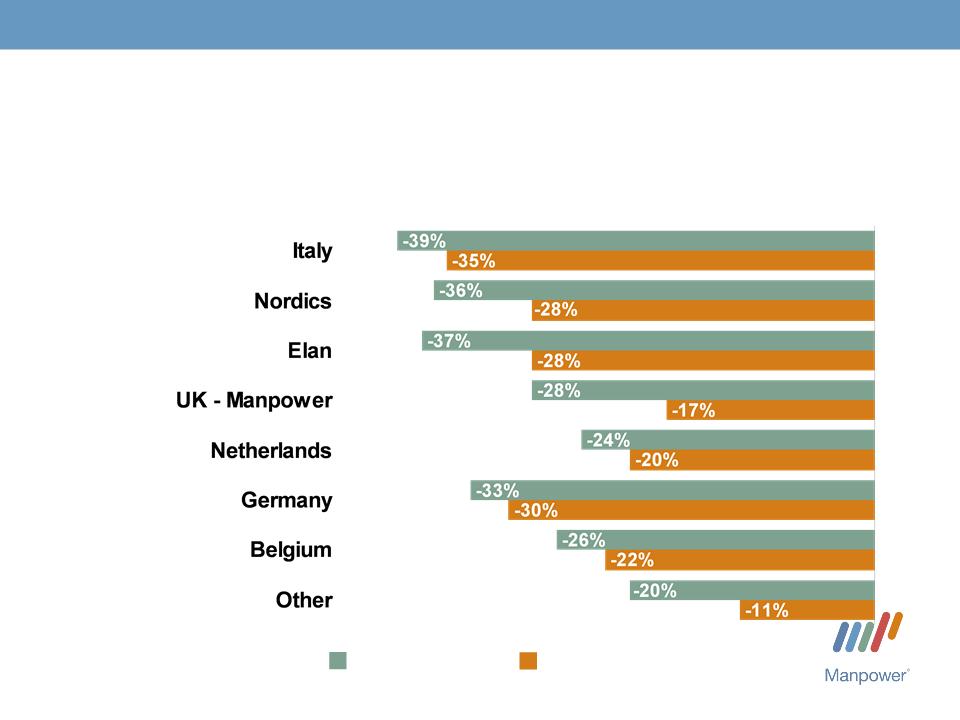
(1) Included in these
amounts is Italy, which had revenue of $231M (-39% in USD, -35% in CC) and OUP
of
$9M (-70% in USD, -68% in CC).
$9M (-70% in USD, -68% in CC).
76%
74%
CC
(1)
EMEA
Segment
(39% of Revenue)
(39% of Revenue)
9
Revenue
Growth - CC
Revenue
Growth
%
of Segment
Revenue
14%
14%
13%
11%
9%
6%
24%
9%
EMEA -
Q3 Revenue Growth YoY
10
Q3
Financial Highlights
OUP
Margin
0.9%
Revenue
$428M
OUP
$4M
6%
10%
CC
90
bps
51%
61%
CC
Asia
Pacific Segment
(10% of Revenue)
(10% of Revenue)
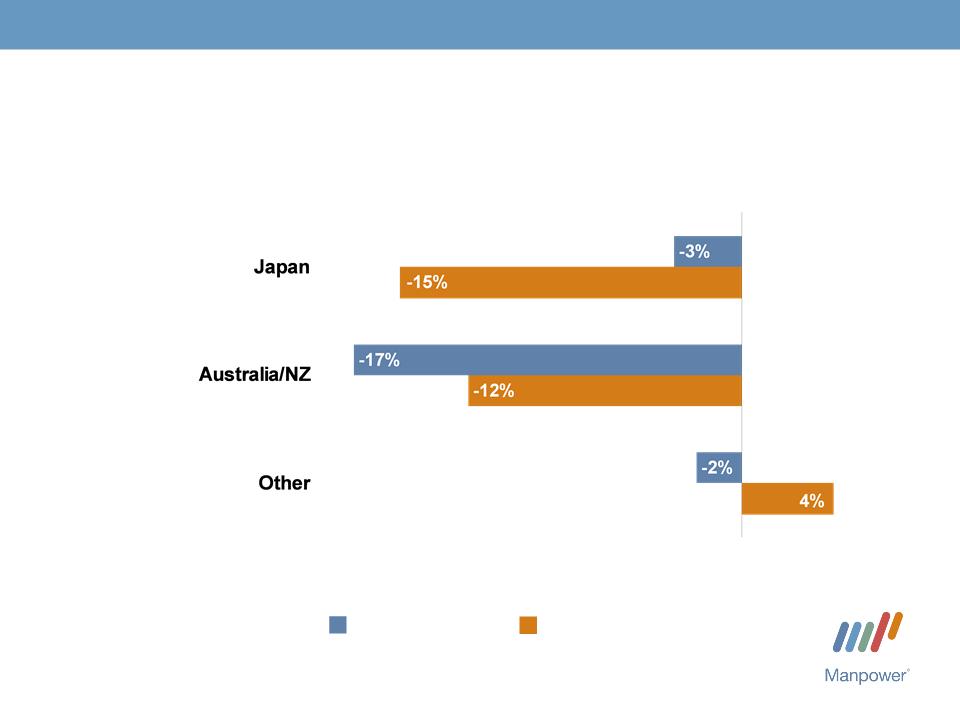
11
Revenue
Growth - CC
Revenue
Growth
%
of Segment
Revenue
58%
20%
22%
Asia
Pacific - Q3 Revenue Growth YoY
12
181%
176%
CC
Q3
Financial Highlights
OUP
Margin
15.6%
Revenue
$136M
OUP
$21M
25%
29%
CC
860
bps
Right
Management Segment
(3% of Revenue)
(3% of Revenue)

13
Jefferson Wells
Segment
(1% of Revenue)
(1% of Revenue)
Q3
Financial Highlights
OUP
Margin
-
1.2%
Revenue
$48M
OUP
$(1M)
90
bps
35%
N/A

14
Financial
Highlights
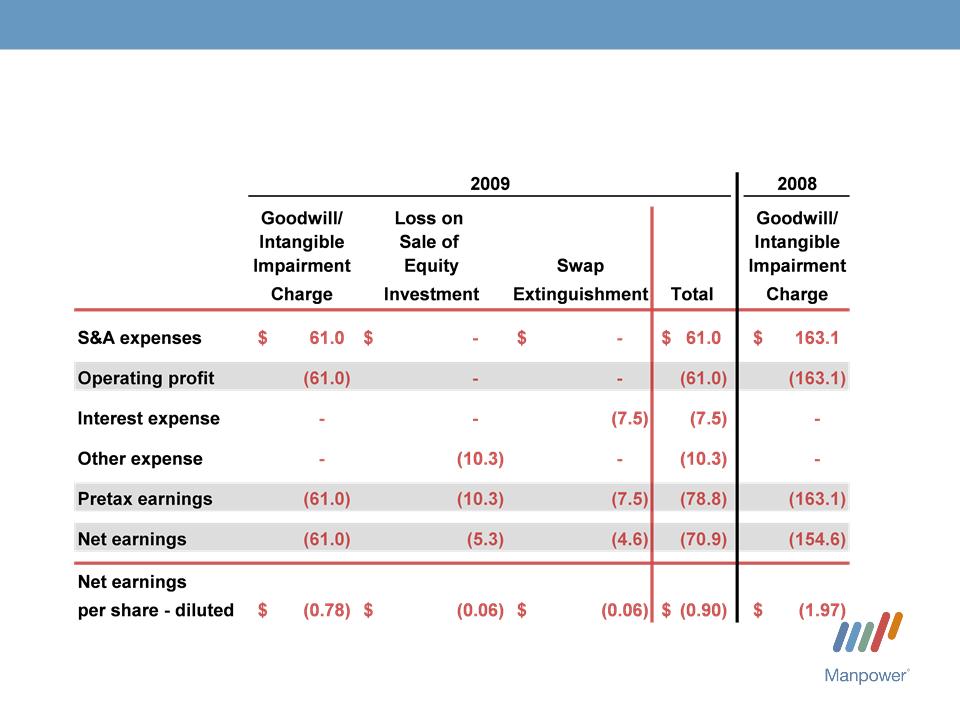
15
($ in
millions, except per share amounts)
Q3
Non-recurring Items
16
Other
(2)
Change
in Cash
327
94
(12)
2009
2008
Cash
from Operations
412
449
Capital
Expenditures
(27)
(71)
Free
Cash Flow
385
378
Share
Repurchases
-
(125)
Change
in Debt
(21)
87
($ in
millions)
Effect
of Exchange Rate Changes
54
(10)
Acquisitions
of Businesses,
net of
cash acquired
(224)
(89)
Cash
Flow Summary - Nine Months
17
Total
Debt
($ in
millions)
Total
Debt to
Total
Capitalization
Total
Debt
Net
Debt
2009
(a) On October 16, 2009,
we elected to repay the €100M ($146M) borrowing under the revolving
credit
agreement. If the repayment had been made on September 30, 2009, debt would have been $763M and
Total Debt to Total Capitalization would have been 23%.
agreement. If the repayment had been made on September 30, 2009, debt would have been $763M and
Total Debt to Total Capitalization would have been 23%.
(a)
(a)
Balance
Sheet Highlights

18
(a)
(a)
Effective October 16,
2009, we amended our Revolving Credit Agreement. The
amendment reduces the size of the facility from $625M to
$400M and revises covenant levels and pricing. The amended agreement requires, as of September 30, that we comply with a Debt-to-
EBITDA ratio of less than 3.25 to 1 and a fixed charge coverage ratio of greater than 1.50 to 1. As defined in the agreement, we had a Debt-to
-EBITDA ratio of 2.83 and a fixed charge coverage ratio of 1.95 as of September 30, 2009.
On
October 16, 2009, we elected to repay the €100M ($146M) borrowing under the
agreement and terminated the related interest rate swaps.
There are currently no outstanding borrowings under the agreement.
There are currently no outstanding borrowings under the agreement.
Interest
Rate
Maturity
Date
Total
Outstanding
Remaining
Available
Euro
Notes:
-
Euro 200M
4.86%
June
2013
293
-
-
Euro 300M
4.58%
June
2012
439
-
Revolving
Credit Agreement
6.21%
Nov
2012
146
468
382
Uncommitted
lines and Other
Various
Various
31
Total
Debt
909
850
Credit
Facilities as of September 30, 2009
($ in millions)
($ in millions)

19
Revenue
Americas
Down
10-13%
France
Down
9-11%
(Down
19-21% CC)
Down
1-3%
Asia
Pacific
(Down
8-10% CC)
Jefferson
Wells
Right
Management
Up
5-7%
(Up
1-3% CC)
Down
9-11%
(Down
16-18% CC)
Total
Gross
Profit Margin
17.4-17.6%
Operating
Profit Margin
0.9-1.1%
Tax
Rate
39%
EPS
(excluding
non-recurring items)
$0.17-$0.27
(Pos. $.03 Currency)
Down
30-32%
EMEA
(Down
19-21% CC)
Down
11-13%
(Down
9-11% CC)
Fourth
Quarter Outlook

Questions?
Answers
October
21, 2009
Manpower
Inc.
2009 3rd Quarter Results
2009 3rd Quarter Results