Attached files
Table of Contents
As filed with the Securities and Exchange Commission on October 21, 2009
No. 333-161381
UNITED STATES
SECURITIES AND EXCHANGE COMMISSION
Washington, D.C. 20549
Amendment No. 2
to
FORM S-1
REGISTRATION STATEMENT
UNDER
THE SECURITIES ACT OF 1933
HealthPort, Inc.
(Exact name of registrant as specified in its charter)
| Delaware | 7389 | 27-0717051 | ||
| (State or other jurisdiction of incorporation or organization) |
(Primary Standard Industrial Classification Code Number) |
(I.R.S. Employer Identification No.) |
925 North Point Parkway
Suite 350
Alpharetta, Georgia 30005
(770) 670-2150
(Address, including zip code, and telephone number, including area code, of registrant’s principal executive offices)
Michael J. Labedz
President and Chief Executive Officer
HealthPort, Inc.
925 North Point Parkway
Suite 350
Alpharetta, Georgia 30005
(770) 670-2150
(Name, address, including zip code, and telephone number, including area code, of agent for service)
Copies of all communications, including communications sent to agent for service, should be sent to:
| Joshua N. Korff, Esq. Jason K. Zachary, Esq. Kirkland & Ellis LLP 601 Lexington Avenue New York, New York 10022 (212) 446-4800 |
Wayne D. Boberg, Esq. Matthew F. Bergmann, Esq. Winston & Strawn LLP 35 West Wacker Drive Chicago, Illinois 60601 (312) 558-5600 |
Approximate date of commencement of proposed sale to the public: As soon as practicable after this Registration Statement becomes effective.
If any of the securities being registered on this Form are to be offered on a delayed or continuous basis pursuant to Rule 415 under the Securities Act of 1933, check the following box: ¨
If this Form is filed to register additional securities for an offering pursuant to Rule 462(b) under the Securities Act, please check the following box and list the Securities Act registration statement number of the earlier effective registration statement for the same offering. ¨
If this Form is a post-effective amendment filed pursuant to Rule 462(c) under the Securities Act, check the following box and list the Securities act registration statement number of the earlier effective registration statement for the same offering. ¨
If this Form is a post-effective amendment filed pursuant to Rule 462(d) under the Securities Act, check the following box and list the Securities Act registration statement number of the earlier effective registration statement for the same offering. ¨
Indicate by check mark whether the registrant is a large accelerated filer, an accelerated filer, a non-accelerated filer, or a smaller reporting company. See the definitions of “large accelerated filer,” “accelerated filer” and “smaller reporting company” in Rule 12b-2 of the Securities Exchange Act of 1934, as amended (the “Exchange Act”).
| Large accelerated filer ¨ |
Accelerated filer ¨ | Non-accelerated filer x | Smaller reporting company ¨ | |||
| (Do not check if a smaller reporting company) | ||||||
CALCULATION OF REGISTRATION FEE
| Title of Each Class of Securities to be Registered |
Amount to be |
Proposed Maximum |
Proposed Maximum Aggregate Offering Price(1)(2) |
Amount of Registration Fee(2)(3) | ||||
| Common Stock, $0.001 par value per share |
6,900,000 shares | $16.00 | $110,400,000 | $6,161 | ||||
| (1) | Includes shares of common stock that the underwriters have the option to purchase from us to cover over-allotments, if any. |
| (2) | Estimated solely for the purpose of calculating the registration fee pursuant to Rule 457(a) under the Securities Act of 1933, as amended. |
| (3) | A $5,580 registration fee was paid pursuant to Rule 457(o) on August 14, 2009 with respect to a proposed maximum aggregate offering price of $100,000,000. |
The registrant hereby amends this Registration Statement on such date or dates as may be necessary to delay its effective date until the registrant shall file a further amendment which specifically states that this Registration Statement shall thereafter become effective in accordance with Section 8(a) of the Securities Act of 1933 or until this Registration Statement shall become effective on such date as the Commission, acting pursuant to said Section 8(a), may determine.
Table of Contents
EXPLANATORY NOTE
HealthPort, Inc., the registrant whose name appears on the cover page of this registration statement, is a newly formed Delaware corporation. Shares of common stock of HealthPort, Inc. are being offered by this prospectus. We were formed solely for the purpose of reorganizing the organizational structure of CT Technologies Holdings, LLC in order for the registrant to be a corporation rather than a limited liability company. Prior to the effectiveness of this registration statement, each member of CT Technologies Holdings, LLC will contribute all of their equity interests in CT Technologies Holdings, LLC to us in return for our common and senior preferred stock. As a result, CT Technologies Holdings, LLC will become our wholly-owned subsidiary. We intend to use a portion of the net proceeds from this offering to redeem in whole our senior preferred stock. The consolidated financial statements and consolidated financial data included in this prospectus are those of CT Technologies Holdings, LLC and its consolidated subsidiaries and do not give effect to the corporate reorganization.
Table of Contents
The information in this preliminary prospectus is not complete and may be changed. We may not sell these securities until the registration statement filed with the Securities and Exchange Commission is effective. This preliminary prospectus is not an offer to sell these securities and it is not soliciting an offer to buy these securities in any state where the offer or sale is not permitted.
Subject to Completion, Dated October 21, 2009
PROSPECTUS
HealthPort, Inc.

6,000,000 Shares
Common Stock
This is the initial public offering of HealthPort, Inc. We are offering 6,000,000 shares of our common stock. We anticipate that the initial public offering price will be between $14.00 and $16.00 per share. We have applied to have our common stock approved for listing on The NASDAQ Global Market under the symbol “HPRT.”
After this offering, ABRY Partners, LLC, through its affiliated funds, will own approximately 56% of our common stock. We intend to use a portion of the net proceeds from this offering for the redemption in whole of our senior preferred stock and any remaining net proceeds for the repayment of a portion of our outstanding indebtedness.
Investing in our common stock involves risk. See “Risk Factors” beginning on page 15.
Neither the Securities and Exchange Commission nor any state securities commission has approved or disapproved of these securities or passed upon the accuracy of this prospectus. Any representation to the contrary is a criminal offense.
| Per Share | Total | |||||
| Public offering price |
$ | $ | ||||
| Underwriting discounts and commissions |
$ | $ | ||||
| Proceeds, before expenses, to HealthPort, Inc. |
$ | $ | ||||
We have granted the underwriters the right to purchase up to 900,000 additional shares of common stock to cover over-allotments.
Delivery of the shares of common stock in book-entry form only will be made on or about , 2009.
| Deutsche Bank Securities | William Blair & Company |
| Raymond James | Needham & Company, LLC | |
The date of this prospectus is , 2009.
Table of Contents
ABOUT THIS PROSPECTUS
We have a number of registered trademarks, including our corporate blue and grey logo and design. Solely for convenience, we refer to our trademarks in this prospectus without the™ and® symbols, but such references are not intended to indicate, in any way, that we will not assert, to the fullest extent under applicable law, our rights to our trademarks. This prospectus may contain trademarks and trade names of other companies. All trademarks and trade names appearing in this prospectus are the property of their respective holders.
INDUSTRY AND MARKET DATA
This prospectus includes market share and industry data and forecasts that we have obtained or developed from independent consultant reports, publicly-available information, various industry publications, other published industry sources and our internal data and estimates. This includes information relating to the healthcare industry from several independent outside sources, including International Data Corp., Frost & Sullivan, the U.S. Centers for Medicare and Medicaid Services, the American Health Information Management Association and various other governmental agencies. See “Business.”
Our internal data, estimates and forecasts are based upon information obtained from our customers, partners, trade and business organizations and other contacts in the markets in which we operate and our management’s understanding of industry conditions.
i
Table of Contents
This summary highlights information contained elsewhere in this prospectus and does not contain all of the information that you should consider in making your investment decision. Before investing in our common stock, you should carefully read this entire prospectus, including our consolidated financial statements and the related notes and the information set forth under the headings “Risk Factors” and “Management’s Discussion and Analysis of Financial Condition and Results of Operations,” in each case included elsewhere in this prospectus. Some of the statements in this prospectus constitute forward-looking statements. See “Forward-Looking Statements.”
We are a newly formed Delaware corporation that has not, to date, conducted any activities other than those incident to our formation and the preparation of this registration statement. We were formed solely for the purpose of reorganizing the organizational structure of CT Technologies Holdings, LLC in order for the registrant to be a corporation rather than a limited liability company. Prior to the effectiveness of this registration statement, each member of CT Technologies Holdings, LLC will contribute all of their equity interests in CT Technologies Holdings, LLC to us in return for our common stock and senior preferred stock. As a result, CT Technologies Holdings, LLC will become our wholly-owned subsidiary. We refer to the foregoing as our corporate reorganization. Except where the context otherwise requires or where otherwise indicated, (i) the terms “we,” “us,” “our,” “our company,” “our business” and “Successor” refer to HealthPort, Inc. and its consolidated subsidiaries as a combined entity, giving effect to our corporate reorganization and (ii) the term “Predecessor” or “Companion” refers to Companion Technologies Corporation. See “— Our Corporate Structure.” Certain differences in the numbers in the tables and text throughout this prospectus may exist due to rounding.
Our Business
We are a leading provider of healthcare information services and technology solutions to approximately 1,900 hospitals and health systems and 8,000 independent and hospital-affiliated physician clinics. Our primary business is providing outsourced technology-enabled release-of-information services to our customers, which we refer to as ROI. ROI is the process by which information contained in patient health records is requested by and provided to authorized requestors such as attorneys, insurance companies, government agencies and others. We believe we are the largest provider of ROI services with a market share of approximately 20%, and utilize our expertise and technology to fulfill requests for health records in an accurate, regulatory-compliant and timely manner. Our ROI services enable our customers to reduce staffing levels associated with these time-consuming and labor-intensive healthcare information functions, allowing them to increase their focus on patient care, and to more effectively comply with increasingly complex and cumbersome regulatory requirements. We also provide other software and services which complement our ROI services, including recovery audit compliance solutions, revenue cycle management software, healthcare coding and consulting services and physician practice management software.
Our centralized operating model, combined with our proprietary technology platform, is unique to the ROI industry and enables greater economies of scale as well as expedited response times and high service levels. Unlike our competitors’ ROI service offerings, which typically involve simply photocopying and mailing health records, we employ on-site digital
1
Table of Contents
imaging and electronically transfer the requested health record via an encrypted Internet-based channel to our centralized data center, from which we are able to deliver the information in either electronic or paper-based form based on the requestor’s preferred medium.
Healthcare providers are required by law to provide ROI services. We estimate, based upon publicly available market information, the total market for ROI services to be approximately $1.2 billion, of which we estimate approximately $500 million relates to hospitals and health systems and $700 million relates to independent and hospital-affiliated physician clinics. We estimate that approximately two-thirds of these services are performed using internal resources, while one-third is outsourced to third-party vendors. We believe we are the largest outsourced ROI provider with approximately 70% of the outsourced market. Requestors pay the healthcare provider or outsourced service provider for retrieval and delivery of the health record directly, in accordance with a fee schedule typically established by state regulation. As a result, unlike healthcare providers, we are not affected by changes in regulated reimbursement rates by commercial payers, Medicare or Medicaid. We believe that the complexity of healthcare regulation, as well as recent federal initiatives to control the rising cost of healthcare through the elimination of administrative and clinical inefficiencies, will significantly increase the adoption of healthcare information systems and promote the use of electronic transactions and further utilization of our outsourced services and solutions.
For the twelve months ended December 31, 2008, we generated net revenue of $188.2 million and incurred a net loss of $49.8 million. For the twelve months ended December 31, 2008, we generated pro forma net revenue of $242.1 million and incurred a pro forma loss from continuing operations of $59.2 million, inclusive of the September 2008 acquisition of ChartOne, Inc., or ChartOne, as if acquired on January 1, 2008. For the six months ended June 30, 2009, we generated net revenue of $126.8 million and incurred a net loss of $6.9 million. Our board of directors and management also use Adjusted EBITDA, a non-GAAP financial measure, as one of the primary measures for planning and forecasting overall expectations and for evaluating, on at least a quarterly and annual basis, our financial performance. See page 12 for a discussion of Adjusted EBITDA, an accompanying presentation of the most directly comparable GAAP financial measure and a reconciliation of the differences between Adjusted EBITDA and the most directly comparable GAAP financial measure.
Our Services and Solutions
We conduct our operations through two business segments: Release-of-Information Services and Software and Other Services. All of our services and solutions are supported by our proprietary technology platform. This infrastructure provides for connectivity between us, our hospital, health system and physician clinic customers, health record requestors and other constituents. In addition, it allows for functionality developed in our software and other services segment to be leveraged in our ROI services to enhance the value proposition to our customers.
Release-of-Information Services
We offer ROI services on an outsourced basis to hospitals, health systems and physician clinics. Our centralized operating model coupled with our proprietary technology platform enable us to offer important benefits to our ROI customers, including expedited response times
2
Table of Contents
and high service levels. We provide user-friendly, secure on-line tracking functionality for both requestors and customers with extensive reporting capabilities. We also offer the ability for qualified requestors to access their health record requests on-line, and our flexible platform allows most electronic health record, or EHR, systems to integrate into our proprietary technology. To accommodate paper-based requests, our centralized data center uses an automated document processing system. This system performs address verification and electronic pre-sort functions, produces postage statements and prints, packages and seals the requested materials, resulting in high efficiency levels.
Software and Other Services
Our software and other services segment provides solutions that complement our ROI services, including recovery audit contractor, or RAC, compliance solutions, revenue cycle management, or RCM, software, healthcare coding and consulting services and physician practice management software. Our RAC solution allows our customers to prepare for and comply with a new Medicare payment recovery system that is being phased in and is scheduled for nationwide implementation in 2010, helping them track and organize health record requests, coding, billing, reviews and all associated paperwork. Our RCM software enables healthcare providers to ensure that payment is properly received for the medical services provided to patients. Our healthcare coding and consulting services include compliance expertise with the Health Insurance Portability and Accountability Act, or HIPAA, data management, compliance auditing, education, master patient index classification and medical coding. Our practice management software assists physician practices with administrative tasks such as patient information tracking, appointment scheduling and billing.
Our Strengths
Leading Market Position. We believe we are the largest ROI service provider to the healthcare industry with approximately 20% of the ROI services market. We believe that approximately two-thirds of ROI services are performed using internal resources and the remaining one-third is outsourced to third-party vendors. We believe we are the largest outsourced ROI provider with approximately 70% of the outsourced market. The remaining portion of the market is highly fragmented, consisting primarily of regional and local providers. As a result of increased legislative complexity and cost containment initiatives, we believe healthcare providers are increasingly adopting an outsourced strategy.
Advanced ROI Services. Our centralized operating model, combined with our proprietary technology platform, is unique to the outsourced ROI industry and allows for greater efficiencies and accuracy in processing health information requests. We employ on-site digital imaging, which enables requested health records to be transmitted electronically to our centralized data center, driving significant economies of scale.
Compelling Value Proposition. We offer a compelling value proposition for hospitals, health systems and physician clinics by allowing these healthcare providers to reduce staffing levels associated with time-consuming and labor-intensive healthcare information management functions. A reduced administrative burden allows our customers to focus on patient care and more effectively comply with complex regulatory requirements.
Highly Predictable Revenue Model. We operate a highly predictable and non-cyclical business model, and our ROI customer retention rates have historically exceeded 95%. In
3
Table of Contents
addition, the majority of our ROI customers have entered into multi-year contracts with us, which typically generate recurring volumes of health record requests. In excess of 95% of our revenue are repeat or recurring in nature because of the contractual nature of our business.
Strong Cash Flow with Low Capital Requirements. Our business generates strong, stable cash flows as a result of our significant operating leverage, our relatively low working capital requirements and the modest capital expenditures needed to support our infrastructure. In addition, to the extent that we can generate pre-tax income in the future, we expect to be able to use our approximately $126 million of federal net operating loss carryforwards, as of December 31, 2008, to offset our potential future taxable income, subject to federal tax limitations.
Diversified Customer Base. We serve approximately 1,900 hospitals and health systems and 8,000 independent and hospital-affiliated physician clinics, with no single customer accounting for more than 1% of our revenue. In addition, our customers are also highly diversified by geography, type and size, with customers ranging from national hospital systems and academic institutions to small rural clinics.
Experienced Management Team. We have assembled a highly experienced management team. Our senior management team averages more than 20 years of healthcare industry experience.
Our Growth Strategy
Increase Penetration of ROI Services Market. We believe that the overall trend towards outsourcing non-core functions across the healthcare industry will continue to apply to the outsourcing of the ROI process. The increasing complexity of healthcare legislation in combination with recent federal initiatives to control the rising cost of healthcare through the elimination of administrative and clinical inefficiencies will further accelerate the outsourcing trend and, we believe, increase the use of our outsourcing services by hospitals, health systems and physician clinics. We also believe that our proprietary technology and our ability to help our customers maintain regulatory compliance while reducing costs will continue to allow us to successfully differentiate our ROI services from those of our competitors and increase our market share.
Enhance Our Value Proposition through New Services and Solutions. We leverage our ROI services platform to develop and drive the adoption of new services and solutions within the healthcare information management function of our customers. Our long-standing customer relationships provide us with ongoing opportunities to examine our customers’ needs and to design and offer additional value-added services and solutions to address those needs.
Capitalize on Industry Trends. We believe that increasing regulatory complexity, advancements in information technology and the continued growth in the volume of health records will continue to drive ROI industry growth and will cause more healthcare providers to outsource ROI services.
Further Realize Efficiencies of Scale and Rationalize Costs to Improve Profitability. We evaluate and implement initiatives on an ongoing basis to improve our operating and financial performance through cost savings, productivity improvements and streamlining our operations by using new technologies.
4
Table of Contents
Continue to Successfully Acquire and Integrate Businesses. We have grown our business both organically and through acquisitions and have successfully acquired and integrated multiple businesses across the ROI and healthcare information technology sectors. We intend to continue to selectively acquire businesses that will expand our services and solutions while enhancing value for our company.
Risk Factors
Investing in our company entails a high degree of risk, including those summarized below and those more fully described in the “Risk Factors” section beginning on page 15 of this prospectus. You should consider carefully such risks before deciding to invest in our common stock. These risks include, among others:
| • | our ability to retain existing customers; |
| • | our limited operating history in light of recent acquisitions and growth, including our lack of public company operating experience; |
| • | the integration of acquired businesses, the performance of acquired businesses and the prospects for future acquisitions; |
| • | our history of operating losses and ability to use net loss carryforwards; |
| • | competition in the markets in which we serve; |
| • | changes in prices set by various state legislatures and regulatory bodies; |
| • | our ability to increase market penetration in the in-sourced ROI services market; |
| • | departure of key executives; |
| • | changes in healthcare laws and regulations; and |
| • | the other factors set forth under “Risk Factors.” |
Our Principal Stockholder
Following the completion of this offering, ABRY Partners, LLC, which we refer to as ABRY Partners, through its affiliated funds, will own approximately 56% of our outstanding common stock, or 54% if the underwriters’ over-allotment option is fully exercised. This ownership of our shares by ABRY Partners will result in their ability to have a majority vote over fundamental and significant corporate matters and transactions. See “Risk Factors — Risks Related to Our Organization and Structure.”
Founded in 1989, ABRY Partners is a leading media, communications and information services-focused private equity investment firm. ABRY Partners invests in high quality companies and partners with management to help build their businesses. Since its founding, ABRY Partners has completed over $21.0 billion of transactions, including private equity, mezzanine and preferred equity placements, representing investments in approximately 450 businesses. ABRY Partners is headquartered in Boston, Massachusetts.
5
Table of Contents
Corporate Reorganization
We are a newly formed Delaware corporation that has not, to date, conducted any activities other than those incident to our formation and the preparation of this registration statement. We were formed solely for the purpose of reorganizing the organizational structure of CT Technologies Holdings, LLC in order for the registrant to be a corporation rather than a limited liability company. Prior to the effectiveness of this registration statement, each member of CT Technologies Holdings, LLC will contribute all of their equity interests, including all Series A, B and C shares and all senior preferred shares, in CT Technologies Holdings, LLC to us in return for shares of our common stock and senior preferred stock. After each member contributes all of their equity interests in CT Technologies Holdings, LLC to us, CT Technologies Holdings, LLC will become our wholly-owned subsidiary. If any equity interests are not contributed to us prior to effectiveness of this registration statement, CT Technologies Holdings, LLC will be merged with and into us and we will issue shares of our common stock or senior preferred stock, as applicable, in accordance with the terms of the CT Technologies Holdings, LLC Agreement to such non-contributing members, if any, and their equity interests will be cancelled. We refer to these events as our corporate reorganization.
As a result of the corporate reorganization, CT Technologies Holdings, LLC’s Series A and C shares will be exchanged for 15,088,841 shares of our common stock based upon a price of $15.00 per share, the midpoint of the range set forth on the cover of this prospectus. In addition, any outstanding Series B-1 and B-2 shares that have vested on or prior to our corporate reorganization will be exchanged for 1,420,445 shares of our common stock based upon a price of $15.00 per share, the midpoint of the range set forth on the cover page of this prospectus. The number of shares of common stock issued in connection with our corporate reorganization will not be adjusted based on the actual initial public offering price of our common stock. Holders of unvested Series B-1 and B-2 shares will not receive any consideration in connection with the corporate reorganization. Upon completion of this offering, we intend to issue 146,398 shares of restricted stock and stock options to exercise 2,036,200 shares of common stock to our directors and director nominees and certain other officers and key personnel. In addition, shares of CT Technologies Holdings, LLC’s senior preferred shares will be exchanged for shares of our senior preferred stock prior to the effectiveness of this registration statement. The senior preferred stock will have substantially similar preferences, powers, rights, limitations and restrictions as the senior preferred shares. We intend to use a portion of the net proceeds from this offering for the redemption in whole of our senior preferred stock. See “Corporate Reorganization” and “Description of Capital Stock — Senior Preferred Stock.”
For further information regarding the ownership of our common stock by our executive officers and members of our board of directors, see “Certain Relationships and Related Party Transactions” and “Security Ownership of Certain Beneficial Owners.”
6
Table of Contents
Our Corporate Structure
The following chart indicates our corporate structure following our corporate reorganization and the offering contemplated by this prospectus.
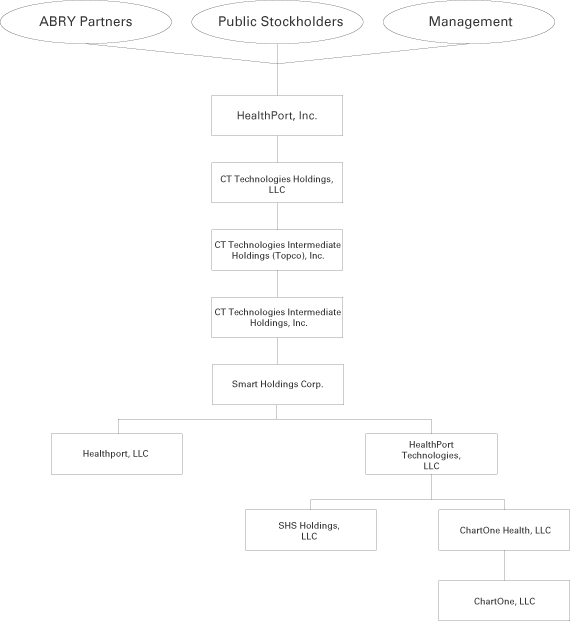
| (1) | Each HealthPort entity in the chart above is a wholly-owned subsidiary of its respective parent. |
7
Table of Contents
Corporate and Other Information
We are a newly formed Delaware corporation that has not, to date, conducted any activities other than those incident to our formation and the preparation of this registration statement. Our principal executive offices are located at 925 North Point Parkway, Suite 350, Alpharetta, Georgia 30005 and our telephone number is (770) 670-2150. Our corporate website address is www.healthport.com. We do not incorporate the information contained on, or accessible through, our corporate website into this prospectus, and you should not consider it part of this prospectus.
8
Table of Contents
The Offering
| Common stock offered by us |
6,000,000 shares. |
| 6,900,000 shares if the underwriters exercise their over- allotment option in full. |
| Total common stock to be outstanding immediately after this offering |
22,509,285 shares. |
| 23,409,285 shares if the underwriters exercise their over-allotment option in full. |
| Preferred stock outstanding |
We intend to use a portion of the net proceeds from this offering for the redemption in whole of our senior preferred stock. See “Description of Capital Stock — Senior Preferred Stock.” |
| Principal stockholders |
Upon completion of this offering, funds affiliated with ABRY Partners, LLC will own a controlling interest in us. We intend to avail ourselves of the controlled company exception under the corporate governance rules of The NASDAQ Stock Market. |
| Use of proceeds |
We estimate that the net proceeds to us from this offering, after deducting underwriting discounts and commissions and estimated offering expenses, will be approximately $79.8 million, assuming the shares are offered at $15.00 per share, the midpoint of the price range set forth on the cover page of this prospectus. We intend to use the net proceeds we receive from this offering to (i) redeem in whole our senior preferred stock, which amounts to approximately $43.5 million, including payment of the early redemption fee and (ii) repay approximately $36.3 million outstanding principal and accrued cash interest under our senior subordinated notes, including payment of an early prepayment fee. If the underwriters exercise their over-allotment option, we intend to use any additional net proceeds to repay a portion of our borrowings under our senior secured credit facility and senior subordinated notes and for general corporate purposes, which we intend to use for the further repayment of borrowings under our senior secured credit facility. See “Use of Proceeds” and “Description of Certain Indebtedness.” |
| Dividend policy |
We have not declared or paid any dividends on our common stock. We cannot pay any dividends on our common stock until we have redeemed and paid in full our senior preferred stock, which we intend to redeem in whole in connection with this offering. Our ability to pay dividends on our common stock is also limited by the covenants of our senior secured credit facility and may be further restricted by the terms of any of our future debt or preferred securities. See “Dividend Policy.” |
9
Table of Contents
| Risk Factors |
Investing in our common stock involves a high degree of risk. See “Risk Factors” beginning on page 15 of this prospectus for a discussion of factors you should carefully consider before deciding to invest in our common stock. |
| Proposed symbol for trading on The NASDAQ Global Market |
“HPRT” |
Unless otherwise indicated, all information in this prospectus:
| • | gives effect to the corporate reorganization; |
| • | excludes 2,182,598 shares of restricted stock and stock options to be granted to our directors and director nominees and certain officers and key employees upon completion of this offering; |
| • | excludes shares of our common stock reserved for future grants under our omnibus incentive plan, which we plan to adopt in connection with this offering; and |
| • | assumes the underwriters will not exercise their over-allotment option. |
10
Table of Contents
SUMMARY CONSOLIDATED FINANCIAL AND OTHER DATA
The following table sets forth our summary consolidated financial and other data for the periods and at the dates indicated. We derived the statements of operations data presented below for the period from January 1, 2006 through December 30, 2006 (Predecessor) and years ended December 31, 2007 and 2008 (Successor) from our audited consolidated financial statements included elsewhere in this prospectus. The unaudited pro forma statement of operations for the year ended December 31, 2008 gives effect to the acquisition of ChartOne as if it occurred at the beginning of such period. The unaudited pro forma statement of operations data was prepared in accordance with Article 11 of Regulation S-X and is more fully presented in our pro forma consolidated financial information section beginning on page F-113 of this prospectus. We derived the statements of operations data and selected balance sheet data for the six months ended June 30, 2008 and 2009 and the historical balance sheet data as of June 30, 2009 from our unaudited consolidated financial statements included elsewhere in this prospectus. We have prepared the unaudited consolidated financial information set forth below on the same basis as our audited consolidated financial statements and have included all adjustments that we consider necessary for a fair presentation of our financial position and operating results for such periods. The interim results set forth below are not necessarily indicative of our future performance and do not reflect results for the year ending December 31, 2009 or for any other period.
On December 30, 2006, ABRY Partners and its co-investors, together with certain members of our board of directors, our executive officers and other members of management, through CT Technologies Holdings, LLC, acquired Companion Technologies Corporation. All periods prior to December 30, 2006 are referred to as Predecessor, and all periods including and after such date are referred to as Successor. There were no material operating results on December 31, 2006 as it fell on a Sunday. The consolidated financial statements for all Successor periods are not comparable to those of the Predecessor periods.
The as adjusted balance sheet data gives effect to the receipt and application of $79.8 million of net proceeds to us from this offering as described in “Use of Proceeds,” as if it had occurred as of June 30, 2009. The as adjusted balance sheet data is not necessarily indicative of what our financial position would have been if this offering had been completed as of the date indicated, nor is such data necessarily indicative of our financial position for any future date or period.
Our historical results are not necessarily indicative of future operating results. You should read the information set forth below in conjunction with “Risk Factors,” “Selected Consolidated Financial Data,” “Management’s Discussion and Analysis of Financial Condition and Results of Operations” and our consolidated financial statements and the related notes included elsewhere in this prospectus.
11
Table of Contents
| (in thousands) | ||||||||||||||||||||||||||
| Predecessor | Successor | |||||||||||||||||||||||||
| Period from January 1, 2006 Through December 30, 2006 |
Year Ended December 31, |
Pro Forma Year Ended December 31, 2008 |
Six Months Ended June 30, |
|||||||||||||||||||||||
| 2007 | 2008 | 2008 | 2009 | |||||||||||||||||||||||
| (unaudited) | (unaudited) | |||||||||||||||||||||||||
| Statement of Operations Data: |
||||||||||||||||||||||||||
| Net revenue |
$ | 38,267 | $ | 102,369 | $ | 188,169 | $ | 242,077 | $ | 83,822 | $ | 126,806 | ||||||||||||||
| Expenses: |
||||||||||||||||||||||||||
| Cost of services and products (exclusive of items shown separately below) |
12,663 | 54,318 | 109,973 | 144,570 | 46,829 | 73,934 | ||||||||||||||||||||
| Bad debt expense (recovery) |
(185 | ) | 3,216 | 9,088 | 10,293 | 4,414 | 5,260 | |||||||||||||||||||
| Selling, general and administrative |
31,744 | 40,287 | 56,575 | 73,575 | 25,679 | 30,789 | ||||||||||||||||||||
| Depreciation and amortization |
676 | 6,099 | 12,183 | 16,569 | 5,726 | 7,274 | ||||||||||||||||||||
| Impairment of goodwill and intangible assets |
— | — | 25,966 | 25,966 | — | — | ||||||||||||||||||||
| Total operating costs and expenses |
44,898 | 103,920 | 213,785 | 270,973 | 82,648 | 117,257 | ||||||||||||||||||||
| Income (loss) from operations |
(6,631 | ) | (1,551 | ) | (25,616 | ) | (28,896 | ) | 1,174 | 9,549 | ||||||||||||||||
| Interest income (expense), net |
60 | (10,333 | ) | (20,906 | ) | (29,746 | ) | (8,781 | ) | (14,956 | ) | |||||||||||||||
| Change in fair value of interest rate swaps |
— | 7 | (1,945 | ) | (1,945 | ) | — | (416 | ) | |||||||||||||||||
| Equity in net gains of affiliates |
1,426 | — | — | — | — | — | ||||||||||||||||||||
| Loss on transfer of investment in affiliate |
(223 | ) | — | — | — | — | — | |||||||||||||||||||
| Loss from continuing operations before income tax benefit |
(5,368 | ) | (11,877 | ) | (48,467 | ) | (60,587 | ) | (7,607 | ) | (5,823 | ) | ||||||||||||||
| Income tax benefit (expense) |
853 | 5,258 | 1,409 | 1,387 | 1,501 | (1,050 | ) | |||||||||||||||||||
| Loss from continuing operations |
(4,515 | ) | (6,619 | ) | (47,058 | ) | (59,200 | ) | (6,106 | ) | (6,873 | ) | ||||||||||||||
| Other Financial Data: |
||||||||||||||||||||||||||
| Adjusted EBITDA(1) |
$ | 1,312 | $ | 6,968 | $ | 18,765 | $ | 28,337 | $ | 9,150 | $ | 19,049 | ||||||||||||||
12
Table of Contents
| Successor | ||||||
| At June 30, 2009 | As Adjusted At June 30, 2009 | |||||
| (unaudited) (in thousands) | ||||||
| Balance Sheet Data: |
||||||
| Cash and cash equivalents |
$ | 637 | $ | 637 | ||
| Total assets |
330,060 | 330,060 | ||||
| Total debt(2) |
245,766 | 174,489 | ||||
| Total equity |
35,787 | 225,997 | ||||
| (1) | We define Adjusted EBITDA as income (loss) from continuing operations before interest expense (income), income tax (expense) benefit, depreciation and amortization, impairment of intangible assets, non-cash equity-based compensation expense, severance expense, integration costs, amortization of capitalized software development (included in our cost of services and products) and other non-recurring and non-cash items. We use Adjusted EBITDA to facilitate a comparison of our operating performance on a consistent basis from period to period that, when viewed in combination with our results under U.S. generally accepted accounting principles, or GAAP, and the following reconciliation, we believe provides a more complete understanding of factors and trends affecting our business than GAAP measures alone. We believe Adjusted EBITDA assists our board of directors, management and investors in comparing our operating performance on a consistent basis because it removes the impact of our capital structure (such as interest expense and acquisition costs), asset base (such as depreciation and amortization) and items outside the control of our management team (such as income taxes), as well as other non-cash (such as purchase accounting adjustments, equity-based compensation expense and impairment of intangible assets) and non-recurring items (such as litigation expenses and acquisition costs), from our operations. Despite the importance of this measure in analyzing our business and evaluating our operating performance, Adjusted EBITDA has limitations as an analytical tool, and you should not consider it in isolation, or as a substitute for analysis of our results as reported under GAAP; nor is Adjusted EBITDA intended to be a measure of liquidity or free cash flow for our discretionary use. Some of the limitations of Adjusted EBITDA are: |
| • | Adjusted EBITDA does not reflect our cash expenditures or future requirements for capital expenditures or contractual commitments; |
| • | Adjusted EBITDA does not reflect changes in, or cash requirements for, our working capital needs; |
| • | Adjusted EBITDA does not reflect the interest expense or the cash requirements to service interest or principal payments under our credit agreement; |
| • | Adjusted EBITDA does not reflect income tax payments we are required to make; and |
| • | although depreciation and amortization are non-cash charges, the assets being depreciated and amortized often will have to be replaced in the future, and Adjusted EBITDA does not reflect any cash requirements for such replacements. |
| To properly and prudently evaluate our business, we encourage you to review the financial statements included elsewhere in this prospectus and not rely on any single financial measure to evaluate our business. We also strongly urge you to review the reconciliation of loss from continuing operations to Adjusted EBITDA. Adjusted EBITDA, as presented in this prospectus, may differ from and may not be comparable to similarly titled measures used by other companies because Adjusted EBITDA is not a measure of financial performance under GAAP and is susceptible to varying calculations. The following table sets forth a reconciliation of loss from continuing operations, a comparable GAAP-based measure, to Adjusted EBITDA. All of the items included in the reconciliation from loss from continuing operations to Adjusted EBITDA are either (i) non-cash items (such as depreciation and amortization, equity-based compensation expense, purchase accounting adjustments and impairment of intangible assets), (ii) items that management does not consider in assessing our on going operating performance (such as income taxes and interest expense) or (iii) non-recurring items. In the case of the non-cash items, management believes that investors can better assess our comparative operating performance because the measures without such items are less susceptible to variances in actual performance resulting from depreciation, amortization and other non-cash charges and more reflective of other factors that affect operating performance. In the case of the other items, management believes that investors can better assess our operating performance if the measures are presented without these items because their financial impact does not reflect ongoing operating performance. |
13
Table of Contents
The following is a reconciliation of loss from continuing operations to Adjusted EBITDA for the periods presented (in thousands):
| Predecessor | Successor | |||||||||||||||||||||||||
| Period From January 1, 2006 Through December 30, 2006 |
December 31, 2007 |
December 31, 2008 |
December 31, 2008 Non-GAAP With Acquisition(a) |
Six Months Ended June 30, |
||||||||||||||||||||||
| 2008 | 2009 | |||||||||||||||||||||||||
| (unaudited) | (unaudited) | |||||||||||||||||||||||||
| Loss from continuing operations |
$ | (4,515 | ) | $ | (6,619 | ) | $ | (47,058 | ) | $ | (59,200 | ) | $ | (6,106 | ) | $ | (6,873 | ) | ||||||||
| Depreciation and amortization |
676 | 6,099 | 12,183 | 16,569 | 5,726 | 7,274 | ||||||||||||||||||||
| Amortization of capitalized software development |
— | 2,000 | 2,375 | 2,375 | 1,055 | 467 | ||||||||||||||||||||
| Impairment of goodwill and intangible assets |
— | — | 25,966 | 25,966 | — | — | ||||||||||||||||||||
| Interest expense, net |
(60 | ) | 10,333 | 20,906 | 29,746 | 8,781 | 14,956 | |||||||||||||||||||
| Change in fair value of interest rate swaps |
— | (7 | ) | 1,945 | 1,945 | — | 416 | |||||||||||||||||||
| Equity in net gains of affiliates |
(1,426 | ) | — | — | — | — | — | |||||||||||||||||||
| Loss on transfer of investment in affiliate |
223 | — | — | — | — | — | ||||||||||||||||||||
| Income tax (benefit) expense |
(853 | ) | (5,258 | ) | (1,409 | ) | (1,387 | ) | (1,501 | ) | 1,050 | |||||||||||||||
| Severance and integration costs(b) |
7,267 | — | 3,314 | 11,780 | 1,195 | 1,390 | ||||||||||||||||||||
| Equity-based compensation expense |
— | 420 | 543 | 543 | — | 369 | ||||||||||||||||||||
| Adjusted EBITDA |
$ | 1,312 | $ | 6,968 | $ | 18,765 | $ | 28,337 | $ | 9,150 | $ | 19,049 | ||||||||||||||
| (a) | The December 31, 2008 Non-GAAP With Acquisition reconciliation begins with loss from continuing operations. Our loss from continuing operations is presented in compliance with Article 11 of Regulation S-X. The Article 11 pro forma detailed calculation is presented on page F-113 of this prospectus. We reconcile loss from continuing operations to Adjusted EBITDA, a non-GAAP financial measure. We believe this non-GAAP financial measure is important to investors because it reflects the operations of a significant acquisition (ChartOne) as if it occurred on January 1, 2008. This non-GAAP financial measure has limitations and should not be considered in isolation, or as a substitute for analysis of our results as reported under GAAP. |
| (b) | In the period from January 1, 2006 through December 30, 2006, there was $7.3 million of integration-related costs associated with the acquisition of Companion from Blue Cross Blue Shield of South Carolina. Included in the $7.3 million is a Blue Cross Blue Shield allocation of $2.8 million as well as $4.5 million of expenses eliminated in conjunction with the acquisition on December 30, 2006. |
| In the twelve months ended December 31, 2008 and December 31, 2008 Non-GAAP With Acquisition, and the six months ended June 30, 2008 and 2009, there were severance and integration costs relating to the integration of ChartOne of $3.3 million, $1.2 million and $1.4 million, respectively. Also included in the December 31, 2008 Non-GAAP With Acquisition period is an adjustment of $8.5 million relating to success bonuses to certain employees for the sale of ChartOne. |
| (2) | Total debt at June 30, 2009 includes long-term obligations, net of current portion, of $197.3 million, current portion of long-term obligations of $11.4 million and senior preferred shares of $37.1 million. Total debt as adjusted at June 30, 2009 includes long-term obligations, net of current portion, of $197.3 million, current portion of long-term obligations of $11.4 million and assumes the repayment in whole of the senior preferred shares and the repayment of $34.2 million of the principal amount of the senior subordinated notes. |
14
Table of Contents
Investing in our common stock involves significant risks. You should carefully consider the risks set forth below, as well as other information contained in this prospectus, before making a decision to invest in our common stock. If any of the following risks actually materialize, then our business, financial condition and results of operations may suffer. In addition, there may be risks of which we are currently unaware or that we currently regard as immaterial based on the information available to us that later prove to be material. These risks may adversely affect our business, financial condition and operating results. As a result, the price of our common stock could decline, and you could lose some or all of your investment. In assessing the risks described below, you should also refer to the other information contained in this prospectus, including our consolidated financial statements and the related notes, before deciding to purchase any shares of our common stock. Certain statements in “Risk Factors” are forward-looking statements. See “Forward-Looking Statements.”
Risks Related to Our Business
If we are unable to retain our existing customers, our business, financial condition and results of operations could suffer.
Our success depends substantially upon the retention of our customers. Although no single customer accounted for more than 1% of our revenue for fiscal year 2008, we may not be able to retain some of our existing customers if we are unable to achieve improved efficiencies and cost-effectiveness in providing our ROI services, effectively comply with a complex array of regulatory requirements, manage expenses associated with our customers’ health information management functions or successfully track and audit health record requests. We also may not be able to retain our customers if we do not fulfill health record requests promptly, fail to code properly or otherwise fail to meet the service standards of our customers or if our software solutions contain errors or otherwise fail to perform properly. Historically, we have benefited from high customer retention rates; however, we may not be able to maintain high customer retention rates in the future. The failure to maintain our existing customers may cause our revenue to decrease and our results from operations could suffer.
Our business may suffer as a result of our limited operating history in light of our recent acquisitions and growth and lack of public company operating experience.
We have grown rapidly in recent years, including through acquisitions, and have a limited operating history at our current scale of operations. We have developed our business over the past several years through acquisitions, including the acquisition of Smart Document Solutions, LLC, which we refer to as SDS, and ChartOne. Our SDS operations have only operated under our management since their acquisition in June 2007. Our ChartOne operations have only operated under our management since their acquisition in September 2008. In addition, we lack public company operating experience. Our limited operating history and lack of public company operating experience make it difficult to evaluate our future prospects. If we are unable to execute our business strategy and grow our business, either as a result of our inability to manage our current size, effectively manage the business in a public company environment or to manage our future growth through our acquisitions or for any other reason, our business, prospects, financial condition and results of operations may be harmed.
Our business will suffer if we fail to successfully integrate acquired businesses and technologies or to appropriately assess the risks in particular transactions.
We have in the past acquired, and may in the future acquire, businesses, technologies, services, product lines and other assets. For example, in September 2008 we acquired our
15
Table of Contents
largest competitor, ChartOne, and integrated its operations with our business. The successful integration of any businesses and assets we acquire into our operations, on a cost-effective basis, may be critical to our future performance. The amount and timing of the expected benefits of any acquisition, including potential synergies between our current business and the acquired business, are subject to significant risks and uncertainties. These risks and uncertainties include, but are not limited to, those relating to:
| • | our ability to maintain relationships with the customers of an acquired business; |
| • | the diversion of our management’s attention, as integrating the operations and assets of the acquired businesses will require a substantial amount of our management’s time; |
| • | our ability to sell services and software to customers with which we have established relationships and those with which the acquired businesses have established relationships; |
| • | the ability to achieve operating and financial synergies anticipated to result from the acquisitions; |
| • | our ability to retain or replace key personnel; |
| • | potential conflicts in customer, vendor or marketing relationships; |
| • | our ability to coordinate organizations that are geographically diverse and may have different business cultures; and |
| • | compliance with regulatory requirements. |
Although our management attempts to evaluate the risks inherent in each transaction and to evaluate acquisition candidates appropriately, we may not properly ascertain all such risks and the acquired businesses and assets may not perform as we expect or enhance the value of our company as a whole. In addition, acquired companies or businesses may have larger-than-expected liabilities that are not covered by the indemnification, if any, that we are able to obtain from the sellers.
We have a history of operating losses and may suffer losses in the future.
We have incurred losses since our operations began on December 31, 2006. In each of the fiscal years ended December 31, 2007 and 2008, we recorded net losses of approximately $7.4 million and $49.8 million, respectively. Our net loss for the six months ended June 30, 2009 was $6.9 million, and we may incur losses in the future.
Our ability to use net operating loss carryforwards could be substantially limited in excess of existing limitations if we experience an ownership change as defined in the Internal Revenue Code.
As of December 31, 2008, our federal net operating loss carryforward was approximately $126 million subject to annual utilization limitations pursuant to Internal Revenue Code Section 382. If not utilized, net operating loss carryforwards will expire between 2012 and 2028. Of the $126.0 million net operating loss carryforwards, approximately $100.0 million are subject to existing Internal Revenue Code Section 382 limitations. If we are unable to fully utilize our net operating losses to offset taxable income generated in the future, our results of operations could be materially and negatively impacted.
Section 382 of the Internal Revenue Code contains rules that limit the ability of a company that undergoes an ownership change, which is generally any change in ownership of more than 50% of its stock over a three-year period, to use its net operating loss carryforwards and certain built-in losses recognized in years after the ownership change. These rules generally operate by focusing on ownership changes among stockholders owning directly or indirectly 5% or more of the stock of a company and any change in ownership arising from a new issuance of stock by the company.
16
Table of Contents
If we undergo an ownership change for purposes of Section 382 as a result of future transactions involving our common stock, including purchases or sales of stock between 5% stockholders, our ability to use our net operating loss carryforwards and to recognize certain built-in losses would be subject to additional limitations of Section 382. Generally, if an ownership change occurs, the yearly taxable income limitation on the use of net operating loss carryforwards and certain built-in losses is equal to the product of the applicable long-term tax exempt rate and the value of the company’s stock immediately before the ownership change. Depending on the resulting limitation, a significant portion of our net operating loss carryforwards could expire before we would be able to use them. Our inability to use our net operating loss carryforwards could have a negative impact on our financial position and results of operations.
We face significant competition for our services and solutions, and the majority of our addressable market, instead of using a third-party provider, performs internally some of the same services that we offer.
The markets for our various services and solutions are intensely competitive, continually evolving and subject to technological change. We face competition from many regional ROI service providers, healthcare information technology and service providers and other technology companies within our ROI services and our software and other services market segments. Many of our potential customers perform ROI services through their own staff and do not use outsourced service providers, which requires us to compete with our potential customers’ in-house staff for business. In February 2009, Congress passed the American Recovery and Reinvestment Act of 2009, or ARRA, which provides $20 billion to encourage the adoption and meaningful use of electronic health records systems. As hospitals, physician clinics and other providers adopt and utilize electronic health records systems, they may be able to perform the ROI functions internally and the need for our services may decrease. If we do not compete successfully for new customers, we will have limited growth and the price of our stock may suffer.
Our prices for the delivery of health records to requestors is typically set by state regulation or statute and is not determined by us.
Our prices for the delivery of health records to requestors are typically established by statute or regulation by the state where the customer is located and are only subject to change by the various state legislatures or regulatory bodies. In addition, the Social Security Administration establishes prices for the delivery of health records that it requests, which are typically below the prices set by the various state legislatures or regulatory bodies. Requestors may seek reimbursement from us if we inadvertently charge a price that exceeds the price established by statute, state regulation or the Social Security Administration. In addition, if these regulated prices are decreased or if any increases in our future costs exceed future increases in the regulated prices, our business would be less profitable and our results of operation would be adversely affected.
If we are not able to increase market penetration of hospitals, health systems and physician clinics who currently conduct the ROI function internally, or offer new and valuable services and solutions, we may not be able to increase sales and our revenue and results of operations may suffer.
We must increase the use of outsourced ROI services by hospitals, health systems and physician clinics who currently use their own personnel to perform the ROI function and we must continue to improve the functionality of our existing services and solutions in a timely manner and introduce new solutions in order to attract new customers and retain existing
17
Table of Contents
customers. We may not be successful in convincing hospitals, health systems and physician clinics to use our outsourced ROI services rather than continuing with their in-house operations. Further, the pace of change in the markets we serve is rapid, and our competitors regularly introduce new products and services. Our failure to increase market utilization of outsourced ROI services or our failure to improve the functionality of our existing services and solutions or introduce new solutions, could result in little or no growth for our business, which could cause our financial results to suffer and result in depressing the price of our common stock after we have completed this offering.
We are dependent on the continued service of key executives, the loss of any of whom could adversely affect our business.
Our performance is substantially dependent on the performance of our senior management team, including Michael Labedz, our President and Chief Executive Officer, and Brian Grazzini, our Chief Financial Officer. We have entered into agreements with each member of our senior management team that restrict their ability to compete with us should they decide to leave our company. Even though we have entered into these agreements, we cannot be sure that any member of our senior management team will remain with us or that they will not compete with us in the future. The loss of any member of our senior management team could impair our ability to execute our business plan and growth strategy, cause us to lose customers and reduce revenue, or lead to employee morale problems and/or the loss of key employees.
Our success depends in part on our ability to identify, recruit and retain skilled management and technical personnel. If we fail to recruit and retain suitable candidates or if our relationship with our employees changes or deteriorates, there could be an adverse affect on our business.
Our future success depends upon our continuing ability to identify, attract, hire and retain highly qualified personnel, including skilled technical, management, service, technology and sales and marketing personnel, all of whom are in high demand and are often subject to competing offers. Competition for qualified personnel in the healthcare information technology and services industry is intense, and we cannot assure you that we will be able to hire or retain a sufficient number of qualified personnel to meet our requirements, or that we will be able to do so at salary, benefit and other compensation costs that are acceptable to us. A loss of a substantial number of qualified employees, or an inability to attract, retain and motivate additional highly skilled employees required for expansion of our business, could have an adverse effect on our business. In addition, while approximately 30 of our employees are currently unionized, additional unionization of our employees is possible in the future. Such unionizing activities could be costly to address and, if successful, would likely adversely impact our operations.
Disruptions in service or damages to our centralized data center, or other software or systems failures, could adversely affect our business.
Our centralized data center is essential to our business. Our operations depend upon our ability to maintain and protect our computer systems, most of which are located in our centralized data center that we operate in Alpharetta, Georgia. We maintain insurance against fires, floods, other natural disasters and general business interruptions to mitigate the adverse effects of a disruption, relocation or change in operating environment at our data center; however, the situations and the amount of insurance coverage may not be adequate in any particular case. The occurrence of any of these events could result in interruptions, delays or cessations in service to our customers, which could impair or prohibit our ability to provide our services and solutions, reduce the attractiveness of our services and solutions to our customers and adversely impact our financial condition and results of operations.
18
Table of Contents
Disruption of our computer systems by break-ins, hackers, improper access, computer viruses or other attacks could result in service interruptions for our customers, which could increase our costs to comply with federal regulations and adversely effect our business.
Despite the implementation of security measures, our technology or systems that we interface with, including the Internet and related systems, may be vulnerable to physical break-ins, hackers, improper employee or contractor access, computer viruses, programming errors, denial-of-service attacks, terrorist attacks or other attacks by third parties or similar disruptive problems. Any of these can cause system failure, including network, software or hardware failure, which can result in service disruptions or increased response time for our services and solutions. In addition, as part of ARRA, Congress amended the healthcare privacy and security provisions of HIPAA. HIPAA imposes limitations on the use and disclosure of an individual’s healthcare information on healthcare providers, healthcare clearinghouses, and health insurance plans, collectively referred to as covered entities. The HIPAA amendments also impose these limitations and the corresponding penalties for non-compliance on individuals and entities that provide services to healthcare providers and other covered entities, collectively referred to as business associates. ARRA also made significant increases in the penalties for improper use or disclosure of an individual’s health information under HIPAA. The amendments also create notification requirements for individuals whose health information has been accessed, which in some cases may include public notice requirements. Notification is not required under HIPAA if the health information accessed is deemed secured in accordance with encryption and other standards to be developed by the U.S. Department of Health and Human Services, or HHS. We are subject to HIPAA as a healthcare clearinghouse and as a business associate. As a result, we may be required to expend significant capital and other resources to protect against security breaches and hackers or to alleviate problems caused by such breaches.
Unsuccessful implementation of our services and solutions with our customers may harm our future financial success.
In connection with the implementation of our services and solutions with new customers, we may encounter unanticipated difficulties and delays as a result of failure by us or by the customer to meet respective implementation responsibilities. If the customer implementation process is not executed successfully or if execution is delayed, our relationships with some of our customers may be adversely impacted and our results of operations will be impacted negatively. In addition, cancellation of any implementation of our services and solutions after it has begun may involve loss to us of time, effort and resources invested in the cancelled implementation as well as lost opportunity for acquiring other customers over that same period of time. The costs and lost future revenue associated with an implementation failure could adversely effect our financial results.
Our business involves the use, transmission and storage of personal health information and the failure to properly safeguard such information could result in significant liability and possible damages.
Our business activities involve the use, transmission and storage of personal health information. ARRA substantially increases penalties for improper use or disclosure of an individual’s health information and makes healthcare clearinghouses and business associates, such as us, as well as our customers, liable for such penalties under HIPAA. ARRA authorizes states’ attorneys general to enforce HIPAA requirements and recover penalties. In addition, ARRA requires a covered entity to notify individuals whose health information has been accessed. If the disclosure or breach involves individuals that cannot be located and the breach involves 10 or more individuals, or if the breach involves the information of more than 500
19
Table of Contents
individuals, public notice is required. If improper disclosure is caused by one of our employees or results from a breach of our computer systems or data center, we could be subject to substantial liability to the government or to the individual whose information has been disclosed. We may also be subject to substantial liability to our customers for penalties they owe to the government and possibly for damages to them for their loss of reputation as a result of negative publicity. Accordingly, security breaches of our computer systems or data center could expose us to a risk of loss or litigation, government enforcement actions and contractual liabilities. Although we have contractual provisions attempting to limit our liability in these areas, we cannot assure you that they will be successful or enforceable, or that other parties will accept such contractual provisions as part of our agreements. Moreover, these contractual provisions would not protect us against enforcement by federal or state governments. Any security breaches also could impact our ability to provide our services and solutions, as well as impact the confidence of our customers in our services and solutions, either of which could have an adverse effect on our business, financial condition and results of operations.
We attempt to limit, by contract, our liability for damages arising from our negligence, errors, mistakes or security breaches. However, contractual limitations on liability may not be enforceable or may otherwise not provide sufficient protection to us from liability for damages, especially in light of new HIPAA provisions. We maintain liability insurance coverage, including coverage for errors and omissions. It is possible, however, that claims could exceed the amount of our applicable insurance coverage, if any, or that this coverage may not continue to be available on acceptable terms or in sufficient amounts. Even if these claims do not result in liability to us, investigating and defending against them could be expensive and time-consuming and could divert management’s attention away from our operations. In addition, negative publicity caused by these events may harm our reputation and our business.
If the protection of our intellectual property is inadequate, our competitors may gain access to our technology or confidential information and we may lose our competitive advantage.
Our success as a company depends in part upon our ability to protect our core technology and intellectual property. To accomplish this, we rely on a combination of intellectual property rights, including trade secrets, copyrights and trademarks, as well as customary contractual protections. We use internal and external measures to protect our proprietary software and confidential information. Such measures include contractual protections with employees, contractors and customers, as well as U.S. copyright laws.
We protect the intellectual property in our software with customary contractual protections in our agreements that impose restrictions on our customers’ ability to use such software, such as prohibiting reverse engineering and limiting the use of copies. We also seek to avoid disclosure of our intellectual property by relying on non-disclosure and intellectual property assignment agreements with our employees and consultants that acknowledge our ownership of all intellectual property developed by the individual during the course of his or her work with us. The agreements also require each person to maintain the confidentiality of all proprietary information disclosed to them. Other parties may not comply with the terms of their agreements with us, and we may not be able to enforce our rights adequately against these parties. The disclosure to, or independent development by, a competitor of any trade secret, know-how or other technology that is competitive with our business could materially adversely affect any competitive advantage we may have over any such competitor.
We cannot assure you that the steps we have taken to protect our intellectual property rights will be adequate to deter misappropriation of our rights or that we will be able to detect unauthorized uses and take timely and effective steps to enforce our rights. If unauthorized uses
20
Table of Contents
of our intellectual property were to occur, we might be required to engage in costly and time-consuming litigation to enforce these rights. We cannot assure you that we would prevail in any such litigation. If others were able to use our intellectual property, our business and financial results could be adversely affected.
Our indebtedness could adversely affect our financial health, harm our ability to react to changes to our business and prevent us from fulfilling our obligations under our indebtedness.
As of June 30, 2009, after giving effect to the completion of this offering and application of our net proceeds therefrom, we would have had total indebtedness of approximately $174.5 million. Based on that level of indebtedness and interest rates applicable at June 30, 2009 our annual interest expense would have been $17.7 million. Although we believe that our current cash flows will be sufficient to cover our annual interest expense, any increase in the amount of our indebtedness or any decline in the amount of cash available to make interest payments could require us to divert funds identified for other purposes for debt service and impair our liquidity position. If we cannot generate sufficient cash flow from operations to service our debt, we may need to refinance our debt, dispose of assets or issue equity to obtain necessary funds. We do not know whether we will be able to take any of such actions on a timely basis or on terms satisfactory to us or at all.
Our indebtedness could limit our ability to:
| • | obtain necessary additional financing for working capital, capital expenditures or other purposes in the future; |
| • | plan for, or react to, changes in our business and the industries in which we operate; |
| • | make future acquisitions or pursue other business opportunities; and |
| • | react in an extended economic downturn. |
Despite our current indebtedness, we may still be able to incur significantly more debt. The incurrence of additional debt could increase the risks associated with our substantial leverage, including our ability to service our indebtedness. In addition, because borrowings under our credit agreement bear interest at a variable rate, our interest expense could increase, exacerbating these risks. For instance, assuming an aggregate principal balance of $132.5 million outstanding under our variable rate borrowings, which was the amount outstanding as of June 30, 2009, giving effect to the application of net proceeds from this offering, a 1% increase in the interest rate we are charged on our debt would increase our annual interest expense by $1.3 million.
Recent events in the credit markets may affect our ability to refinance our existing debt or obtain additional debt financing on acceptable terms.
We may need or seek additional financing in the future to either refinance our existing indebtedness, fund our operations, fund acquisitions or strategic relationships, develop or enhance our technological infrastructure and our existing services and solutions or implement other projects. Our senior secured credit facility matures on September 22, 2013; therefore, we do not have near-term impending maturity on our senior secured credit facility. However, given the state of the current credit environment resulting from, among other things, the general weakening of the global economy, it may be difficult to refinance our existing indebtedness or obtain any such additional financing on acceptable terms, which could have an adverse effect on our financial condition, including our results of operations and/or business plans. In addition, if as a result of the current conditions in the credit markets any of the lenders participating in our revolving credit facility are unable to fund borrowings under such facility, our liquidity could be adversely affected.
21
Table of Contents
The terms of our credit agreement and our note purchase agreement may restrict our current and future operations, which would adversely affect our ability to respond to changes in our business and to manage our operations.
Our credit agreement and our note purchase agreement contain, and any future indebtedness of ours would likely contain, a number of restrictive covenants that impose significant operating and financial restrictions on us, including restrictions on our ability to, among other things:
| • | incur additional debt; |
| • | issue preferred stock; |
| • | create liens; |
| • | create or incur contingent obligations; |
| • | engage in sales of assets and subsidiary stock; |
| • | enter into sale-leaseback transactions; |
| • | make investments and acquisitions; |
| • | enter into hedging arrangements; |
| • | make capital expenditures; |
| • | pay dividends and make other restricted payments; |
| • | enter into transactions with affiliates; and |
| • | transfer all or substantially all of our assets or enter into merger or consolidation transactions. |
Our credit agreement and our note purchase agreement also require us to maintain certain financial ratios, including a maximum total leverage ratio, a senior leverage ratio, a minimum consolidated EBITDA and a minimum fixed charge coverage ratio. A failure by us to comply with the covenants or financial ratios contained in our credit agreement or our note purchase agreement could result in an event of default under our credit agreement or our note purchase agreement which could adversely affect our ability to respond to changes in our business and manage our operations. A change of control of our company is also an event of default under our credit agreement. Under our credit agreement, a change of control of our company will occur if, among other things, any person other than ABRY Partners or us or our subsidiaries acquires, directly or indirectly, more than 35% of the outstanding equity interests of us and at the time of the acquisition ABRY Partners does not collectively hold equity interests of us representing greater voting power in us than such person. Upon the occurrence of an event of default under our credit agreement, the lenders could elect to declare all amounts outstanding to be due and payable, require us to apply all of our available cash to repay these amounts and exercise other remedies as set forth in the credit agreement. If the indebtedness under our credit agreement or our note purchase agreement were to be accelerated, there can be no assurance that our assets would be sufficient to repay this indebtedness in full.
Recent developments in the healthcare industry could adversely affect our business.
National healthcare reform is currently a major focus at the federal level, and congressional leaders are trying to pass legislation in 2009. There are currently numerous federal, state and private initiatives and studies seeking ways to increase the use of information technology in healthcare as a means of improving care and reducing costs. These initiatives may result in additional or costly legal and regulatory requirements that are applicable to us and our
22
Table of Contents
customers, may encourage more companies to enter our markets, may provide advantages to our competitors and may result in the development of services and solutions that compete with ours.
Any such reforms or initiatives, whether private or governmental, may result in financial pressures on our customers or potential customers, which could have an adverse effect on our business. Even so, we believe we enable our customers to reduce internal costs, helping them respond to these and other financial pressures. Financial pressures on healthcare industry constituents could result from, among other things:
| • | government regulation or private initiatives that affect the manner in which providers interact with patients, requestors or other healthcare industry constituents, including changes in pricing or means of delivery of healthcare services; |
| • | reductions in governmental funding for healthcare; and |
| • | adverse changes in business or economic conditions affecting payers or providers or other healthcare industry constituents. |
Even if financial pressures on industry constituents remain the same or decrease, other developments in the healthcare industry may result in reduced spending on information technology and services or in some or all of the specific markets we serve or are planning to serve. In addition, our customers’ expectations regarding pending or potential industry developments may also affect their decision-making with respect to the types of services and solutions we provide.
The healthcare industry has changed significantly in recent years and we expect that significant changes will continue to occur. The timing and impact of developments in the healthcare industry are difficult to predict. We cannot be sure that the markets for our services and solutions will continue to exist at current levels or that we will have adequate technical, financial and marketing resources to react to changes in those markets.
Government regulation creates risks and challenges with respect to our compliance efforts and our business strategies.
The healthcare industry is highly regulated and is subject to changing political, legislative, regulatory and other influences. Many healthcare laws are complex, and their application to specific services and relationships may not be clear. In particular, many existing healthcare laws and regulations, when enacted, did not anticipate the healthcare information services and solutions that we provide, and these laws and regulations may be applied to our services and solutions in ways that we do not anticipate. Federal and state legislatures and agencies periodically consider proposals to reform or revise aspects of the healthcare industry, including rates, or to revise or create additional statutory and regulatory requirements. Such proposals, if implemented, could impact our operations, the use of our services and solutions and our ability to market new services and solutions, or could create unexpected liabilities for us. We are unable to predict what changes to laws or regulations might be made in the future or how those changes could affect our business or the costs of compliance.
We have attempted to structure our operations to comply with legal requirements applicable to us directly and to our customers, but there can be no assurance that our operations will not be challenged or impacted by enforcement initiatives. Any determination by a court or agency that our services and solutions violate, or cause our customers to violate, these laws or regulations could subject us or our customers to civil or criminal penalties. Such a determination could also require us to change or terminate portions of our business, disqualify
23
Table of Contents
us from serving customers who are or do business with government entities, or cause us to refund some or all of our service fees or otherwise compensate our requestors. In addition, failure to satisfy laws or regulations could adversely affect demand for our services and solutions and could force us to expend significant capital, research and development and other resources to address the failure. Even an unsuccessful challenge by regulatory authorities or private whistleblowers could result in loss of business, exposure to adverse publicity and injury to our reputation and could adversely affect our ability to retain and attract customers. Laws and regulations impacting our operations include the following:
| • | HIPAA and Other Privacy and Security Requirements. There are numerous federal and state laws and regulations related to the privacy and security of personal health information. In particular, regulations promulgated pursuant to HIPAA established privacy and security standards that limit the use and disclosure of individually identifiable health information and that require the implementation of administrative, physical and technological safeguards to ensure the confidentiality, integrity and availability of individually identifiable health information in electronic form. Our operations as a healthcare clearinghouse are directly subject to the HIPAA privacy, security and transaction standards. In addition, our customers are directly subject to the standards and are required to enter into written agreements with us, known as business associate agreements, which require us to safeguard individually identifiable health information and restrict how we may use and disclose such information. Further, effective February 17, 2010, ARRA will extend the direct application of certain provisions of the security and privacy standards to us as we function as a business associate of our customers. |
Violations of the HIPAA privacy and security standards may result in civil and criminal penalties, and ARRA has increased the penalties for HIPAA violations and strengthened the enforcement provisions of HIPAA. Recently, enforcement activities have appeared to increase, and ARRA may further increase such enforcement activities. For example, ARRA authorizes state attorneys general to bring civil actions seeking either injunctions or damages in response to violations of HIPAA privacy and security regulations that threaten the privacy of state residents.
If we disclose patient records in our ROI activities to a person not legally authorized to receive them, pursuant to a defective authorization, or if our employees otherwise improperly disclose patient records we may be liable to our customer and the patient for substantial penalties.
ARRA also provides that the HHS must issue regulations later this year requiring covered entities to report certain security breaches to individuals affected by the breach and, in some cases, to HHS or to the public via a website or the media. This reporting obligation will apply broadly to breaches involving unsecured protected health information and will become effective 30 days from the date HHS issues these regulations. Effective February 17, 2010 or later, in the case of restrictions tied to the issuance of implementing regulations, ARRA will impose stricter limitations on certain types of uses and disclosures of individually identifiable health information, such as additional restrictions on marketing communications and the sale of individually identifiable health information.
In addition to the HIPAA privacy and security standards, most states have enacted patient confidentiality laws that protect against the disclosure of confidential medical information, and many states have adopted or are considering further legislation in this area, including privacy safeguards, security standards and data security breach notification requirements. Such state laws and regulations, if more stringent than the HIPAA standards, are not preempted by the federal requirements and may be applicable to us.
24
Table of Contents
Further, some of our customers are subject to a new federal rule requiring financial institutions and creditors, which may include health providers and health plans, to implement identity theft prevention programs to detect, prevent, and mitigate identity theft in connection with customer accounts. We may be required to make changes to our operations to assist our customers in complying with this rule.
| • | HIPAA Transaction and Identifier Standards. HIPAA and its implementing regulations also mandate format, data content and provider identifier standards that must be used in certain electronic transactions, such as claims, payment advice and eligibility inquiries. Although our systems are fully capable of transmitting transactions that comply with these requirements, some payers and healthcare clearinghouses with which we conduct business interpret HIPAA transaction requirements differently than we do or may require us to use legacy formats or include legacy identifiers as they transition to full compliance. Where payers or healthcare clearinghouses require conformity with their interpretations or require us to accommodate legacy transactions or identifiers as a condition of successful transactions, we seek to comply with their requirements, but may be subject to enforcement actions as a result. In January 2009, the Centers for Medicare & Medicaid Services, or CMS, published a final rule adopting updated standard code sets for diagnoses and procedures known as the ICD-10 code sets. The final rule also resulted in changes related to the formats used for electronic transactions subject to the rule. While use of the ICD-10 code sets is not mandatory until October 1, 2013 and the use of the updated formats is not mandatory until January 1, 2012, we have begun to modify our payment systems and processes to prepare for their implementation. We may not be successful in responding to these changes and any responsive changes we make to our transactions and software may result in errors and otherwise negatively impact our service levels. We may also experience complications related to supporting customers that are not fully compliant with the revised requirements as of the applicable compliance date. |
| • | Anti-Kickback and Anti-Bribery Laws. A number of federal and state laws govern patient referrals, financial relationships with physicians and other referral sources and inducements to providers and patients. For example, the federal anti-kickback law prohibits any person or entity from offering, paying, soliciting or receiving, directly or indirectly, anything of value with the intent of generating referrals of patients covered by Medicare, Medicaid or other federal healthcare programs. Many states also have similar anti-kickback laws that are not necessarily limited to items or services for which payment is made by a federal healthcare program. Moreover, both federal and state laws forbid bribery and similar behavior. Any determination by a state or federal regulatory agency that any of our activities or those of our customers or vendors violate any of these laws could subject us to civil or criminal penalties, could require us to change or terminate some portions of our business, could require us to refund a portion of our service fees, could disqualify us from providing services to customers doing business with government programs and could have an adverse effect on our business. Even an unsuccessful challenge by regulatory authorities of our activities could result in adverse publicity and could require a costly response from us. |
| • | False or Fraudulent Claim Laws. There are numerous federal and state laws that prohibit false or fraudulent claims. False or fraudulent claims include, but are not limited to, billing for services not rendered, failing to refund known overpayments, misrepresenting actual services rendered, improper coding and billing for medically unnecessary items or services. The federal False Claims Act, or FCA, and some state false claims laws contain whistleblower provisions that allow private individuals to bring actions on behalf of the government alleging that the defendant has defrauded the |
25
Table of Contents
| government. Whistleblowers, the federal government and some courts have taken the position that entities that allegedly have violated other statutes, such as the federal anti-kickback law, have thereby submitted false claims under the FCA. |
In addition, if we fail to adequately monitor our coders for their accuracy and our customers submit claims based on incorrect codes, we may be responsible for penalties they incur and could be directly liable for penalties as well.
We rely on our customers to provide us with accurate and complete information. Errors and the unintended consequences of data manipulations by us or our systems with respect to entry, formatting, preparation or transmission of claim information may be determined or alleged to be in violation of these laws and regulations or could adversely impact the compliance of our customers.
If we are alleged to have infringed on the rights of others, we could incur unanticipated costs and be prevented from providing our services and solutions.
We could be subject to intellectual property infringement claims as the number of our competitors grows and our software functionality overlaps with competitor offerings. While we do not believe that we have infringed or are infringing on any proprietary rights of third parties, we cannot assure you that infringement claims will not be asserted against us or that those claims will be unsuccessful. Any intellectual property rights claim against us or our customers, with or without merit, could be expensive to litigate, cause us to incur substantial costs and divert management resources and attention in defending the claim. Furthermore, a party making a claim against us could secure a judgment awarding substantial damages, as well as injunctive or other equitable relief that could effectively block our ability to provide products or services. In addition, we cannot assure you that licenses for any intellectual property of third parties that might be required for our products or services will be available on commercially reasonable terms, or at all. As a result, we may also be required to develop alternative non-infringing technology, which could require significant effort and expense.
In addition, a number of our contracts with our customers contain indemnity provisions whereby we indemnify them against certain losses that may arise from third-party claims that are brought in connection with the use of our software.
Our exposure to risks associated with the use of intellectual property may be increased as a result of acquisitions, as we have lower-level visibility into the development process with respect to such technology or the care taken to safeguard against infringement risks. In addition, third parties may make infringement and similar or related claims after we have acquired technology that had not been asserted prior to our acquisition.
A write-off of all or a part of our identifiable intangible assets or goodwill would hurt our operating results and reduce our net worth.
We have significant identifiable intangible assets and goodwill, which represent the excess of the total purchase price of our acquisitions over the estimated fair value of the net assets acquired. As of June 30, 2009, we had $75.7 million of identifiable intangible assets, net of accumulated amortization and $177.8 million of goodwill on our balance sheet, which represented in excess of 76.8% of our total assets. We amortize identifiable intangible assets over their estimated useful lives which range from 1 to 10 years. We also evaluate our goodwill for impairment at least annually using a combination of valuation methodologies. Because one of the valuation methodologies we use is impacted by market conditions, the likelihood and severity of an impairment charge increases during periods of market volatility, such as the one
26
Table of Contents
that recently occurred as a result of the general weakening of the global economy. Because healthcare providers are our primary customers, our future financial forecasts were reduced resulting in a $26.0 million impairment to goodwill and other intangible assets in 2008. If we are unable to retain our existing customers, or if our rates set by state regulation or statute are decreased, we may incur future impairment charges. We are not permitted to amortize goodwill under U.S. accounting standards. In the event an impairment of goodwill is identified, a charge to earnings would be recorded. Although it does not affect our cash flow, a write-off in future periods of all or a part of these assets would adversely affect our operating results and financial condition. See “Management’s Discussion and Analysis of Financial Condition and Results of Operations — Critical Accounting Policies — Goodwill.”
Any significant increase in bad debt in excess of recorded estimates would have a negative impact on our business, financial condition and results of operations.
Our operations may incur unexpected losses from unforeseen exposures to customer credit risk degradation. Provisions for doubtful accounts are primarily estimated based on cash collection analyses and accounts receivable aging reports. In evaluating the adequacy of allowances for doubtful accounts, we assess a number of factors, including historical collection experience, customer concentrations, past due accounts, current economic trends and changes in our customer payment terms. If circumstances related to customers change as a result of the current economic climate or if conditions deteriorate such that our past collection experience is no longer relevant, the amount of accounts receivable that we are able to collect may be less than our previous estimates as we experience bad debt in excess of reserves previously recorded.
Risks Related to our Organization and Structure
We are a holding company and our principal asset after completion of this offering will be our equity interests in our subsidiaries and we are accordingly dependent upon distributions from our subsidiaries to pay dividends, if any, taxes and other expenses.
We are a holding company and, upon completion of the corporate reorganization and this offering, our principal asset will be our ownership of equity interests in our subsidiaries. See “Corporate Reorganization.” We have no independent means of generating revenue. We intend to cause our subsidiaries to make distributions to their equityholders, including us, in an amount sufficient to cover all applicable taxes payable, but are limited in our ability to cause our subsidiaries to make these and other distributions to us including for purposes of paying corporate and other overhead expenses and dividends due to the terms of our credit agreement and senior preferred stock. To the extent that we need funds and our subsidiaries are restricted from making such distributions under applicable law or regulation, as a result of the terms in our credit agreement or our senior preferred stock or are otherwise unable to provide such funds, it could adversely affect our liquidity and financial condition. We intend to use a portion of the net proceeds from this offering for the redemption in whole of our senior preferred stock.
An entity controlled by ABRY Partners will own a substantial portion of our common stock after the completion of this offering and will have a substantial influence in our affairs, which will limit your ability to influence corporate activities and may adversely affect the market price of our common stock.
Upon completion of the offering, ABRY Partners will own or control common stock representing, in the aggregate, a 56% voting interest in us, or 54% if the underwriters exercise in full their option to purchase additional shares. As a result of this ownership, ABRY Partners will have effective control over the outcome of votes on all matters requiring approval by our stockholders, including the election of directors, the adoption of amendments to our certificate of incorporation and by-laws and approval of significant corporate transactions. We currently
27
Table of Contents
expect that, following this offering, three of our seven board members will be principals of ABRY Partners. ABRY Partners can take actions that have the effect of delaying or preventing a change in control of us or discouraging others from making tender offers for our shares, which could prevent stockholders from receiving a premium for their shares. These actions may be taken even if other stockholders oppose them. The concentration of voting power among ABRY Partners may have an adverse effect on the price of our common stock.
We have opted out of section 203 of the General Corporation Law of the State of Delaware, which we refer to as the Delaware General Corporation Law, which prohibits a publicly held Delaware corporation from engaging in a business combination transaction with an interested stockholder for a period of three years after the interested stockholder became such unless the transaction fits within an applicable exemption, such as board approval of the business combination or the transaction which resulted in such stockholder becoming an interested stockholder. Therefore, after the lock-up period expires, ABRY Partners will be able to transfer control of us to a third-party by transferring their common stock, which would not require the approval of our board of directors or our other stockholders.
Our amended and restated certificate of incorporation will provide that the doctrine of corporate opportunity will not apply against ABRY Partners or any of our directors who are employees, of or affiliated with ABRY Partners, in a manner that would prohibit them from investing in competing businesses or doing business with our customers. To the extent they invest in such other businesses, ABRY Partners may have differing interests than our other stockholders.
For additional information regarding the share ownership of, and our relationship with, ABRY Partners, you should read the information under the heading “Certain Relationships and Related Party Transactions.”
We will be a controlled company within the meaning of The NASDAQ Stock Market rules, and, as a result, will rely on exemptions from certain corporate governance requirements that provide protection to stockholders of other companies.
Upon completion of this offering, ABRY Partners will own more than 50% of the total voting power of our common stock and we will be a controlled company under The NASDAQ Stock Market corporate governance standards. As a controlled company, certain exemptions under The NASDAQ Stock Market standards will exempt us from the obligation to comply with certain of the NASDAQ Stock Market corporate governance requirements, including the requirements:
| • | that a majority of our board of directors consist of independent directors, as defined under the rules of The NASDAQ Stock Market; |
| • | that we have a corporate governance and nominating committee that is composed entirely of independent directors with a written charter addressing the committee’s purpose and responsibilities; and |
| • | that we have a compensation committee that is composed entirely of independent directors with a written charter addressing the committee’s purpose and responsibilities. |
Accordingly, for so long as we are a controlled company, you will not have the same protections afforded to stockholders of companies that are subject to all of The NASDAQ Stock Market corporate governance requirements.
The terms of our future preferred stock may negatively affect the value of our common stock.
Immediately following this offering, we will have authorized shares of preferred stock, which may be issued in the future with rights, preferences and privileges as determined
28
Table of Contents
by our board of directors. Preferred stock we may issue in the future will have, priority over our common stock in the event of liquidation or dissolution. In the event of our liquidation or dissolution, our then-outstanding preferred stock, will have priority of payment over all shares of our common stock. Preferred stock also generally has priority on payment of dividends over common stock.
New investors could require that their investment be on terms at least as favorable as the terms of any preferred stock, due to the potential negative effect of priority on a potential investment. In addition, downward pressure on the trading price of our common stock could encourage investors to engage in short sales, which would further contribute to downward pressure on the price of our common stock. The rights, preferences, powers and limitations of any future series of preferred stock as may be established, may have the effect of delaying, deterring or preventing a change of control of our company.
Risks Related to this Offering
Future sales of our common stock, or the perception in the public markets that these sales may occur, could depress our stock price.
Sales of substantial amounts of our common stock in the public market after this offering, or the perception that these sales could occur, could adversely affect the price of our common stock and could impair our ability to raise capital through the sale of additional shares. Upon completion of this offering, we will have 22,509,285 shares of common stock (23,409,285 shares if the underwriters exercise their over-allotment option in full) outstanding. The shares of common stock offered in this offering will be freely tradable without restriction under the Securities Act of 1933, as amended, or the Securities Act, except for any shares of our common stock that may be held or acquired by our directors, executive officers and other affiliates, as that term is defined in the Securities Act, which will be restricted securities under the Securities Act. Restricted securities may not be sold in the public market unless the sale is registered under the Securities Act or an exemption from registration is available.
In connection with this offering, we, our directors and officers, ABRY Partners, funds affiliated with ABRY Partners, and our other stockholders have each agreed to enter into a lock-up agreement and thereby be subject to a lock-up period, meaning that they and their permitted transferees will not be permitted to sell any of the shares of our common stock for 180 days after the date of this prospectus, subject to certain extensions without the prior consent of the underwriters. Although we have been advised that there is no present intention to do so, the underwriters may, in their sole discretion and without notice, release all or any portion of the shares of our common stock from the restrictions in any of the lock-up agreements described above. See “Underwriting.”
Also, in the future, we may issue our securities in connection with investments or acquisitions. The amount of shares of our common stock issued in connection with an investment or acquisition could constitute a material portion of our then-outstanding shares of our common stock.
Requirements associated with being a public company will increase our costs, as well as divert company resources and management attention.
Prior to this offering, we have not been subject to the reporting requirements of the Securities Exchange Act of 1934, or the Exchange Act, or the other rules and regulations of the SEC or any securities exchange relating to public companies. We are working with our legal,
29
Table of Contents
independent accounting and financial advisors to identify those areas in which changes should be made to our financial and management control systems to manage our growth and our obligations as a public company. These areas include corporate governance, corporate control, internal audit, disclosure controls and procedures and financial reporting and accounting systems. We have made, and will continue to make, changes in these and other areas. However, the expenses that will be required in order to adequately prepare for being a public company could be material. Compliance with the various reporting and other requirements applicable to public companies will also require considerable time and attention of management. We cannot predict or estimate the amount of the additional costs we may incur, the timing of such costs or the degree of impact that our management’s attention to these matters will have on our business. In addition, the changes we make may not be sufficient to allow us to satisfy our obligations as a public company on a timely basis.
In addition, being a public company could make it more difficult or more costly for us to obtain certain types of insurance, including directors’ and officers’ liability insurance, and we may be forced to accept reduced policy limits and coverage or incur substantially higher costs to obtain the same or similar coverage. The impact of these events could also make it more difficult for us to attract and retain qualified persons to serve on our board of directors, our board committees or as executive officers.
If securities or industry analysts do not publish research or reports about our business, if they adversely change their recommendations regarding our common stock or if our operating results do not meet their expectations, our stock price could decline.
The trading market for our common stock will be influenced by the research and reports that industry or securities analysts publish about us or our business. If one or more of these analysts cease coverage of our company or fail to publish reports on us regularly, we could lose visibility in the financial markets, which in turn could cause our stock price or trading volume to decline. Moreover, if one or more of the analysts who cover our company downgrades our stock, or if our operating results do not meet their expectations, our stock price could decline.
Our amended and restated certificate of incorporation and by-laws contain provisions that could discourage another company from acquiring us and may prevent attempts by our stockholders to replace or remove our current management.
Our amended and restated certificate of incorporation and by-laws will contain several provisions that may have the effect of delaying, discouraging or preventing a merger or acquisition that our stockholders may consider favorable, including transactions in which stockholders may receive a premium for their shares. In addition, these provisions may frustrate or prevent any attempts by our stockholders to replace or remove our current management by making it more difficult for stockholders to replace or remove our board of directors. See “Description of Capital Stock.”
These provisions of our amended and restated certificate of incorporation and by-laws could discourage potential takeover attempts and reduce the price that investors might be willing to pay for shares of our common stock in the future which could reduce the market price of our common stock. For more information, see “Description of Capital Stock.”
These provisions include:
| • | provisions relating to the number of directors on our board of directors and the appointment of directors upon an increase in the number of directors or vacancy on our board of directors; |
30
Table of Contents
| • | provisions requiring a 66 2/3% stockholder vote for the amendment of certain provisions of our certificate of incorporation, such as provisions relating to the election of directors and the inability of stockholders to act by written consent or call a special meeting, and for the adoption, amendment and repeal of our by-laws; |
| • | authorization of the issuance of blank check preferred stock without the need for action by stockholders; |
| • | prohibiting cumulative voting in the election of directors; |
| • | limiting the persons who may call special meetings of stockholders; and |
| • | advance notice requirements for board nominations and proposing matters to be acted on by stockholders at stockholder meetings. |
Our common stock has not been publicly traded prior to this offering, and we expect that the price of our common stock may fluctuate substantially.
There has not been a public market for our common stock prior to this offering. We cannot predict the extent to which a trading market will develop or how liquid that market may become. If you purchase shares of our common stock in this offering, you will pay a price that was not established in the public trading markets. The initial public offering price was determined by negotiations between the underwriters and us. You may not be able to resell your shares above the initial public offering price and may suffer a loss on your investment.
Broad market and industry factors may adversely affect the market price of our common stock, regardless of our actual operating performance. Factors that could cause fluctuations in our stock price may include, among other things:
| • | actual or anticipated variations in quarterly operating results; |
| • | changes in financial estimates by us or by any securities analysts who may cover our stock or our failure to meet the estimates made by securities analysts; |
| • | changes in regulatory conditions that affect the healthcare markets in which we operate; |
| • | changes in the market valuations of other companies operating in our industry; |
| • | announcements by us or our competitors of significant acquisitions, strategic partnerships or divestitures; |
| • | additions or departures of key personnel; and |
| • | sales of our common stock, including sales of our common stock by our directors and officers or other principal stockholders. |
We currently do not intend to pay dividends on our common stock and, as a result, your only opportunity to achieve a return on your investment is if the price of our common stock appreciates.
We currently do not expect to declare or pay dividends on our common stock in the foreseeable future. Instead, we anticipate that all of our earnings in the foreseeable future will be used to service and redeem our existing indebtedness and in the operation and growth of our business. In addition, we are a holding company, and have no existing operations of our own. Therefore, we would rely on distributions from our subsidiaries to pay dividends to our stockholders. Restrictive covenants under our credit agreement and our senior preferred stock, which we intend to redeem in whole in connection with this offering, limit the ability of our
31
Table of Contents
subsidiaries and, as a result, our ability to declare and pay dividends or other distributions on our common stock. As a result, your only opportunity to achieve a return on your investment in us will be if the market price of our common stock appreciates and you sell your shares at a profit. The market price for our common stock may never exceed, and may fall below, the price that you pay for such common stock.
You will suffer immediate and substantial dilution in the book value of your common stock as a result of this offering.
The initial public offering price of our common stock is considerably more than the adjusted, net tangible book value per share of our outstanding common stock. This reduction in the value of your equity is known as dilution. This dilution occurs in large part because our earlier investors paid substantially less than the initial public offering price when they purchased their shares. Investors purchasing common stock in this offering will incur immediate dilution of $21.14 as adjusted, net tangible book value per share of common stock, based upon an assumed initial public offering price of $15.00 per share, the midpoint of the range set forth on the cover of this prospectus. In addition, if we raise funds by issuing additional securities, the newly issued shares will further dilute your percentage ownership of us.
Failure to establish and maintain effective internal controls over financial reporting could have an adverse effect on our business, operating results and stock price.
Maintaining effective internal control over financial reporting is necessary for us to produce reliable financial reports and is important in helping to prevent financial fraud. To date, we have not identified any material weaknesses related to our internal control over financial reporting or disclosure controls and procedures, although we have not conducted an audit of our controls. If we are unable to maintain adequate internal controls, our business and operating results could be harmed. We are also in the process of evaluating how to document and test our internal control procedures to satisfy the requirements of Section 404 of Sarbanes-Oxley and the related rules of the SEC, which require, among other things, our management to assess annually the effectiveness of our internal control over financial reporting and our independent registered public accounting firm to issue a report on our internal control over financial reporting beginning with our Annual Report on Form 10-K for the year ending December 31, 2010. During the course of this documentation and testing, we may identify deficiencies that we may be unable to remedy before the requisite deadline for those reports. Any failure to remediate material weaknesses noted by us or our independent registered public accounting firm or to implement required new or improved controls or difficulties encountered in their implementation could cause us to fail to meet our reporting obligations or result in material misstatements in our financial statements. If our management or our independent registered public accounting firm were to conclude in their reports that our internal control over financial reporting was not effective, investors could lose confidence in our reported financial information, and the trading price of our common stock could drop significantly. Failure to comply with Section 404 of Sarbanes-Oxley could potentially subject us to sanctions or investigations by the SEC, the Financial Industry Regulatory Authority or other regulatory authorities.
32
Table of Contents
This prospectus contains forward-looking statements that are subject to risks and uncertainties. All statements other than statements of historical fact included in this prospectus are forward-looking statements. Forward-looking statements give our current expectations and projections relating to our financial condition, results of operations, plans, objectives, future performance and business. You can identify forward-looking statements by the fact that they do not relate strictly to historical or current facts. These statements may include words such as “anticipate,” “estimate,” “expect,” “project,” “plan,” “intend,” “believe,” “may,” “should,” “can have,” “likely” and other words and terms of similar meaning in connection with any discussion of the timing or nature of future operating or financial performance or other events.
The forward-looking statements contained in this prospectus are based on assumptions that we have made in light of our industry experience and on our perceptions of historical trends, current conditions, expected future developments and other factors we believe are appropriate under the circumstances. As you read and consider this prospectus, you should understand that these statements are not guarantees of performance or results. They involve risks, uncertainties, some of which are beyond our control, and assumptions. Although we believe that these forward-looking statements are based on reasonable assumptions, you should be aware that many factors could affect our actual financial results and cause them to differ materially from those anticipated in the forward-looking statements. We believe these factors include, but are not limited to, those described under “Risk Factors” and “Management’s Discussion and Analysis of Financial Condition and Results of Operations.” Should one or more of these risks or uncertainties materialize, or should any of these assumptions prove incorrect, our actual results may vary in material respects from those projected in these forward-looking statements.
Any forward-looking statement made by us in this prospectus speaks only as of the date on which we make it. Factors or events that could cause our actual results to differ may emerge from time to time, and it is not possible for us to predict all of them. We undertake no obligation to publicly update any forward-looking statement, whether as a result of new information, future developments or otherwise, except as may be required by law.
33
Table of Contents
We are a newly formed Delaware corporation that has not, to date, conducted any activities other than those incident to our formation and the preparation of this registration statement. We were formed solely for the purpose of reorganizing the organizational structure of CT Technologies Holdings, LLC in order for the registrant to be a corporation rather than a limited liability company.
Prior to the effectiveness of this registration statement, each member of CT Technologies Holdings, LLC will contribute all of their equity interests, including all Series A, B and C shares and all senior preferred shares, in CT Technologies Holdings, LLC to us. CT Technologies Holdings, LLC conducts no operations and holds no assets other than its ownership interest in its subsidiary, which is also a holding company. All of its operations are conducted by its indirect, wholly-owned subsidiaries. In connection with the contribution, we will issue our common stock or senior preferred stock, as the case may be, in exchange for the contributing member’s equity interests in accordance with the terms of the CT Technologies Holdings, LLC Agreement. After each member contributes all of their equity interests in CT Technologies Holdings, LLC to us, CT Technologies Holdings, LLC will become our wholly-owned subsidiary and each contributing member will become our stockholder. If any equity interests are not contributed to us prior to the effectiveness of this registration statement, CT Technologies Holdings, LLC will be merged with and into us and we will issue shares of our common stock in accordance with the terms of the CT Technologies Holdings, LLC Agreement to such non-contributing members, if any, and their equity interests will be cancelled. We refer to these events as our corporate reorganization.
As a result of the corporate reorganization, CT Technologies Holdings, LLC’s Series A and C shares will be exchanged for 15,088,841 shares of our common stock based upon a price of $15.00 per share, the midpoint of the range set forth on the cover of this prospectus. In addition, any outstanding Series B-1 and B-2 shares that have vested on or prior to our corporate reorganization will be exchanged for 1,420,445 shares of our common stock based upon a price of $15.00 per share, the midpoint of the range set forth on the cover of this prospectus. The number of shares of our common stock issued in connection with our corporate reorganization will not be adjusted based on the actual initial public offering price of our common stock. Holders of unvested Series B-1 and B-2 shares will not receive any consideration in connection with the corporate reorganization. In addition, shares of CT Technologies Holdings, LLC’s senior preferred shares will be exchanged for shares of our senior preferred stock prior to the effectiveness of this registration statement. The senior preferred stock will have substantially similar preferences, powers, rights, limitations and restrictions as the senior preferred shares. We intend to use a portion of the net proceeds from this offering for the redemption in whole of our senior preferred stock. In addition, our amended and restated certificate of incorporation will become effective. The corporate reorganization will not affect our operations, which will continue to be conducted through our operating subsidiaries. See “Corporate Reorganization” and “Description of Capital Stock — Senior Preferred Stock.”
In accordance with the CT Technologies Holdings, LLC Agreement, our Series A, B-1, B-2 and C shares are subject to a priority distribution in the event of an initial public offering, which is based upon a price of $15.00 per share, the midpoint of the range set forth on the cover of this prospectus. We will not distribute cash in connection with our corporate reorganization. Prior to the effectiveness of this registration statement, we will exchange our common stock or senior preferred stock, as applicable, for Series A, B and C shares and senior preferred shares in accordance with the following priority:
| • | first, to senior preferred shares, pro rata until the entire amount of the unreturned capital value of all senior preferred shares is paid in full; |
34
Table of Contents
| • | second, to the senior preferred shares, pro rata until the entire amount of the unpaid yield of all senior preferred shares is paid in full; |
| • | third, to the Series A and Series C holders, pro rata to each group up to the entire amount of the unreturned capital value of all outstanding Series A shares; |
| • | fourth, to the Series A and Series C holders, pro rata to each group up to the entire amount of the unpaid yield on all outstanding Series A shares; |
| • | fifth, to the Series A, B-1 and C shares, pro rata to each group until the aggregate distributions given to the holders of Series A shares equals the aggregate capital value of the Series A shares plus 30% per year return on the unreturned capital value for the Series A shares; and |
| • | finally, a pro rata distribution will be made of the remaining shares to the Series A, B-1, B-2, and C shares, pro rata among each. |
In connection with our corporate reorganization, the Series A shares and any vested Series B-1 and B-2 shares held by Messrs. Labedz, Grazzini, Roberts, Webb, Matits and Haynes will be exchanged for 555,178, 15,586, 8,360, 287,876, 0 and 783,550 shares of our common stock, respectively. Unvested Series B-1 and B-2 shares held by Messrs. Labedz and Haynes will vest in connection with this offering in accordance with their incentive share purchase agreements and, in the case of Mr. Webb, pursuant to action by our board of directors. We intend to issue approximately 146,398 shares of restricted stock and stock options to exercise 2,036,200 shares of common stock to our directors and director nominees and certain other officers and key personnel, including 282,200, 252,658, 200,000, 110,400, 108,267 and 262,200 shares, in the aggregate, of restricted stock and stock options to Messrs. Labedz, Grazzini, Roberts, Webb, Matits and Haynes, respectively, upon completion of this offering. In addition, the Series A and C shares held by funds affiliated with ABRY Partners, which may be deemed to be beneficially owned by the members of our board of directors affiliated with ABRY Partners will convert into 12,625,382 shares of our common stock. For further information regarding the ownership of our common stock by our executive officers and members of our board of directors, see “Certain Relationships and Related Party Transactions — Incentive Share Purchase Agreements” and “Security Ownership of Certain Beneficial Owners.”
35
Table of Contents
We estimate that the net proceeds to us from the sale of the shares of common stock offered will be approximately $79.8 million, or approximately $92.4 million if the underwriters’ overallotment option is exercised in full, based upon an assumed initial public offering price of $15.00 per share, the midpoint of the range set forth on the cover page of this prospectus, and after deducting estimated underwriting discounts and commissions and estimated offering expenses payable by us.
A $1.00 increase or decrease in the assumed initial public offering price of $15.00 per share would increase or decrease the net proceeds we receive from this offering by approximately $5.6 million, assuming the number of shares offered by us, as set forth on the cover page of this prospectus, remains the same, or approximately $6.4 million if the underwriters’ overallotment option is exercised in full, and after deducting the estimated underwriting discounts and commissions and estimated offering expenses payable by us.
We intend to use the net proceeds we receive from this offering to (i) redeem in whole our senior preferred stock, which amounts to approximately $43.5 million, including payment of the early redemption fee and (ii) repay approximately $36.3 million outstanding principal and accrued cash interest under our senior subordinated notes, including payment of an early prepayment fee. If the underwriters exercise their over-allotment option, we intend to use any additional net proceeds to repay a portion of our borrowings under our senior secured credit facility and senior subordinated notes and for general corporate purposes, which we intend to use for the further repayment of borrowings under our senior secured credit facility. As of June 30, 2009, we had $132.5 million of borrowings outstanding under our senior secured credit facility, which consists of a revolving credit facility, a term loan and an incremental term loan. Our senior secured credit facility has a maturity date of September 22, 2013. Borrowings under our credit facilities bear interest at variable rates. The interest rate on the outstanding balance under our revolving credit facility as of June 30, 2009 was 8.0%. As of June 30, 2009, the weighted average interest rate under our term loans was 8.7%. In September 2008, we used the borrowings under our senior secured credit facility to repay in full our prior credit facility and to pay a portion of the purchase price to acquire ChartOne. Our senior subordinated notes have a maturity date of March 22, 2014 with an outstanding balance of $76.2 million and an interest rate of 14.0% as of June 30, 2009. In September 2008, we used the proceeds received from our senior subordinated notes as part of the purchase price to acquire ChartOne. Additional terms of our senior secured credit facilities and our senior subordinated notes are described under “Description of Certain Indebtedness.”
Pending use of the net proceeds from this offering described above, we intend to invest the net proceeds in short- and intermediate-term interest-bearing obligations, investment-grade instruments, certificates of deposit or direct or guaranteed obligations of the U.S. government.
By establishing a public market for our common stock, this offering is also intended to facilitate our future access to public markets.
36
Table of Contents
We have not declared or paid cash dividends on our common stock. We do not expect to pay dividends on our common stock for the foreseeable future. Instead, we anticipate that all of our earnings in the foreseeable future will be used to service and repay our existing indebtedness and used in the operation and growth of our business. Any future determination to pay dividends to our common stockholders may only occur after we have redeemed in full our senior preferred stock, which we intend to redeem in whole in connection with this offering, and will be at the discretion of our board of directors and depend upon, among other factors, our results of operations, financial condition, capital requirements and contractual restrictions.
Our senior preferred stock has a non-cash, accruing dividend rate of 14%. Because our debt documents currently prohibit the payment of dividends to any of our equity holders, our senior preferred stock dividends are accruing. The terms of our senior preferred stock require that we pay the holders of such shares all unpaid dividends and their total investment amounts before we can pay any dividends to the holders of our common stock. We intend to use a portion of the net proceeds from this offering for the redemption in whole of our senior preferred stock.
Dividends and loans from, and cash generated by, our subsidiaries will be our principal sources of cash to repay indebtedness, fund operations and pay dividends. Accordingly, our ability to pay dividends to our stockholders will depend on the earnings and distributions of funds from our subsidiaries. See “Risks Related to Our Organization and Structure — We are a holding company and our principal asset after completion of this offering will be our equity interests in our subsidiaries and we are accordingly dependent upon distributions from our subsidiaries to pay dividends, if any, taxes and other expenses.” In addition, restrictive covenants under our senior secured credit facility and our senior subordinated notes limit the ability of our subsidiaries and, as a result, our ability, to declare and pay dividends or other distributions on our senior preferred stock, which we intend to redeem in whole in connection with this offering, or common stock.
37
Table of Contents
The following table sets forth our cash and cash equivalents and our capitalization as of June 30, 2009 on:
| • | an actual basis reflecting the capitalization of CT Technologies Holdings, LLC; and |
| • | on an as adjusted basis to give effect to the following: |
| • | our corporate reorganization as more fully described in “Corporate Reorganization,” at a price of $15.00 per share, the midpoint of the price range set forth on the cover page of this prospectus; |
| • | the sale of 6,000,000 shares of our common stock in this offering by us at an assumed initial public offering price of $15.00 per share, the midpoint of the price range set forth on the cover page of this prospectus, after deducting underwriting discounts and commissions and estimated offering expenses payable by us, and the application of the net proceeds from this offering as described under “Use of Proceeds;” |
| • | the repayment of $34.2 million of our subordinated debt and the repayment in full of our senior preferred stock, related prepayment fees and interest accrued from July 31, 2009 through October 31, 2009, the proposed closing date of this offering; and |
| • | our accumulated deficit has been adjusted for the costs associated with the early extinguishment of a portion of our debt. |
You should read the following table in conjunction with the sections titled “Use of Proceeds,” “Selected Consolidated Financial Data,” “Unaudited Pro Forma Condensed Financial Information,” “Management’s Discussion and Analysis of Financial Condition and Results of Operations” and our financial statements and related notes included elsewhere in this prospectus.
| As of June 30, 2009 | ||||||||
| Actual | As Adjusted(1) | |||||||
| (in thousands, except share data) |
||||||||
| (unaudited) | ||||||||
| Cash and cash equivalents |
$ | 637 | $ | 637 | ||||
| Debt: |
||||||||
| Current portion of long-term debt |
11,375 | 14,503 | ||||||
| Long-term debt, less current portion(2) |
197,319 | 159,986 | ||||||
| Total debt |
208,694 | 174,489 | ||||||
| Senior preferred shares, 30,000 shares authorized and 30,000 shares outstanding as of June 30, 2009 |
37,072 | — | ||||||
| Series C shares, 7,730 shares authorized, issued and outstanding, redemption value of $7,785 as of June 30, 2009 |
7,785 | — | ||||||
| Stockholders’ equity: |
||||||||
| Series A shares, unlimited number authorized, 218,874 shares issued and outstanding as of June 30, 2009 |
129,362 | — | ||||||
| Series B-1 shares, 10,000,000 authorized, 9,897,300 shares issued and outstanding as of June 30, 2009 |
600 | — | ||||||
| Series B-2 shares, 25,000,000 shares authorized, 24,742,700 issued and outstanding as of June 30, 2009 |
733 | — | ||||||
| Common stock, shares authorized and 22,509,285 shares outstanding |
— | 23 | ||||||
| Additional paid-in capital |
4,244 | 327,192 | ||||||
| Accumulated deficit |
(98,177 | ) | (101,218 | ) | ||||
| Treasury stock |
(975 | ) | — | |||||
| Total stockholders’ equity |
35,787 | 225,997 | ||||||
| Total capitalization |
$ | 289,975 | $ | 401,123 | ||||
38
Table of Contents
| (1) | A $1.00 increase or decrease in the assumed initial public offering price of $15.00 per share, the midpoint of the range set forth on the cover page of this prospectus, would increase or decrease the amount of additional paid-in capital, total stockholders’ equity and total capitalization by approximately $22.1 million, assuming the number of shares offered by us, as set forth on the cover page of this prospectus, remains the same and after deducting underwriting discounts and commissions and estimated offering expenses payable by us. |
| (2) | As of June 30, 2009, we had $9.1 million of availability under our revolving credit facility. |
The outstanding share information set forth above is as of June 30, 2009 and excludes:
| • | an aggregate of shares of common stock reserved for issuance under our omnibus incentive plan, which we plan to adopt in connection with this offering; and |
| • | 2,182,598 shares of restricted stock and stock options to be granted to certain officers, directors and certain key employees upon completion of this offering. |
39
Table of Contents
If you invest in our common stock, your interest will be diluted to the extent of the difference between the initial public offering price per share of our common stock in this offering and the pro forma as adjusted net tangible book value per share of common stock upon completion of this offering.
As of June 30, 2009, our pro forma net tangible book value was approximately $(218.8) million, or $(13.25) per share. Our pro forma net tangible book value per share represents our total tangible assets less total liabilities divided by the total number of shares of common stock outstanding on a pro forma basis to reflect the completion of our corporate reorganization. Dilution in net tangible book value per share represents the difference between the amount per share paid by purchasers of common stock in this offering and the pro forma as adjusted net tangible book value per share of common stock immediately after the consummation of this offering.
After giving effect to (i) the exchange of all outstanding and vested Series A, B-1, B-2 and C shares for shares of our common stock, at a price of $15.00 per share, the midpoint of the price range set forth on the cover page of this prospectus, prior to the completion of this offering, (ii) the sale of 6,000,000 shares of our common stock at an assumed initial public offering price of $15.00 per share, the midpoint of the price range set forth on the cover page of this prospectus, and after deducting underwriting discounts and commissions and estimated offering expenses payable by us, and (iii) the repayment in whole of our senior preferred stock and a portion of our subordinated debt, our pro forma as adjusted net tangible book value as of June 30, 2009 would have been approximately $(138.2) million, or $(6.14) per share. This represents an immediate increase in pro forma net tangible book value of $7.11 per share to our existing stockholders and an immediate dilution in net tangible book value of $21.14 per share to new investors purchasing shares of common stock in this offering.
The following table illustrates this dilution on a per share basis:
| Assumed initial public offering price per share of common stock |
$ | 15.00 | |||||
| Pro forma net tangible book value per share as of June 30, 2009 |
(13.25 | ) | |||||
| Increase in pro forma net tangible book value per share attributable to this offering |
7.11 | ||||||
| Pro forma as adjusted net tangible book value per share as of June 30, 2009, as adjusted for this offering |
(6.14 | ) | |||||
| Dilution in net tangible book value per share to new investors(1) |
$ | 21.14 | |||||
| (1) | Dilution is determined by subtracting pro forma as adjusted net tangible book value per share after giving effect to this offering from the initial public offering price paid by a new investor. |
Each $1.00 increase (decrease) in the assumed initial public offering price of $15.00 per share would increase (decrease) our pro forma as adjusted net tangible book value by $5.6 million, or $0.25 per share, and the dilution in net tangible book value per share to investors in this offering by $0.75 per share, assuming that the number of shares offered by us, as set forth on the cover page of this prospectus, remains the same. The as adjusted information is illustrative only, and following the completion of this offering, will be adjusted based on the actual initial public offering price and other terms of this offering determined at pricing.
If the underwriters exercise their over-allotment option in full, the pro forma as adjusted net tangible book value will decrease to approximately $(5.37) per share, representing an increase to existing stockholders of approximately $7.88 per share, and there will be an immediate dilution of approximately $20.37 per share to new investors.
40
Table of Contents
The following table summarizes, as of June 30, 2009, the differences between our existing stockholders and new investors with respect to the number of shares of our common stock sold in this offering, the total consideration paid and the average price per share paid. The calculations, with respect to shares purchased by new investors in this offering, reflect an assumed initial public offering price of $15.00 per share, the midpoint of the range set forth on the cover page of this prospectus, before deducting estimated underwriting discounts and commissions and estimated offering expenses payable by us:
| Shares Purchased | Total Consideration | Average Price Per Share | ||||||||||||
| Number | Percentage | Amount | Percentage | |||||||||||
| (in thousands) | (in thousands) | |||||||||||||
| Existing stockholders |
16,509 | 73 | % | $ | 141,749 | 61 | % | $ | 8.59 | |||||
| New investors |
6,000 | 27 | % | 90,000 | 39 | % | 15.00 | |||||||
| Total |
22,509 | 100 | % | $ | 231,749 | 100 | % | |||||||
The tables and calculations above are based on 22,509,285 shares of common stock issued and outstanding as of June 30, 2009, and excludes:
| • | an aggregate of shares of common stock reserved for issuance under our omnibus incentive plan, which we plan to adopt in connection with this offering; and |
| • | 2,182,598 shares of restricted stock and stock options to be granted to our directors and director nominees and certain officers and key employees upon completion of this offering. |
If the underwriters’ overallotment option is exercised in full, the percentage of shares held by the existing stockholders after this offering would be reduced to 71% of the total number of shares of our common stock, and the number of shares held by new investors would increase to 6,900,000, or 29% of the total number of shares of our common stock outstanding after this offering.
To the extent that any outstanding options are exercised, new investors will experience further dilution.
41
Table of Contents
SELECTED CONSOLIDATED FINANCIAL DATA
The following table sets forth selected consolidated financial and other data for the periods and at the dates indicated. We derived the statements of operations data presented below for the period from January 1, 2006 through December 30, 2006 (Predecessor) and years ended December 31, 2007 and 2008 (Successor) and selected balance sheet data presented below as of December 31, 2007 and 2008 from our audited consolidated financial statements included elsewhere in this prospectus. The selected statements of operations data for the years ended December 31, 2004 and 2005 and the selected balance sheet data as of December 31, 2004, 2005 and 2006 have been derived from audited historical financial statements and related notes not included in this prospectus. We derived the statement of operations data for the six months ended June 30, 2008 and 2009 and the historical balance sheet data as of June 30, 2009 from our unaudited consolidated financial statements included elsewhere in this prospectus. We have prepared the unaudited consolidated financial statements and they include all adjustments necessary for the fair presentation of our financial position and operating results for such periods. The interim results set forth below are not necessarily indicative of our future performance and do not reflect results for the year ending December 31, 2009 or for any other period.
On December 30, 2006, ABRY Partners and its co-investors, together with certain members of our board of directors, our executive officers and other members of management, through CT Technologies Holdings, LLC, acquired Companion. All periods prior to December 30, 2006 are referred to as Predecessor, and all periods including and after such date are referred to as Successor. There were no material operating results on December 31, 2006 as it fell on a Sunday. The consolidated financial statements for all Successor periods are not comparable to those of the Predecessor periods.
42
Table of Contents
Our historical results are not necessarily indicative of future operating results. You should read the information set forth below in conjunction with “Risk Factors,” “Management’s Discussion and Analysis of Financial Condition and Results of Operations” and our consolidated financial statements and the related notes included elsewhere in this prospectus.
| (In Thousands, Except per Share Amounts) | ||||||||||||||||||||||||||||||
| Predecessor | Successor | |||||||||||||||||||||||||||||
| Year Ended December 31, |
Period From January 1, 2006 Through December 30, 2006(1) |
Year Ended December 31, |
Six Months Ended June 30, |
|||||||||||||||||||||||||||
| 2004 | 2005 | 2007 | 2008 | 2008 | 2009 | |||||||||||||||||||||||||
| (unaudited) | ||||||||||||||||||||||||||||||
| Net revenue |
$ | 44,460 | $ | 42,360 | $ | 38,267 | $ | 102,369 | $ | 188,169 | $ | 83,822 | $ | 126,806 | ||||||||||||||||
| Expenses: |
||||||||||||||||||||||||||||||
| Costs of services and products (exclusive of items shown separately below) |
13,353 | 13,586 | 12,663 | 54,318 | 109,973 | 46,829 | 73,934 | |||||||||||||||||||||||
| Bad debt expense (recovery) |
1,914 | 415 | (185 | ) | 3,216 | 9,088 | 4,414 | 5,260 | ||||||||||||||||||||||
| Selling, general, and administrative |
39,526 | 34,600 | 31,744 | 40,287 | 56,575 | 25,679 | 30,789 | |||||||||||||||||||||||
| Depreciation and amortization expense |
1,063 | 721 | 676 | 6,099 | 12,183 | 5,726 | 7,274 | |||||||||||||||||||||||
| Impairment of goodwill and intangible assets |
— | — | — | — | 25,966 | — | — | |||||||||||||||||||||||
| Total operating costs and expenses |
55,856 | 49,322 | 44,898 | 103,920 | 213,785 | 82,648 | 117,257 | |||||||||||||||||||||||
| Income (loss) from operations |
(11,396 | ) | (6,962 | ) | (6,631 | ) | (1,551 | ) | (25,616 | ) | 1,174 | 9,549 | ||||||||||||||||||
| Interest income (expense), net |
220 | 102 | 60 | (10,333 | ) | (20,906 | ) | (8,781 | ) | (14,956 | ) | |||||||||||||||||||
| Change in fair value of interest rate swaps |
— | — | — | 7 | (1,945 | ) | — | (416 | ) | |||||||||||||||||||||
| Equity in net gains of affiliates |
2,032 | 1,615 | 1,426 | — | — | — | — | |||||||||||||||||||||||
| Loss on transfer of investment in affiliate |
— | — | (223 | ) | — | — | — | — | ||||||||||||||||||||||
| Loss from continuing operations before income tax benefit |
(9,144 | ) | (5,245 | ) | (5,368 | ) | (11,877 | ) | (48,467 | ) | (7,607 | ) | (5,823 | ) | ||||||||||||||||
| Income tax benefit (expense) |
2,797 | 1,597 | 853 | 5,258 | 1,409 | 1,501 | (1,050 | ) | ||||||||||||||||||||||
| Loss from continuing operations |
(6,347 | ) | (3,648 | ) | (4,515 | ) | (6,619 | ) | (47,058 | ) | (6,106 | ) | (6,873 | ) | ||||||||||||||||
| Loss from discontinued operations, net of tax |
— | — | — | (732 | ) | (1,426 | ) | (936 | ) | — | ||||||||||||||||||||
| Loss on sale of discontinued operations, net of tax |
— | — | — | — | (1,306 | ) | — | — | ||||||||||||||||||||||
| Net loss |
$ | (6,347 | ) | $ | (3,648 | ) | $ | (4,515 | ) | $ | (7,351 | ) | $ | (49,790 | ) | $ | (7,042 | ) | $ | (6,873 | ) | |||||||||
| Unaudited pro forma net loss per share common stock |
||||||||||||||||||||||||||||||
| Basic and diluted |
$ | (0.74 | ) | $ | (3.72 | ) | $ | (0.57 | ) | $ | (0.42 | ) | ||||||||||||||||||
| Unaudited pro forma weighted average common shares outstanding |
||||||||||||||||||||||||||||||
| Basic and diluted |
9,840 | 13,401 | 12,372 | 16,492 | ||||||||||||||||||||||||||
| (1) | We acquired Companion on December 30, 2006. There were no material operating results on December 31, 2006 as it fell on a Sunday. |
43
Table of Contents
| (in thousands) | |||||||||||||||||||||
| Predecessor | Successor | ||||||||||||||||||||
| December 31, | December 30, 2006(1) |
December 31, | June 30, 2009 | ||||||||||||||||||
| 2004 | 2005 | 2007 | 2008 | ||||||||||||||||||
| (unaudited) | |||||||||||||||||||||
| Consolidated Balance Sheet Data: |
|||||||||||||||||||||
| Working capital |
$ | 987 | $ | (2,046 | ) | $ | 2,906 | $ | 26,143 | $ | 1,906 | $ | 3,457 | ||||||||
| Total assets |
18,286 | 16,180 | 12,731 | 274,259 | 333,750 | 330,060 | |||||||||||||||
| Long-term obligations, net of current portion |
— | — | — | 119,700 | 199,663 | 197,319 | |||||||||||||||
| Senior preferred shares |
— | — | — | 29,007 | 34,196 | 37,072 | |||||||||||||||
| Series C shares |
— | — | — | 3,698 | 2,628 | 7,785 | |||||||||||||||
| Total equity |
9,012 | 5,364 | 5,849 | 65,026 | 47,449 | 35,787 | |||||||||||||||
| (1) | We acquired Companion on December 30, 2006. There were no material operating results on December 31, 2006 as it fell on a Sunday. |
44
Table of Contents
MANAGEMENT’S DISCUSSION AND ANALYSIS OF
FINANCIAL CONDITION AND RESULTS OF OPERATIONS
You should read the following discussion together with “Selected Consolidated Financial Data,” and the historical financial statements and related notes included elsewhere in this prospectus. The statements in this discussion regarding industry outlook, our expectations regarding our future performance, liquidity and capital resources and other non-historical statements in this discussion are forward looking statements. These forward looking statements are subject to numerous risks and uncertainties, including, but not limited to, the risks and uncertainties described in “Risk Factors” and “Forward-Looking Statements.” Our actual results may differ materially from those contained in or implied by any forward looking statements.
Overview
We are a leading provider of healthcare information services and technology solutions to approximately 1,900 hospitals and health systems and 8,000 independent and hospital-affiliated physician clinics. Our primary business is providing outsourced technology-enabled ROI services to our customers. We believe we are the largest provider of ROI services with a market share of approximately 20% and utilize our expertise and technology to fulfill requests for health records in an accurate, regulatory-compliant and timely manner. Our ROI services enable our customers to reduce staffing levels associated with these time-consuming and labor-intensive healthcare information functions, allowing them to increase their focus on patient care, and to more effectively comply with increasingly complex and cumbersome regulatory requirements. We also provide other software and services that complement our ROI services, including recovery audit compliance solutions, revenue cycle management software, healthcare coding and consulting services and physician practice management software.
Management’s primary metrics to measure the consolidated financial performance of the business are net revenue and Adjusted EBITDA. We use these metrics to measure our business given they provide period-over-period comparability and measure the fundamental business elements which our management can impact in the short term.
Our historical revenue has been primarily derived through acquisitions, customer retention and the addition of new customers. We believe our business strategy will continue to offer significant opportunity, but it also presents risks and challenges. These risks and challenges include the risk to our business resulting from the loss of customers to competitors or the decision by existing or potential new customers to perform ROI functions internally. We believe that the increasing complexities of the ROI process, including the regulatory compliance requirements, and infrastructure costs may be prohibitive to our competitors, existing customers and potential new customers, including those customers seeking to perform ROI functions internally. Although management believes our customer retention and acquisition and new sales opportunities remain strong, our revenue growth may suffer if we are unable to successfully retain existing customers, acquire new companies or add new customers. We have a large, experienced sales and operating staff and have successfully retained customers and acquired and integrated businesses in the past. We believe that our business has a number of new contract opportunities that are in various stages of the sales process, a majority of which have traditionally resulted in new contracts. In addition, we expect to continue to invest in the development of new and enhanced products and services, our customer service resources and our infrastructure capabilities. These investments have contributed to the growth of our net revenue and Adjusted EBITDA in recent periods.
45
Table of Contents
Our Corporate History
We have completed a series of acquisitions since our inception. These acquired companies have established histories of providing services and solutions to the healthcare industry. Companion was created as a division of Blue Cross Blue Shield of South Carolina in 1975 and SDS began ROI services in 1976. We acquired Companion in December 2006. We acquired SDS in June 2007. The acquisitions combined SDS’s 30-year history in the ROI industry and Companion’s software applications to offer a more complete set of solutions to the hospital, health system and physician clinic markets. We continued to grow with the September 2008 acquisition of ChartOne, which we believe was the second-largest provider of outsourced ROI services in the United States at that time. The ChartOne acquisition allowed us to further leverage our efficient operating capabilities through increased size and market penetration.
Our Business Segments
We conduct our operations through two business segments: Release-of-Information Services and Software and Other Services. We offer ROI services on an outsourced basis to hospitals, health systems and physician clinics. Our software and other services segment provides solutions that complement our ROI services, including recovery audit compliance solutions, revenue cycle management software, healthcare coding and consulting services and physician practice management software. Our RAC solution allows our customers to prepare for and comply with a new Medicare payment recovery system that is being phased in and is scheduled for nationwide implementation in 2010, helping them trade and organize documentation requests, coding, billing, reviews and all associated paperwork. Our RCM software enables healthcare providers to ensure that payment is properly received for the medical services provided to patients. Our healthcare coding and consulting services include compliance expertise with HIPAA, data management, compliance auditing, education, master patient index classification and medical coding. Our practice management software assists physician practices with administrative tasks such as patient information tracking, appointment scheduling and billing.
Our Revenue and Expenses
Revenue
We generate revenue by providing services and solutions that automate and simplify business and administrative functions for our customers. Our ROI services segment revenue is primarily derived from charging requestors a flat fee plus a per-page fee, in accordance with a fee schedule established by state regulation for the retrieval and delivery of the health record. In addition, we also receive revenue from our customers for the courtesy copies we provide them in accordance with our contracts. In 2008, our average ROI service price for a billable request was approximately $38. Pricing is generally regulated by state law depending on the type of requestor and purpose of request, and varies from state to state.
Our practice management software is sold either on an Application Service Provider, or ASP, basis with revenue generated based on a monthly subscription fee, or on a license basis with an upfront fee plus maintenance fees thereafter. Our RCM software products are sold on an ASP basis with revenue generated on a fee per claim basis. Our healthcare coding and consulting service revenue is generated either on a fee per engagement or on an hourly rate per employee. Our RAC compliance solution revenue is generated on a fee per engagement or on an hourly rate per employee basis if generated from our RAC consulting services, or on a monthly subscription fee basis if generated from our RACPro software.
46
Table of Contents
Operating Expenses
We classify our operating expenses as follows:
Costs of Services and Products. Costs of services and products include both costs relating to the ROI services segment and costs relating to the software and other services segment. ROI services costs consist primarily of expenses related to the services we provide to our customers and costs associated with the operation and maintenance of our networks. Costs for ROI services also include: (i) personnel costs associated with production, network operations, customer support, and other personnel, (ii) postage and supplies, (iii) facilities expenses and (iv) equipment maintenance, which vary less directly with our revenue due to the fixed or semi-fixed nature of these expenses.
Software and other services costs consist primarily of costs related to the delivery and implementation of software solutions and products to our customers. These costs include (i) software and hardware maintenance costs, (ii) ASP hosting costs and (iii) data and telecommunications costs, all of which generally vary with our revenue. Included in our software and other services costs is amortization of capitalized software development.
Selling, General and Administrative Expenses. Selling, general and administrative expenses consist primarily of costs related to personnel including salaries, benefits, incentive compensation and equity-based compensation expense, sales expense, marketing programs, including trade shows, brand messaging, and travel-related expenses. In addition, our selling, general and administrative expenses also include insurance costs, professional fees and other general overhead expenses. We expect that selling, general and administrative expenses will increase as we incur additional expenses related to being a public company.
Depreciation and Amortization Expense. Depreciation expense consists primarily of depreciation of fixed assets. Our amortization expense consists of the amortization of all intangible assets, primarily resulting from acquisitions. Amortization of capitalized software development is included in our costs of services and products.
Key Considerations
Certain significant factors or events must be considered to better understand differences in our results of operations from period to period. We believe that the following items or events have had a material impact on our results of operations for the periods discussed below or may have a material impact on our results of operations in future periods:
Acquisitions
The results of operations of acquired businesses are included in our consolidated results of operations from the date of acquisition. We acquired SDS in June 2007 and, in September 2008, we acquired ChartOne, which we believe was the second-largest provider of outsourced ROI services in the United States at that time. These two acquisitions allowed us to eliminate duplicative expenses and allowed us to further leverage our efficient operating capabilities through increased size and market penetration.
The acquisitions of SDS and ChartOne were each accounted for under the purchase method of accounting. We allocated each of the purchase prices to the tangible and identifiable intangible assets and liabilities. These assets and liabilities were recorded at their respective fair values. The excess of cost over the fair value of the identifiable assets and liabilities was recorded as goodwill. As a result of these transactions, our interest expense and amortization expense have increased.
47
Table of Contents
As a result of our acquisitions, our consolidated financial statements are not directly comparable from period to period.
Discontinued Operations
In August 2008, we sold the operations of Document Management Solutions, or DMS, to a third party. As a result, the operations of DMS are reflected as discontinued operations. The financial statements for all periods presented have been reclassified to reflect discontinued operations. A loss of $2.7 million, net of tax, was recorded in relation to the sale of DMS, of which $1.3 million was included in loss on disposal and $1.4 million was included in discontinued operations.
Corporate Reorganization
We are a newly formed Delaware corporation that has not, to date, conducted any activities other than those incident to our formation and the preparation of this registration statement. We were formed solely for the purpose of reorganizing the organizational structure of CT Technologies Holdings, LLC so that the registrant is a corporation rather than a limited liability company and so that our existing investors will own common stock rather than equity interests in a limited liability company.
Prior to the effectiveness of this registration statement, each member of CT Technologies Holdings, LLC will contribute all of their equity interests, including all Series A, B and C shares and all senior preferred shares, in CT Technologies Holdings, LLC to us. CT Technologies Holdings, LLC conducts no operations and holds no assets other than its ownership interest in its subsidiary, which is also a holding company. All of its operations are conducted by its indirect, wholly-owned subsidiaries.
As a result of the corporate reorganization, CT Technologies Holdings, LLC’s Series A and C shares will be exchanged for 15,088,841 shares of our common stock based upon a price of $15.00 per share, the midpoint of the range set forth on the cover page of this prospectus. In addition, any outstanding Series B-1 and B-2 shares that have vested on or prior to the closing of this offering will be exchanged for 1,420,445 shares of our common stock based upon a price of $15.00 per share, the midpoint of the range set forth on the cover page of this prospectus. The number of shares of our common stock issued in connection with our corporate reorganization will not be adjusted based on the actual initial public offering price of our common stock. Holders of unvested Series B-1 and B-2 shares will not receive any consideration in connection with the corporate reorganization. Upon completion of this offering, we intend to issue 146,398 shares of restricted stock and stock options to exercise 2,036,200 shares of common stock to our directors and director nominees and certain other officers and key personnel. Shares of CT Technologies Holdings, LLC’s senior preferred shares will be exchanged for shares of our senior preferred stock prior to effectiveness of this registration statement. The senior preferred stock will have substantially similar preferences, powers, rights, limitations and restrictions as the senior preferred shares. We intend to use a portion of the net proceeds from this offering for the redemption in whole of our senior preferred stock.
See “Corporate Reorganization” and “Description of Capital Stock — Senior Preferred Stock.”
Critical Accounting Policies
Our discussion and analysis of our consolidated financial condition and results of operations are based upon our consolidated financial statements, which have been prepared in accordance with accounting principles generally accepted in the United States. The preparation of financial statements in conformity with accounting principles generally accepted in the
48
Table of Contents
United States requires management to make estimates and assumptions that affect the reported amounts of assets, liabilities, net revenue, expenses and related disclosures. We base our estimates and assumptions on the best information available to us at the time the estimates and assumptions are made, on historical experience and on various other factors that we believe to be reasonable under the circumstances. We evaluate our estimates and assumptions on a consistent ongoing basis. Our assumptions and methodologies have been applied consistently for all periods presented. Actual results may differ from these estimates under different assumptions or conditions.
Management believes that the following accounting policies include areas that are the most critical to aid in fully understanding and evaluating our reported financial results and require a significant amount of judgment and estimates.
Revenue Recognition
Release of Information Services Segment
Revenue is recognized as release of information services are performed and health records are delivered to customers. Release of information revenue is generally comprised of a base fee and a per-page fee depending on the number of pages made.
In accordance with Staff Accounting Bulletin No. 104, Revenue Recognition SAB 104, we recognize our ROI revenue when (a) there is persuasive evidence of an arrangement, (b) the fee is fixed or determinable, (c) services have been rendered and payment has been contractually earned, and (d) collectability is reasonably assured.
In accordance with Emerging Issues Task Force EITF 00-10, Accounting for Shipping and Handling Fees and Costs, we recognize revenue for shipping and handling costs related to the delivery of records to customers on a gross basis, and the corresponding shipping and handling costs are classified as costs of services and products in the accompanying consolidated statements of operations. Shipping and handling costs included in revenue and costs of services and products were $0.0 million, $3.8 million and $7.9 million for the period from January 1, 2006 through December 30, 2006 and for the years ended December 31, 2007 and 2008, respectively, and $4.4 million and $5.2 million for the six months ended June 30, 2008 and 2009, respectively.
We account for certain contracts using the proportional performance method based upon the pattern of performance of a particular medical record order. The proportional performance method is used only for contracts where project stages are clearly defined and can be invoiced and where the contract contains enforceable rights by both parties. We review contract prices and cost estimates and reflect adjustments in the period when the estimates are revised.
For certain of our release of information customers, cash is due prior to the delivery of the health records to the customer. Recognition of revenue relating to these customers and related direct costs are deferred until payment is received and health records are delivered.
Software and Other Services Segment
We recognize software license revenue in accordance with Statement of Position 97-2, Software Revenue Recognition, or SOP 97-2, as amended by Statement of Position 98-9, Modification of SOP 97-2 Software Revenue Recognition, with Respect to Certain Transactions, or SOP 98-9, when the following criteria are met: (1) persuasive evidence of an arrangement is obtained; (2) delivery of the product has occurred; (3) the license fee is fixed or determinable; and (4) collection is probable. SOP 98-9 requires recognition of revenue using the residual method when (a) there is vendor-specific objective evidence of the fair values of all undelivered
49
Table of Contents
elements in a multiple-element arrangement that is not accounted for using long-term contract accounting; (b) vendor-specific objective evidence of fair value does not exist for one or more of the delivered elements in the arrangement; and (c) all revenue-recognition criteria in SOP 97-2, other than the requirement for vendor-specific objective evidence of the fair value of each delivered element of the arrangement, are satisfied. When software is licensed under a term arrangement, the related fees are recognized as revenue ratably over the contractual term of the agreement.
In accordance with SOP 97-2, when VSOE is able to be established for all elements, license fee revenue is recorded using the relative fair value method. If we are only able to establish VSOE for undelivered elements, we account for license fee revenue using the residual method. Historically for our software license agreements, we have not been able to establish VSOE for delivered and undelivered elements due to wide variation in actual pricing. Since we have not objectively determined the fair value of any undelivered element included in bundled software and service arrangements, including implied maintenance, we account for these arrangements using the combined services approach. Under this approach, the entire arrangement fee is recognized ratably over the period during which the services are expected to be performed or the post contract support, or PCS period, which is typically 12 months, whichever is longer, once the software has been delivered and the provision of both services has commenced, as long as all of the other basic revenue recognition criteria of SOP 97-2 have been met.
PCS is recognized ratably over the period of the PCS arrangements. These are typically twelve month agreements with annual automatic renewals. Subscription fees, including our ASP based solutions, are recognized ratably over the contracted agreement period. Customers have access to the software applications while the data is hosted by either our servers or via third parties. Our customers do not take physical possession of the software application. Implementation fees are typically billed at the beginning of the arrangement and recognized as revenue over the contract period.
We also generate revenue from transactional-based service contracts. Revenue under these arrangements is recognized as transactions are processed and delivered. They are typically transaction price based contracts.
Revenue from fixed-fee consulting services is recognized as services are performed and delivered.
Billings may not coincide with the recognition of revenue. Unbilled accounts receivable occur when revenue recognition precedes billing to the customer, and arise primarily from sales with predetermined billing schedules. Deferred revenue occurs when billing to the customer precedes revenue recognition, and arises primarily from maintenance revenue billed and collected in advance of performance of the maintenance activity and prepayments received from customers for transaction processing to be performed for a specified future period.
Accounting for Income Taxes
We account for income taxes in accordance with Statement of Financial Accounting Standards, or SFAS, No. 109, Accounting for Income Taxes, or SFAS No. 109. Accordingly, our provision for income taxes is determined using the asset and liability method. Under this method, deferred income tax assets and liabilities are calculated based upon the temporary differences between the financial statement and income tax bases of assets and liabilities using the combined federal and state effective tax rates that are applicable to us in a given year. The effect of a change in income tax rates on deferred income tax assets and liabilities is recognized in the income tax provision in the period which includes the enactment date.
50
Table of Contents
The deferred income tax assets are recorded net of a valuation allowance when, based on the weight of available evidence, we believe it is more likely than not that some portion or all of the recorded deferred tax assets will not be realized in future periods. Increases to the valuation allowance are recorded as increases to the provision for income taxes. The realization of the deferred income tax assets, net of a valuation allowance, is primarily dependent on estimated future taxable income. A change in our estimate of future taxable income may require an increase or decrease to the valuation allowance.
Effective January 1, 2009, we adopted Financial Accounting Standards Board Interpretation No. 48, Accounting for Uncertainty in Income Taxes, or FIN 48, which requires a more-likely-than-not threshold for financial statement recognition and measurement of income tax positions taken or expected to be taken in an income tax return. We record a liability for the difference between the income tax benefit recognized and measured pursuant to FIN 48 and the income tax position taken or expected to be taken on our income tax returns. To the extent that our assessment of such income tax positions changes, the change in estimate is recorded in the period in which the determination is made. Prior to 2009, we established contingencies for income taxes when, despite the belief that our income tax positions were fully supportable, we believed that it was probable that our income tax positions would be challenged and possibly disallowed by various authorities. The consolidated income tax provision and related accruals included the impact of such reasonably estimable losses and related interest and penalties as deemed appropriate.
Upon adoption of FIN 48, our policy is to include interest and penalties in our provision for income taxes. Our federal and state income tax returns filed for the tax years 2007 through 2008, the pre-acquisition federal and state income tax returns filed by Companion for tax years 2005 through 2006, the pre-acquisition federal and state income tax returns filed by Smart Holdings Corporation for tax years 2005 through 2007, the pre-acquisition federal and state income tax returns filed by Micro Innovations, Inc. for tax years 2005 through 2006 and the pre-acquisition federal and state income tax returns filed by ChartOne for the tax years 2005 through 2008 generally remain open for examination by the Internal Revenue Service and relevant state taxing jurisdictions.
Acquisitions
In accordance with SFAS No. 141 (revised 2007), Business Combinations, or SFAS 141R, we allocate the purchase price in a business combination to the acquired business’ identifiable assets, liabilities, and non-controlling interests at their acquisition date fair value. The excess of the purchase price over the amount allocated to the identifiable assets, liabilities and non-controlling interests, if any, is recorded as goodwill. Any excess of fair value of the identifiable assets acquired and liabilities assumed over the consideration transferred, if any, is generally recognized within our earnings as of the acquisition date.
We estimate the fair value of the assets, liabilities and non-controlling interests based on one or a combination of income, cost, or market approaches as determined based on the nature of the asset or liability and the level of inputs available to us, including quoted prices in an active market, other observable inputs or unobservable inputs. To the extent that our initial accounting for a business combination is incomplete at the end of a reporting period, we report provisional amounts for those items which are incomplete. We retroactively adjust such provisional amounts as of the acquisition date once we receive new information about facts and circumstances that existed as of the acquisition date and become known for a time period that does not exceed one year from the acquisition date.
51
Table of Contents
Goodwill
In accordance with SFAS No. 142, Goodwill and Other Intangible Assets, or SFAS 142, we review the carrying value of goodwill on an annual basis and whenever events or circumstances make it more likely than not that the fair value of a reporting unit has fallen below its carrying amount. These events could be the result of a significant adverse change in the business climate or a decision to sell or dispose of all or a portion of a reporting unit. With respect to goodwill, we determine whether potential impairments are present by comparing the carrying value of our reporting units to the fair value of our reporting units. If the fair value of the reporting unit is less than the carrying value of the reporting unit, then a hypothetical purchase price allocation is performed to determine the amount, if any, of goodwill impairment.
When testing the goodwill for impairment, we estimate the fair value of our reporting units by considering both the income and market approaches. Specifically, we develop an initial estimate of the fair value of each reporting unit as the present value of the expected future cash flows to be generated by the reporting unit. We then validate this fair value by performing the market comparable approach to estimate the fair value.
Our ROI and Software and Other Services segments are also our reporting units. As of our most recent SFAS 142 Step 1 impairment testing date (October 1, 2008), the fair value of our ROI reporting unit was 10% above the reporting unit carrying value. As of the same date, the fair value of our Software and Other Services reporting unit was less than the reporting unit carrying value and resulted in the impairment of all of the goodwill associated with our Software and Other Services reporting unit. The key assumptions that drive the fair value estimates for our reporting units include the following:
| • | financial projections for the business, including revenue, operating expenses, taxes, and capital expenditures; |
| • | constant growth rate for the business assumed to occur after the discrete projection period; |
| • | discount rate used to calculate the present value of business cash flows; |
| • | comparable companies used in the market approach; and |
| • | valuation multiples selected to be applied to business results/forecasts in the market approach. |
All of the assumptions used to determine fair value are dependent on the future outlook for our business and current market conditions. The financial projections and long-term growth forecasts for the business are dependent on management estimates and sensitive to changes in the overall economic environment as well as trends in the healthcare information technology industry. The selection of comparable companies and appropriate valuation multiples are dependent on comparable company results as well as the prices of publicly traded shares of comparable companies. Unexpected weakness in the overall United States economy, weakness in demand for healthcare information technology services, and/or declines in the share prices of comparable companies could materially impact the assumptions used and negatively impact fair value results.
Each approach requires the use of certain assumptions. The income approach requires management to exercise judgment in making assumptions regarding the reporting unit’s future income stream and cash flow, a discount rate and a constant rate of growth after the discrete forecast period. These assumptions are subject to change based on business and economic
52
Table of Contents
conditions and could materially affect the indicated values of our reporting units. The market approach requires management to exercise judgment in its selection of the guideline companies as well as its selection of the most relevant valuation multiple. Guideline companies selected are comparable to us in terms of product or service offerings, markets, and/or customers, among other characteristics. We considered two valuation multiples — (i) the ratio of market value of invested capital to revenue, or MVIC/Revenue, and (ii) the ratio of market value of invested capital to earnings before interest, taxes, depreciation, and amortization, or MVIC/EBITDA. For example, a 100 basis point increase in our selected discount rate utilized in the income approach combined with a 10% reduction in the fair value determined by the market approach would not have resulted in any additional impairment charge in accordance with SFAS 142.
Our estimates used in these valuations could differ from actual results. If actual results are not consistent with our estimates or assumptions, we may be exposed to an impairment charge that could be material.
Identifiable Definite Life Intangible Assets. The carrying value of other intangibles is evaluated when indicators are present to determine whether such intangibles may be impaired with respect to their recorded values. In accordance with Statement of Financial Accounting Standards No. 144, Accounting for the Impairment or Disposal of Long-Lived Assets, or SFAS No. 144, the carrying values of these identifiable intangible assets are reviewed whenever events or changes in circumstances indicate that the carrying amount of an asset may not be recoverable. If this review indicates that the asset will not be recoverable, as determined based on the undiscounted cash flows of the operating entity or asset over the remaining amortization period, the carrying value of the asset is reduced to its fair value.
Doubtful Accounts
Collection of accounts receivable from customers are our primary source of cash and is therefore critical to our successful operating performance. Accordingly, we closely monitor our cash collection trends and the aging of accounts receivable. Provisions for doubtful accounts are primarily estimated based on cash collection analyses and accounts receivable aging reports. In evaluating the adequacy of allowances for doubtful accounts, we assess a number of factors, including historical collection experience, customer concentrations past due accounts, current economic trends and changes in our customer payment terms. Accounts receivable are written off after collection efforts have been pursued in accordance with our policies and procedures. Inherent in this estimate is the risk that it will need to be revised or updated, with the changes recorded in subsequent periods, as additional information becomes available to management.
Equity-Based Compensation
We have an equity-based compensation plan, see note 1, Summary of Significant Accounting Policies and note 11, Members’ Equity, to the notes to consolidated financial statements included elsewhere in this prospectus for a complete discussion of our equity-based compensation programs.
These equity-based awards are accounted for under the provisions of Statement of Financial Accounting Standards No. 123 (revised 2004), Share-Based Payment, or SFAS No. 123R, requiring the measurement and recognition of all equity-based compensation under the fair value method. The Series B-1 and B-2 Shares vested over five or six years and were subject to continuing employment with us for those shares issued to employees. All unvested Series B Shares issued to employees are forfeited upon termination of employment. If a sale of
53
Table of Contents
the company as defined in the respective recipient’s incentive share purchase agreement occurs, all Series B Shares will become vested so long as the holder of the Series B shares is still employed by us. As a result of our corporate reorganization, all of our vested outstanding Series B shares will be converted into shares of our common stock prior to completion of this offering. We will issue 1,420,445 shares of our common stock to holders of our Series B shares. There will be no additional compensation expense associated with the exchange of our vested outstanding Series B shares for common stock. However, as a result of a modification to accelerate vesting for certain employees upon completion of this offering, we will recognize additional compensation expense.
The grant date fair value of the Series B shares issued to employees is recorded as equity-based compensation in salaries and benefits expense on the consolidated statements of operations on a straight-line basis over the requisite service period which is deemed to be the vesting period for the shares.
For the years ended December 31, 2007 and 2008, we recorded $0.4 million and $0.5 million, respectively, of employee and non-employee equity-based compensation. For the six months ended June 30, 2008 and 2009, we recorded a credit of $5,000 and a charge of $0.4 million, respectively, of employee and non-employee equity-based compensation. As of June 30, 2009, we expected to recognize future expense for non-vested equity-based compensation of $3.1 million over a weighted-average period of 3.5 years.
We applied the option pricing methodology, or OPM, to reflect the seniority of the different classes of securities set forth in the CT Technologies Holdings, LLC Agreement. Consistent with the standard application of the OPM, we modeled each class of security, including Series B-1 and B-2 shares, as a series of call options. The breakpoints associated with the call options are a function of the seniority and liquidation preferences of the various classes of shares. The key assumptions for this approach include time to liquidity event, expected volatility, risk free rate, total enterprise and debt value.
Upon a liquidity event, a distribution will be made to the Series B-1 shares only after (i) the entire amount of the unreturned capital value and the unpaid yield of all senior preferred shares are paid in full; and (ii) all outstanding Series A shares have received the entire amount of the unreturned capital value and unpaid yield. Series B-2 shares will begin participating in the proceeds only after the Series A shares have achieved 30% per year return on the unreturned capital value for the Series A shares.
The alternative approaches for equity valuation include the current-value method and the probability-weighted expected return method, or PWERM. We believe the current-value method underestimates the fair value of the Series B-1 and B-2 shares. While we believe the OPM is a more appropriate approach, we do not believe using PWERM will result in a materially different conclusion for the Series B-1 and B-2 shares.
The OPM assumptions utilized for our valuation analysis for the years ended December 31, 2007 and 2008 and the six months ended June 30, 2008 and 2009 are as follows:
| Year Ended December 31, |
Six Months Ended June 30, |
|||||||||||
| 2007 | 2008 | 2008 | 2009 | |||||||||
| Risk free interest rate |
3.10 | % | 0.67 | % | 2.44 | % | 0.35 | % | ||||
| Dividend yield |
0.0 | % | 0.0 | % | 0.0 | % | 0.0 | % | ||||
| Volatility |
33.0 | % | 42.0 | % | 34.0 | % | 50.0 | % | ||||
| Expected Term (in years) |
1.75 | 1.75 | 1.25 | 0.50 | ||||||||
The dividend yield of zero is based on the fact that we have no present intention to pay cash dividends. Volatility is based on the historical volatility of guideline publicly traded companies
54
Table of Contents
over the period commensurate with the expected time to liquidity horizon. The risk-free interest rate is derived from the average U.S. Treasury CMT rate during the period, which approximates the rate in effect as of the respective valuation dates.
Given the absence of an active market for our shares, our board of directors estimated the fair value of our shares for purposes of determining equity-based compensation expense for the periods presented. Through June 2009, our board of directors determined the estimated fair value of our shares, based in part on an analysis of relevant metrics, including the following:
| • | the level of operational risk and uncertainty surrounding our stand-alone cost structure; |
| • | the range of market multiples of comparable companies; |
| • | our financial position, historical operating results and expected growth in operations; |
| • | the fact that the incentive share grants involve illiquid securities in a private company; and |
| • | the likelihood of achieving a liquidity event, such as an initial public offering or sale of our company given prevailing market conditions. |
Our valuation of our Series B-1 and B-2, which are compensatory shares, as of December 31, 2007, December 31, 2008 and June 30, 2009 was $0.44, $0.19 and $0.95 for the Series B-1 shares, respectively, and $0.27, $0.11 and $0.69 for the Series B-2 shares, respectively. These valuations were prepared using the market and income approaches to estimate the aggregate enterprise value.
The market approach indicates the fair value of a business based on a comparison of the subject company to comparable firms in similar lines of business that are publicly traded or which are part of a public or private transaction, as well as prior subject company transactions. Each comparable company was selected based on various factors, including, but not limited to, industry similarity, financial risk, company size, geographic diversification, profitability, adequate financial data and an actively traded stock price.
The income approach is a valuation technique that provides an estimation of the fair value of a business based on the cash flows that a business can be expected to generate over its remaining life. This approach begins with an estimation of the annual cash flows an investor would expect the subject business to generate over a discrete projection period. The estimated cash flows for each of the years in the discrete projection periods are then converted to their present value equivalent using a rate of return appropriate for the risk of achieving the business’ projected cash flows. The present value of the estimated cash flows are then added to the present value equivalent of the residual value of the business at the end of the discrete projection period to arrive at an estimate of the fair value of the business enterprise.
We prepared a financial forecast for each valuation to be used in the computation of the enterprise value for both the market approach and the income approach. The financial forecasts took into account past experience and future expectations. There is inherent uncertainty in these estimates.
We also considered the fact that our shareholders cannot presently transfer shares in the public markets or otherwise, except for limited transfers among family members. The estimated fair value of our shares at each grant date reflected a marketability discount partially based on the anticipated likelihood and timing of a future liquidity event. The marketability discount assumed decreases as the likelihood and proximity of a future liquidity event increases. In the determination of fair value of
55
Table of Contents
the shares, the marketability discount used was 25% for December 2007, 25% for December 2008 and 10% for June 2009. We then allocated the fair value of our company between our common stock and senior preferred stock using option pricing methodology.
The issuance of Series B-1 shares during December 31, 2007 and December 31, 2008 had a weighted average fair value of $0.44 and $0.28, respectively and the issuance of Series B-2 shares during December 31, 2007 and December 31, 2008 had a weighted average fair value of $0.28 and $0.17, respectively. There were no shares issued in the six month period ended June 30, 2009. The principal reasons for the significant fluctuations in the estimated weighted fair values of our shares from each of the periods were as follows:
| • | changes in the market values of comparable publicly traded companies, which generally trended slightly downward during calendar year 2008 before subsequently moving rapidly upward during the first half of calendar year 2009; |
| • | EBITDA growth attributable to the integration of recent acquisitions and the realization of certain operational synergies related to those integrations; |
| • | increased acceptance of our products and services in the market, driven in part by a national focus on healthcare costs and healthcare technology issues; |
| • | a decrease in the discount rate used to calculate the present value of cash flows in the income approach during the first half of calendar year 2009, driven by market factors and the company’s performance relative to expected results; and |
| • | fluctuations in the marketability discount used to capture the effect of the illiquidity of the equity shares on fair value, as driven by the expected timing and probability of a future liquidity event. |
Our valuation of the Series B-1 and B-2 shares as of December 31, 2008 was $0.19 and $0.11, respectively, compared to a valuation of $0.95 and $0.69 of our Series B-1 and B-2 at June 30, 2009, respectively. An assumed initial public offering price of $15.00 per share, the midpoint of the range set forth on the cover page of this prospectus, and the terms of the CT Technologies Holdings, LLC Agreement, equates to $1.35 and $0.60 for each Series B-1 share and Series B-2 share, respectively.
The increase in value of the Series B-1 and B-2 shares from December 31, 2008 to June 30, 2009 was impacted by increases in our overall valuation. We determined the favorable movement in our fair value over the period to be appropriate after consideration of improvement in market and economic conditions, improving capital markets, a shorter likely time horizon for a liquidity event, and an implied lower required return for an investor in a business similar to ours. The specific factors we considered are discussed in more detail below:
| • | Market Conditions—After declining during the first quarter, the equity markets made a strong recovery during the second quarter of 2009. From December 31, 2008 to June 30, 2009, the NASDAQ composite index grew by approximately 16% and the S&P 500 index increased by approximately 2%. Access to capital markets also improved substantially over this period as a meaningful increase in mergers and acquisitions, initial public offerings, and debt issuance activity was observed. |
| • | Comparable Company Valuations—Comparable companies in the healthcare information technology sector outperformed the overall market over the first half of 2009, which is consistent with an improving outlook for the industry overall. The average comparable company share price growth was 37.2%, with a median growth of 31.9%. |
56
Table of Contents
| • | Economic Outlook—The overall economic outlook in the United States significantly improved from December 2008 to June 2009. The decline in real United States gross domestic product was estimated to have slowed substantially during the second quarter of 2009, helped in part by increased government spending and an improving consumer outlook. The healthcare industry was one of few industries to register job gains during the early part of the year. |
| • | Liquidity Event Time Horizon—Based on improving capital market conditions, we shortened our estimate of the likely time horizon for a liquidity event, which resulted in a reduction in the marketability discount assumed from 25% in December 2008 to 10% in June 2009. |
| • | Investor Required Return—The stabilization of economic and market conditions over the first half of 2009, coupled with increasing equity values in the healthcare information technology sector, suggested lower market returns required by investors for companies similar to ours. |
The increase in the value of the Series B-1 shares at June 30, 2009 of $0.95 to the value of the Series B-1 shares of $1.35 based on an assumed initial public offering price of $15.00 per share, the midpoint of the range set forth on the cover page of this prospectus, and the terms of the CT Technologies Holdings, LLC Agreement was primarily impacted by the assumed cancellation of unvested Series B-1 shares in connection with this offering partially offset by the dilutive effect of additional yield earned by the Series A shares from July 1, 2009 through October 31, 2009, the assumed closing date of this offering. The decrease in the value of the Series B-2 shares at June 30, 2009 of $0.69 to the value of the Series B-2 shares of $0.60 based on an assumed initial public offering price of $15.00 per share, the midpoint of the range set forth on the cover page of this prospectus, and the terms of the CT Technologies Holdings, LLC Agreement was primarily impacted by the dilutive effect on the Series B-2 shares of additional yield earned by the Series A shares from July 1, 2009 assuming a closing date of October 31, 2009.
The following table shows the equity-based compensation activity for the periods indicated, including weighted-average grant date fair value per share and weighted-average grant date fair value of the shares for financial reporting purposes:
| Date of Grant |
Series B-1 Number of Shares Granted |
Weighted- Average Grant Date Fair Value per Series B-1 Share($) |
Weighted- Average Grant Date Fair Value of Series B-1 Shares($)(1) |
Series B-2 Number of Shares Granted |
Weighted- Average Grant Date Fair Value per Series B-2 Share($) |
Weighted- Average Grant Date Fair Value of Series B-2 Shares($)(1) | ||||||||||
| March 31, 2008 |
1,788,000 | $ | 0.44 | $ | 786,720 | 4,462,000 | $ | 0.28 | $ | 1,249,360 | ||||||
| June 30, 2008 |
— | — | — | — | — | — | ||||||||||
| September 30, 2008 |
— | — | — | — | — | — | ||||||||||
| December 31, 2008 |
3,212,000 | 0.19 | 610,280 | 8,038,000 | 0.11 | 884,180 | ||||||||||
| March 31, 2009 |
— | — | — | — | — | — | ||||||||||
| June 30, 2009 |
— | — | — | — | — | — | ||||||||||
| Total |
5,000,000 | $ | 0.28 | $ | 1,397,000 | 12,500,000 | $ | 0.17 | $ | 2,133,540 | ||||||
| (1) | Intrinsic value is the same as the grant date fair value because there is not an exercise price. |
We believe that we have used reasonable methodologies, approaches and assumptions consistent with the American Institute of Certified Public Accountants Practice Guide, “Valuation of Privately-Held-Company Equity Securities Issued as Compensation,” to determine the fair value of our shares. If we had made different assumptions and estimates than those described above, the amount of our recognized and to be recognized equity-based compensation expense and net income (loss) amounts could have been materially different.
57
Table of Contents
Results of Operations
The following table summarizes our consolidated results of operations from selected items in our financial statements for the periods indicated (in thousands):
| Predecessor | Successor | |||||||||||||||||||||
| Period From January 1, 2006 Through December 30, 2006 |
Year Ended December 31, |
Six Months Ended June 30, |
||||||||||||||||||||
| 2007 | 2008 | 2008 | 2009 | |||||||||||||||||||
| (unaudited) | ||||||||||||||||||||||
| Net revenue |
$ | 38,267 | $ | 102,369 | $ | 188,169 | $ | 83,822 | $ | 126,806 | ||||||||||||
| Expenses: |
||||||||||||||||||||||
| Costs of services and products (exclusive of items shown separately below) |
12,663 | 54,318 | 109,973 | 46,829 | 73,934 | |||||||||||||||||
| Bad debt expense (recovery) |
(185 | ) | 3,216 | 9,088 | 4,414 | 5,260 | ||||||||||||||||
| Selling, general and administrative |
31,744 | 40,287 | 56,575 | 25,679 | 30,789 | |||||||||||||||||
| Depreciation and amortization expense |
676 | 6,099 | 12,183 | 5,726 | 7,274 | |||||||||||||||||
| Impairment of goodwill and intangible assets |
— | — | 25,966 | — | — | |||||||||||||||||
| Total operating costs and expenses |
44,898 | 103,920 | 213,785 | 82,648 | 117,257 | |||||||||||||||||
| Income (loss) from operations |
(6,631 | ) | (1,551 | ) | (25,616 | ) | 1,174 | 9,549 | ||||||||||||||
| Interest income (expense), net |
60 | (10,333 | ) | (20,906 | ) | (8,781 | ) | (14,956 | ) | |||||||||||||
| Change in fair value of interest rate swaps |
— | 7 | (1,945 | ) | — | (416 | ) | |||||||||||||||
| Equity in net gains of affiliates |
1,426 | — | — | — | — | |||||||||||||||||
| Loss on transfer of investment in affiliate |
(223 | ) | — | — | — | — | ||||||||||||||||
| Loss from continuing operations before income tax benefit |
(5,368 | ) | (11,877 | ) | (48,467 | ) | (7,607 | ) | (5,823 | ) | ||||||||||||
| Income tax benefit (expense) |
853 | 5,258 | 1,409 | 1,501 | (1,050 | ) | ||||||||||||||||
| Loss from continuing operations |
(4,515 | ) | (6,619 | ) | (47,058 | ) | (6,106 | ) | (6,873 | ) | ||||||||||||
| Loss from discontinued operations, net of tax |
— | (732 | ) | (1,426 | ) | (936 | ) | — | ||||||||||||||
| Loss on sale of discontinued operations, net of tax |
— | — | (1,306 | ) | — | — | ||||||||||||||||
| Net loss |
$ | (4,515 | ) | $ | (7,351 | ) | $ | (49,790 | ) | $ | (7,042 | ) | $ | (6,873 | ) | |||||||
| Adjusted EBITDA |
$ | 1,312 | $ | 6,968 | $ | 18,765 | $ | 9,150 | $ | 19,049 | ||||||||||||
58
Table of Contents
The following table summarizes our consolidated results of operations as a percentage of revenue from selected items in our financial statements for the periods indicated, (in thousands):
| Predecessor | Successor | ||||||||||||||||
| Period From January 1, 2006 Through December 30, 2006 |
Year Ended December 31, |
Six Months Ended June 30, |
|||||||||||||||
| 2007 | 2008 | 2008 | 2009 | ||||||||||||||
| (unaudited) | |||||||||||||||||
| Net revenue |
100.0 | % | 100.0 | % | 100.0 | % | 100.0 | % | 100.0 | % | |||||||
| Expenses: |
|||||||||||||||||
| Costs of services and products (exclusive of items shown separately below) |
33.1 | 53.1 | 58.4 | 55.9 | 58.3 | ||||||||||||
| Bad debt expense (recovery) |
(0.5 | ) | 3.1 | 4.8 | 5.3 | 4.1 | |||||||||||
| Selling, general and administrative |
83.0 | 39.4 | 30.1 | 30.6 | 24.3 | ||||||||||||
| Depreciation and amortization expense |
1.8 | 6.0 | 6.5 | 6.8 | 5.7 | ||||||||||||
| Impairment of goodwill and intangible assets |
— | — | 13.8 | — | — | ||||||||||||
| Total operating costs and expenses |
117.4 | 101.6 | 113.6 | 98.6 | 92.4 | ||||||||||||
| Income (loss) from operations |
(17.4 | ) | (1.6 | ) | (13.6 | ) | 1.4 | 7.6 | |||||||||
| Interest income (expense), net |
0.2 | (10.1 | ) | (11.1 | ) | (10.5 | ) | (11.8 | ) | ||||||||
| Change in fair value of interest rate swaps |
— | — | (1.0 | ) | — | (0.3 | ) | ||||||||||
| Equity in net gains of affiliates |
3.7 | — | — | — | — | ||||||||||||
| Loss on transfer of investment in affiliate |
(0.6 | ) | — | — | — | — | |||||||||||
| Loss from continuing operations before income tax benefit |
(14.1 | ) | (11.7 | ) | (25.7 | ) | (9.1 | ) | (4.5 | ) | |||||||
| Income tax benefit (expense) |
2.2 | 5.1 | 0.7 | 1.8 | (0.8 | ) | |||||||||||
| Loss from continuing operations |
(11.9 | ) | (6.6 | ) | (25.0 | ) | (7.3 | ) | (5.3 | ) | |||||||
| Loss from discontinued operations, net of tax |
— | (0.7 | ) | (0.8 | ) | (1.1 | ) | — | |||||||||
| Loss on sale of discontinued operations, net of tax |
— | — | (0.7 | ) | — | — | |||||||||||
| Net loss |
(11.9 | )% | (7.3 | )% | (26.5 | )% | (8.4 | )% | (5.3 | )% | |||||||
| Adjusted EBITDA |
3.4 | % | 6.8 | % | 10.0 | % | 10.9 | % | 15.0 | % | |||||||
Use of Non-GAAP Financial Measures
A non-GAAP financial measure is generally defined as one that purports to measure historical or future financial performance, financial position or cash flows, but excludes or includes amounts that would not be so adjusted in the most comparable GAAP measure. In this prospectus, we define and use Adjusted EBITDA, a non-GAAP measure, as set forth below.
We define Adjusted EBITDA as income (loss) from continuing operations before interest expense (income), income tax (expense) benefit, depreciation and amortization, impairment of intangible assets, non-cash equity-based compensation expense, severance expense, integration costs, amortization of capitalized software development included in our cost of services and products, and other non-recurring and non-cash items.
59
Table of Contents
We use Adjusted EBITDA to facilitate a comparison of our operating performance on a consistent basis from period to period that, when viewed in combination with our results under GAAP and the following reconciliation, we believe provides a more complete understanding of factors and trends affecting our business than GAAP measures alone. We believe Adjusted EBITDA assists our board of directors, management and investors in comparing our operating performance on a consistent basis because they remove the impact of our capital structure, such as interest expense and amortization of debt issuance costs, asset base, such as depreciation and amortization, items outside the control of our management team, such as income taxes, as well as other non-cash items, such as impairment of intangibles, purchase accounting adjustments, equity-based compensation expense and impairment of intangible assets, and non-recurring items, such as litigation expenses and acquisition costs, from our operations.
Despite the importance of this measure in analyzing our compensation and evaluating our operating performance, Adjusted EBITDA has limitations as an analytical tool, and it should not be considered in isolation, or as a substitute for analysis of our results as reported under GAAP. Adjusted EBITDA is not intended to be a measure of liquidity or free cash flow for our discretionary use.
Some of the limitations of Adjusted EBITDA are:
| • | Adjusted EBITDA does not reflect our cash expenditures or future requirements for capital expenditures or contractual commitments; |
| • | Adjusted EBITDA does not reflect changes in, or cash requirements for, our working capital needs; |
| • | Adjusted EBITDA does not reflect the interest expense or the cash requirements to service interest or principal payments under our credit agreements; |
| • | Adjusted EBITDA does not reflect income tax payments we are required to make; and |
| • | although depreciation and amortization are non-cash charges, the assets being depreciated and amortized often will have to be replaced in the future, and Adjusted EBITDA does not reflect any cash requirements for such replacements. |
To properly and prudently evaluate our business, you should review the financial statements included elsewhere in this prospectus and not rely on any single financial measure to evaluate our business. You should also review the reconciliation of loss from continuing operations to Adjusted EBITDA. Adjusted EBITDA, as presented in this prospectus, which may differ from and may not be comparable to similarly titled measures used by other companies because Adjusted EBITDA is not a measure of financial performance under GAAP and is susceptible to varying calculations. The following table sets forth a reconciliation of Adjusted EBITDA to loss from continuing operations, a comparable GAAP based measure. All of the items included in the reconciliation from loss from continuing operations to Adjusted EBITDA are either (i) non-cash items, such as depreciation and amortization, equity-based compensation expense, purchase accounting adjustments and impairment of intangible assets, (ii) items that management does not consider in assessing our on-going operating performance, such as income taxes and interest expense, or (iii) non-recurring items. In the case of the non-cash items, our management believes that investors can better assess our comparative operating performance because the measures without such items are less susceptible to variances in actual performance resulting from depreciation, amortization and other non-cash charges and more reflective of other factors that affect operating performance. In the case of the other items, our management believes that investors can better assess our operating performance if the measures are presented without these items because their financial impact does not reflect ongoing operating performance.
60
Table of Contents
The following is a reconciliation of loss from continuing operations to Adjusted EBITDA for the periods presented (in thousands):
| Predecessor | Successor | |||||||||||||||||||||
| Period From January 1, 2006 Through December 30, 2006 |
December 31, 2007 |
December 31, 2008 |
Six Months Ended June 30, |
|||||||||||||||||||
| 2008 | 2009 | |||||||||||||||||||||
| (unaudited) | ||||||||||||||||||||||
| Loss from continuing operations |
$ | (4,515 | ) | $ | (6,619 | ) | $ | (47,058 | ) | $ | (6,106 | ) | $ | (6,873 | ) | |||||||
| Depreciation and amortization |
676 | 6,099 | 12,183 | 5,726 | 7,274 | |||||||||||||||||
| Amortization of capitalized software development |
— | 2,000 | 2,375 | 1,055 | 467 | |||||||||||||||||
| Impairment of goodwill and intangible assets |
— | — | 25,966 | — | — | |||||||||||||||||
| Interest expense, net |
(60 | ) | 10,333 | 20,906 | 8,781 | 14,956 | ||||||||||||||||
| Change in fair value of interest rate swaps |
— | (7 | ) | 1,945 | — | 416 | ||||||||||||||||
| Equity in net gains of affiliates |
(1,426 | ) | — | — | — | — | ||||||||||||||||
| Loss on transfer of investment in affiliate |
223 | — | — | — | — | |||||||||||||||||
| Income tax (benefit) expense |
(853 | ) | (5,258 | ) | (1,409 | ) | (1,501 | ) | 1,050 | |||||||||||||
| Severance and integration costs(a) |
7,267 | — | 3,314 | 1,195 | 1,390 | |||||||||||||||||
| Equity-based compensation expense |
— | 420 | 543 | — | 369 | |||||||||||||||||
| Adjusted EBITDA |
$ | 1,312 | $ | 6,968 | $ | 18,765 | $ | 9,150 | $ | 19,049 | ||||||||||||
|
|
||||||||||||||||||||||
| (a) | In the period from January 1, 2006 through December 30, 2006, there was $7.3 million of integration-related costs associated with the acquisition of Companion from Blue Cross Blue Shield of South Carolina. Included in the $7.3 million is a Blue Cross Blue Shield allocation of $2.8 million as well as $4.5 million of expenses eliminated in connection with the acquisition on December 30, 2006. |
| In the twelve months ended December 31, 2008 and the six months ended June 30, 2008 and 2009, there were severance and integration costs relating to the integration of ChartOne of $3.3 million, $1.2 million and $1.4 million, respectively. |
Six Months Ended June 30, 2009 Compared to Six Months Ended June 30, 2008
Revenue
Our total revenue was $126.8 million for the six months ended June 30, 2009 compared to $83.8 million for the six months ended June 30, 2008, an increase of $43.0 million, or 51.3%. ROI services revenue was $107.9 million for the six months ended June 30, 2009 compared to $63.9 million for the six months ended June 30, 2008, an increase of $44.0 million, or 68.9%. The increase in ROI services revenue was primarily attributable to a $38.9 million increase in revenue from the acquisition of ChartOne in September 2008, as well as a $5.1 million increase from organic ROI revenue growth.
Software and other services revenue was $19.0 million for the six months ended June 30, 2009 compared to $20.0 million for the six months ended June 30, 2008, a decrease of $1.0 million, or 5.0%, due primarily to a decrease in new software sales.
Costs of Services and Products
Our costs of services and products were $73.9 million for the six months ended June 30, 2009 compared to $46.8 million for the six months ended June 30, 2008, an increase of $27.1 million, or 57.9%. As a percentage of revenue, our total costs of services and products increased to 58.3% for the six months ended June 30, 2009 compared to 55.9% for the six months ended June 30, 2008. The increase in costs of services and products was primarily attributable to the ROI services segment.
61
Table of Contents
Our costs for our ROI services segment were $65.1 million for the six months ended June 30, 2009 compared to $38.0 million for the six months ended June 30, 2008, an increase of $27.1 million, or 71.3%. As a percentage of ROI revenue, our ROI services costs increased to 60.4% for the six months ended June 30, 2009 compared to 59.4% for the six months ended June 30, 2008. The increase in ROI services costs was primarily attributable to the acquisition of ChartOne, which had a higher operating expense base, as well as severance and other related costs of $0.7 million associated with the integration of ChartOne in the first six months of 2009.
Our costs for our software and other services segment were $8.8 million for the six months ended June 30, 2009 compared to $8.9 million for the six months ended June 30, 2008, a decrease of $0.1 million, or 1.1%. During the six months ended June 30, 2009 and 2008, software and other services segment costs included amortization of capitalized software development of $0.5 million and $1.1 million, respectively. As a percentage of software and other services revenue, our software and other services costs increased to 46.6% for the six months ended June 30, 2009 compared to 44.5% for the six months ended June 30, 2008. The increase in costs as a percentage of revenue was attributable to a decrease in software and other services revenue while our costs generally remained unchanged.
Bad Debt Expense
Our total bad debt expense was $5.3 million for the six months ended June 30, 2009 compared to $4.4 million for the six months ended June 30, 2008, an increase of approximately $0.9 million. The increase in total dollars of bad debt expense was primarily attributable to the increase in revenue from the acquisition of ChartOne. As a percentage of total revenue, bad debt decreased to 4.1% for the first six months ended June 30, 2009 as compared to 5.3% for the first six months ended June 30, 2008.
Selling, General and Administrative Expense
Our total selling, general and administrative expense was $30.8 million for the six months ended June 30, 2009 compared to $25.7 million for the six months ended June 30, 2008, an increase of $5.1 million, or 19.8%. This increase was primarily attributable to additional operating expenses relating to the acquisition of ChartOne, as well as expenses associated with the integration of ChartOne. During the six months ended June 30, 2008 and June 30, 2009, severance and other integration costs were $1.2 million and $0.7 million, respectively. In addition, we incurred $0.4 million of equity-based compensation expense for the six months ended June 2009. These expenses were partially offset through the elimination of costs within our software and other services segment. As a percentage of revenue, selling, general and administrative expense decreased to 24.3% for the six months ended June 30, 2009 compared to 30.6% for the six months ended June 30, 2008, primarily attributable to operating efficiencies and synergies achieved through the ChartOne acquisition.
Depreciation and Amortization Expense
Our depreciation and amortization expense was $7.3 million for the six months ended June 30, 2009 compared to $5.7 million for the six months ended June 30, 2008, an increase of $1.6 million, or 28.1%. This increase was primarily attributable to an increase in depreciation and amortization expense associated with the acquisition of ChartOne. During the six months ended June 30, 2008 and 2009, we included amortization of capitalized software development of $0.5 million and $1.1 million, respectively, in our software and other services costs.
62
Table of Contents
Interest Expense, Net of Interest Income
Our interest expense was $15.0 million for the six months ended June 30, 2009 compared to $8.8 million for the six months ended June 30, 2008, an increase of approximately $6.2 million, or 70.5%. The increase in interest expense was due to the new debt incurred in connection with the acquisition of ChartOne in September 2008.
Income Taxes
Our income tax expense was $1.1 million for the six months ended June 30, 2009 compared to an income tax benefit of $1.5 million for the six months ended June 30, 2008, which resulted in an effective income tax rate of approximately 18% and 20%, respectively. For the period ended June 30, 2009, the income tax expense is solely related to the change in the deferred income tax liability related to indefinite lived intangible assets during the period, which is not a component of the net deferred income tax asset being offset by a valuation allowance at June 30, 2009. The change in the deferred income tax liability related to indefinite lived intangible assets is attributable to amortization claimed for income tax purposes, but not for financial accounting purposes during the period. For the period ended June 30, 2008, the differences between the federal statutory rate and the effective income tax rate were caused by adjustments related to state income taxes, non-deductible interest expense and non-deductible equity compensation.
The variability in the effective income tax rate between the six months ended June 30, 2009 and the six months ended June 30, 2008 was primarily driven by subsequent changes in the valuation allowance recorded against the net deferred income tax assets, excluding the deferred income tax liability recorded related to indefinite lived intangible assets, in connection with the 2008 acquisition of ChartOne. On a prospective basis, our management believes that the effective income tax rate will not be consistent as the ratio of the period income tax expense recorded from the change in the deferred income tax liability related to indefinite lived intangible assets to the period pre-tax financial accounting income (loss) fluctuates. Our management expects that this condition should recur as long as we maintain the conclusion that a full valuation allowance is necessary to be recorded against the net deferred income tax asset, which will exclude the deferred income tax liability related to indefinite lived intangible assets. In a period in which we conclude that no valuation allowance would be necessary, the remaining valuation allowance will be released through the income statement as an income tax benefit, causing a distortion in the effective income tax rate. Our management expects that the effective income tax rate for all periods beginning after the period in which the valuation allowance is released should be consistent with the statutory United States federal income tax rate as compared with the effective income tax rates for the recent financial reporting periods.
As of June 30 2009, we do not believe that the gross recorded unrecognized tax benefits will materially change within the next twelve months. See note 13 in the consolidated financial statements contained elsewhere in this prospectus for additional information about our income taxes.
Adjusted EBITDA
Our Adjusted EBITDA was $19.0 million for the six months ended June 30, 2009 compared to $9.2 million for the six months ended June 30, 2008, an increase of $9.8 million or 106.5%. As a percentage of revenue, Adjusted EBITDA increased to 15.0% for the six months ended
63
Table of Contents
June 30, 2009 compared to 10.9% for the six months ended June 30, 2008. This increase was due to the acquisition of ChartOne, continued growth within our ROI services segment and enhanced operating efficiencies relating to the integration of ChartOne. See “Use of Non-GAAP Financial Measures” on page 58.
Year Ended December 31, 2008 Compared to Year Ended December 31, 2007
Revenue
Our total revenue was $188.2 million for 2008 compared to $102.4 million in 2007, an increase of $85.8 million, or 83.8%. This increase was primarily attributable to the ROI services segment. ROI services revenue was $149.8 million in 2008 compared to $64.7 million in 2007, an increase of $85.1 million, or 131.5%. The increase in ROI services revenue was primarily attributable to a $59.2 million increase in revenue from the acquisition of SDS in June 2007, a $21.2 million increase in revenue from the acquisition of ChartOne in September 2008 and a $4.7 million increase from organic ROI revenue growth.
Software and other services revenue was $38.3 million in 2008 compared to $37.7 million in 2007, an increase of $0.6 million, or 1.6%. The increase in software and other services revenue was primarily attributable to a $2.1 million increase in revenue relating to an increase in healthcare coding and consulting revenue from the acquisition of SDS in June 2007, which was partially offset by a decrease of $1.5 million in new software sales.
Costs of Services and Products
Our costs of services and products were $110.0 million in 2008 compared to $54.3 million in 2007, an increase of $55.7 million, or 102.6%. As a percentage of revenue, our total costs of services and products increased to 58.4% of revenue in 2008 compared to 53.1% of revenue in 2007. The increase in costs was primarily attributable to the ROI services segment.
Our costs for the ROI services segment were $91.3 million in 2008 compared to $38.6 million in 2007, an increase of $52.7 million, or 136.5%. As a percentage of ROI revenue, our ROI services segment costs increased to 60.9% in 2008 compared to 59.7% in 2007. The increase in ROI services costs, in total dollar amount and as a percentage of revenue, was primarily attributable to costs associated with the acquisitions of SDS in June 2007 and ChartOne in September 2008, as well as $1.1 million of severance and other costs relating to the integration of ChartOne.
Our costs for our software and other services segment were $18.7 million in 2008 compared to $15.7 million in 2007, an increase of $3.0 million, or 19.1%. In 2008 and 2007, we include amortization of capitalized software development of approximately $2.4 million and $2.0 million, respectively, in software and other services segment costs. As a percentage of software and other services revenue, our software and other services costs increased to 48.8% in 2008 compared to 41.6% in 2007. The increase in software and other services costs, in total dollar amount and as a percentage of revenue, was primarily attributable to costs associated with the acquisition of SDS in June 2007.
Bad Debt Expense
Our total bad debt expense was $9.1 in 2008 compared to $3.2 million in 2007, an increase of $5.9 million. The increase in total dollars was primarily attributable to a higher revenue base as a result of the acquisitions of SDS and ChartOne.
64
Table of Contents
Selling, General and Administrative Expense
Our total selling, general and administrative expense was $56.6 million in 2008 compared to $40.3 million in 2007, an increase of $16.3 million, or 40.4%. This increase was primarily attributable to expenses relating to the acquisition of SDS in June 2007. In addition, we incurred $2.2 million of severance and other expenses relating to the integration of ChartOne, as well as $0.5 million of equity-based compensation expense in 2008 compared to $0.4 million of equity-based compensation expense in 2007. As a percentage of revenue, selling, general and administrative expense decreased to 30.1% in 2008 compared to 39.4% in 2007 primarily attributable to operating efficiencies and synergies achieved through the acquisitions of SDS and ChartOne.
Depreciation and Amortization Expense
Our depreciation and amortization expense was $12.2 million in 2008 compared to $6.1 million in 2007, an increase of $6.1 million, or 100.0%. This increase was primarily attributable to increased depreciation and amortization relating to the acquisitions of SDS and ChartOne. In 2008 and 2007, we include amortization of capitalized software development costs of $2.4 million and $2.0 million, respectively, in software and other services costs.
Interest Expense, Net of Interest Income
Our interest expense was $20.9 million in 2008 compared to $10.3 million in 2007, an increase of $10.6 million, or 102.9%. This increase was primarily attributable to the increase of debt associated with the acquisition of SDS in June 2007 and the acquisition of ChartOne in September 2008.
Income Taxes
Our income tax benefit was $1.4 million in 2008 compared to $5.3 million in 2007, which resulted in an effective income tax rate of 2.9% and 44.3%, respectively. In 2008, the differences between the federal statutory rate and the effective income tax rate were caused by adjustments related to non-deductible interest expense, non-deductible goodwill impairment expense, prior year reconciliation adjustments, state income taxes and the change in the valuation allowance during the year, which was not established in connection with the ChartOne acquisition. In 2007, the differences between the federal statutory rate and the effective income tax rate were caused by adjustments related to non-deductible equity compensation, state income taxes and prior year reconciliation adjustments. See note 13 in the consolidated financial statements for the years ended December 31, 2008 and December 31, 2007 contained elsewhere in this prospectus for additional information about our income taxes.
The variability in the effective income tax rate between 2008 and 2007 was primarily driven by subsequent changes in the valuation allowance recorded against the net deferred income tax assets, excluding the deferred income tax liability recorded related to indefinite lived intangible assets, in connection with the 2008 acquisition of ChartOne and the impact of the goodwill impairment charge recorded during 2008. On a prospective basis, our management believes that the effective income tax rate will not be consistent as the ratio of the period income tax expense recorded from the change in the deferred income tax liability related to indefinite lived intangible assets to the period pre-tax financial accounting income (loss) fluctuates. Our management expects that this condition should recur as long as we maintain the conclusion that a full valuation allowance is necessary to be recorded against the net deferred income tax asset, which will exclude the deferred income tax liability related to indefinite lived intangible
65
Table of Contents
assets. In a period in which we conclude that no valuation allowance would be necessary, the remaining valuation allowance will be released through the income statement as an income tax benefit, causing a distortion in the effective income tax rate. Our management expects that the effective income tax rate for all periods beginning after the period in which the valuation allowance is released should be consistent with the statutory United States federal income tax rate as compared with the effective income tax rates for the recent financial reporting periods.
Adjusted EBITDA
Our Adjusted EBITDA was $18.8 million in 2008 compared to $7.0 million in 2007, an increase of $11.8 million, or 168.6%. As a percentage of revenue, our Adjusted EBITDA increased to 10.0% for 2008 compared to 6.8% in 2007. These increases were due to the acquisitions of SDS and ChartOne and enhanced operating efficiencies due to the integration of ChartOne. See “Use of Non-GAAP Financial Measures” on page 58.
Year Ended December 31, 2007 Compared to Period from January 1, 2006 through December 30, 2006
The comparison below includes operating results of Companion from January 1, 2006 up to the date of acquisition, December 30, 2006. There were no material operating results on December 31, 2006 as it fell on a Sunday.
Revenue
Our total revenue was $102.4 million in 2007 compared to $38.3 million for the period from January 1, 2006 to December 30, 2006, or the 2006 period, an increase of $64.1 million, or 167.4%. ROI services segment revenue was $64.7 million in 2007. We did not provide ROI services in 2006.
Software and other services segment revenue was $37.7 million in 2007 compared to $38.3 million in the 2006 period, a decrease of $0.6 million, or 1.6%. The decrease in software and other services revenue was primarily attributable to a $4.5 million decrease in revenue from new software sales, which was partially offset by an increase of $3.9 million in revenue from our healthcare coding and consulting revenue business and other software sales relating to the acquisition of SDS in June 2007.
Costs of Services and Products
Our costs of services and products were $54.3 million in 2007 compared to $12.7 million in the 2006 period, an increase of $41.6 million or 327.6%. As a percentage of revenue, our total costs of services and products increased to 53.1% of revenue in 2007 compared to 33.1% of revenue in the 2006 period.
Our costs for the ROI services segment were $38.6 million in 2007. As a percentage of revenue, our ROI services segment costs were 59.7% in 2007. We did not provide ROI services in the 2006 period. We began to provide ROI services in June 2007 as a result of the acquisition of SDS.
Our costs for our software and other services segment were $15.7 million in 2007 compared to $12.7 million in the 2006 period, an increase of $3.0 million, or 23.6%. In 2007, we included amortization of capitalized software development of $2.0 million in software and other services costs. As a percentage of software and other services revenue, our software and other costs increased to 41.6% in 2007 compared to 33.1% in the 2006 period. The increase in software and other services costs, in total dollar amount and as a percentage of ROI revenue, was primarily attributable to solutions included in the SDS acquisition in June 2007.
66
Table of Contents
Bad Debt Expense
Our total bad debt expense was $3.2 million in 2007 compared to a credit of $0.2 million in the 2006 period, an increase of $3.4 million. The increase in total dollars was primarily attributable to increased revenue associated with the acquisition of SDS in June 2007.
Selling, General and Administrative Expense
Our total selling, general and administrative expense was $40.3 million in 2007 compared to $31.7 million in the 2006 period, an increase of $8.6 million, or 27.1%. This increase was primarily attributable to expenses relating to the acquisition of SDS in June 2007, partially offset through the elimination of a $2.8 million corporate allocation from Blue Cross and Blue Shield of South Carolina, as well as the elimination of $4.5 million in expenses present in Companion in the 2006 period. In addition, we incurred $0.4 million of equity-based compensation expense in 2007. As a percentage of revenue, selling, general and administrative expense decreased to 39.4% in 2007 compared to 83.0% in 2006 primarily attributable to operating efficiencies and synergies achieved through the acquisition of SDS.
Depreciation and Amortization Expense
Our depreciation and amortization expense was $6.1 million in 2007 compared to $0.7 million in the 2006 period, an increase of $5.4 million, or 771.4%. This increase was primarily attributable to increased depreciation and amortization expense related to the acquisition of SDS. In 2007, we included amortization of capitalized software development of $2.0 million in our software and other services costs.
Interest Expense, Net of Interest Income
Our interest expense was $10.3 million in 2007 compared to interest income of $0.1 million in the 2006 period, an increase of $10.4 million. This increase was primarily attributable to additional debt incurred in connection with the acquisition of SDS in June 2007.
Income Taxes
Our income tax benefit was $5.3 million in 2007 compared to $0.9 million in the 2006 period, which resulted in an effective income tax rate of 44.3% and 15.9%, respectively. In 2007, the differences between the federal statutory rate and the effective income tax rate were caused by adjustments related to non-deductible equity compensation, state income taxes and prior year reconciliation adjustments. In 2006, the difference between the federal statutory rate and the effective income tax rate were caused by adjustments related to the annual change in the valuation allowance, state income taxes and changes in the income tax contingency reserve. See note 13 in the consolidated financial statements for the year ended December 31, 2007 and the period ended December 30, 2006 contained elsewhere in this prospectus for additional information about our income taxes.
The variability in the effective income tax rate between 2006 and 2007 was primarily driven by the changes in the valuation allowance during the period ended December 30, 2006 against the net deferred income tax assets, excluding the deferred income tax liability recorded related to indefinite lived intangible assets, which did not occur during the period ended December 31, 2007. We determined that no valuation allowance was necessary to be recorded against the net deferred income tax assets during the period ended December 31, 2007, as sufficient positive evidence existed that it was more likely than not that we would ultimately realize the net deferred income tax assets, primarily as a result of the acquisition of Smart Holdings Corporation in June 2007.
67
Table of Contents
Adjusted EBITDA
Our Adjusted EBITDA in 2007 was $7.0 million compared to $1.3 million in the 2006 period. As a percentage of revenue, our Adjusted EBITDA was 6.8% in 2007 compared to 3.4% in the 2006 period. This increase was due to the acquisition of SDS in June 2007 and the elimination of expenses in our software and other services segment in 2007. See “Use of Non-GAAP Financial Measures” on page 58.
Liquidity and Capital Resources
General
We are a holding company with no material business operations. Our principal asset is the equity interests we own in our direct and indirect subsidiaries through which, we conduct all of our business operations. Accordingly, our only material sources of cash are dividends or other distributions or payments that are derived from earnings and cash flow generated by our subsidiaries.
We have financed our operations primarily through cash provided by operating activities, equity issuances and borrowings under our credit agreement. These sources of financing have been our principal sources of liquidity to date. We intend to use the net proceeds from this offering to repay a portion of our indebtedness and the balance, if any, for working capital and general corporate purposes. We believe that our existing cash on hand, the net proceeds from this offering, cash generated from operating activities and available borrowings under our revolving credit agreement will be sufficient to service our existing debt, finance internal growth, fund capital expenditures and fund small to mid-size acquisitions.
As of June 30, 2009, we had cash and cash equivalents of $0.6 million as compared to $5.8 million as of December 31, 2008 and $7.2 million as of December 31, 2007. Our total indebtedness was $245.8 million as of June 30, 2009.
Our principal needs for liquidity have been, and for the foreseeable future will continue to be, for debt service, working capital, capital expenditures and acquisitions. Working capital requirements increased as a result of our growth and acquisitions. The main portion of our capital expenditures has been and is expected to continue to be for computer and related equipment to support our scanning and printing operations within the ROI services segment. We believe that our cash flow from operations, available cash and cash equivalents and available borrowings under the revolving portion of our credit facility will be sufficient to meet our liquidity needs, including for capital expenditures, through at least the next 12 months. Our existing revolving credit facility and our senior term loan do not mature until September 22, 2013. We anticipate that to the extent that we require additional liquidity, it will be funded through borrowings under our credit facility, the incurrence of other indebtedness, additional equity financings or a combination of these potential sources of liquidity. The credit markets have been experiencing extreme volatility and disruption that have reached unprecedented levels. In many cases, the market for new debt financing is extremely limited and in some cases not available at all. In addition the markets have increased the uncertainty that lenders will be able to comply with their previous commitments. As such, we cannot assure you that we will be able to obtain this additional liquidity on reasonable terms or at all. Additionally, our liquidity and our ability to meet our obligations and fund our capital requirements is also dependent on our future financial performance, which is subject to general economic, financial and other factors that are beyond our control. Accordingly, we cannot assure you that our business will generate sufficient cash flow from operations or that future borrowings will be available under our credit facilities or otherwise to meet our liquidity needs.
68
Table of Contents
Although we have no specific current plans to do so, if we decide to pursue one or more significant strategic acquisitions, we may incur additional debt or sell additional equity to finance the purchase of those businesses.
Cash Flows
As of June 30, 2009 and as of December 31, 2008, 2007 and the period ended December 30, 2006, we had cash and cash equivalents of $0.6 million, $5.8 million, $7.2 million and $4.8 million, respectively.
Our cash provided by (used in) operations is generally derived from cash receipts generated by our customers. Cash provided by (used in) operations by accounts receivable as of the period ended December 30, 2006, the years ended December 31, 2007 and 2008, and the six months ended June 30, 2008 and June 30, 2009 was $0.4 million, $2.9 million, $(7.1) million, $(5.4) million and $(8.1) million, respectively. Cash paid for the operating expenses of providing services and products to our customers. Cash provided by (used in) operations related to operating expenses as of December 30, 2006, the years ended December 31, 2007 and 2008, and the six months ended June 30, 2008 and June 30, 2009 was $(3.5) million, $3.1 million, $4.0 million, $(0.4) million and $(5.3) million, respectively. Our primary source of cash from operations is cash from customer accounts receivables. The majority of our accounts receivable and revenue is derived from our ROI services segment. The typical credit terms under our customer contracts are 30 days and our collection efforts are primarily at the requestor level. As a result, our days sales outstanding usually runs approximately 50 days. See “— Days Sales Outstanding.” Our accounts receivable has increased primarily due to acquisitions and organic revenue growth.
We have not utilized borrowings available under our senior secured credit facility to fund operations. However, based on the timing of debt service payments, we have used the revolving credit facility in the past. Our cash flows in operations can have fluctuations from period to period due to unforeseen factors. These factors may include changes in working capital from inconsistent timing of cash receipts and payments for items such as accounts payable, incentive compensation, changes in deferred revenue, interest payments and other various items. In addition, significant acquisitions and organic growth impact the incremental net cash flows from operations due to growth in revenue.
Investing activities have been substantially used for purchases of businesses. We believe that investing activities could be materially impacted by future acquisitions. For the years ended December 31, 2007 and 2008, we had acquisition costs of $195.4 million and $96.5 million, respectively. Our capital expenditures are typically for routine purchases of computer equipment to maintain and upgrade our technology infrastructure. We have made additional purchases of computer and related equipment to support the revenue from our recent acquisitions of SDS and ChartOne, as well as leases for some of the equipment necessary to support the acquired revenue. We anticipate future capital expenditures for maintenance, support and enhancements of existing technology and continued investments in new technologies. In addition, we have made software development investments, which consist primarily of our design, development, testing and deployment of new applications and new functionality to existing applications. Although we have financed some of these purchases in the past, we anticipate funding future capital expenditures with cash flows from operations.
Financing activities have been substantially used for funding the acquisitions of SDS and ChartOne, as well as the leased equipment needed for the integration of ChartOne. In 2007, we used the borrowings under our prior credit facility primarily for the acquisition of SDS. In 2008, the borrowings under our senior secured credit facility were used primarily for the acquisition of ChartOne. In 2009, financing activities have been primarily used for payments under our term
69
Table of Contents
loan, use of the revolving line of credit for timing of working capital with the newly acquired revenue and capital purchases as well as payments on capital leases. For the years ended December 31, 2007 and 2008, we had net borrowings of $194.8 million and $99.4 million, respectively, primarily for the SDS and ChartOne acquisitions.
We intend to continue to expand our business primarily through acquiring additional customers, providing additional services to current customers and acquiring businesses. We believe that internally generated funds, together with borrowings under our senior secured credit facility, will be adequate to satisfy our working capital requirements. Future expansion of our business may require us to obtain additional debt or equity if internally generated funds and the funds available under our senior secured credit facility are inadequate to meet such needs. There can be no assurance that we will be able to obtain such additional debt or equity on favorable terms, or at all.
Days Sales Outstanding
The majority of our revenue is derived from our ROI services segment. Our ROI revenue is generated by entering into contracts with hospitals, health systems and physician clinics. These contracts outsource the ROI function and allow us to charge requestors a flat fee plus a per-page fee in accordance with a fee schedule established by state regulation for the retrieval and delivery of the health record. Because we bill per page, our accounts receivable is made up of thousands of small dollar transactions.
The typical credit terms are 30 days, and our collection efforts are primarily at the requestor level. We bill several hundred thousand transactions each month to requestors, including attorneys, insurance companies, government agencies, healthcare institutions and individuals. As a result, our days sales outstanding, or DSO, net of allowance for doubtful accounts, are approximately 50 days. Our accounts receivable balance has increased primarily due to the increase in revenue resulting from the SDS and ChartOne acquisitions.
We estimate our provision for doubtful accounts primarily based on cash collection analysis, accounts receivable aging reports, as well as DSO. Approximately 10% of our ROI revenue and 50% of our bad debt expense is related to small dollar billings to individuals. We send statements and dunning notices to collect these invoices. This also has an impact on our allowance for doubtful accounts, which is approximately one-third of our gross receivables. We continue to collect these receivables between 180 and 365 days at a rate of less than 10%. Our policy is to write-off accounts receivable after 365 days. Our business has grown substantially through two significant acquisitions and, accordingly, the bad debt expense has also increased. We bill revenue daily and, consequently, the number of business days in a month can greatly impact cash collections as well as accounts receivable. This variance can create volatility in our working capital. We increased our revenue 84% from the twelve months ended December 31, 2008 compared to the same period ended December 31, 2007, and 51% from the six months ended June 30, 2009 compared to June 30, 2008, primarily due to the SDS and ChartOne acquisitions.
We believe that DSO is an important measure of collections on our accounts receivable, as well as our liquidity. Our DSO’s by segment are as follows:
| Year Ended | Six Months Ended | |||||||
| December 31, 2007 |
December 31, 2008 |
June 30, 2008 |
June 30, 2009 | |||||
| DSO - ROI |
49.51 | 49.11 | 45.36 | 50.55 | ||||
| DSO - Software and Other Services |
45.86 | 38.06 | 34.43 | 39.45 | ||||
70
Table of Contents
Net Operating Losses
CT Technologies Intermediate (Topco) Holdings, Inc., or CT Topco, our wholly-owned indirect subsidiary, is organized as a corporation, and is not a pass-through entity for tax purposes. As a result, CT Topco pays federal and state taxes. At December 31, 2007 and 2008, CT Topco and its subsidiaries had federal net operating loss carryforwards of approximately $40 million and approximately $126.0 million, respectively, subject to annual utilization limitations pursuant to Internal Revenue Code Section 382. At December 31, 2008, approximately $100.0 million of the total federal net operating loss carryforward of $126.0 million was subject to pre-existing annual utilization limitation pursuant to Internal Revenue Code Section 382. If not utilized, the federal net operating loss carryforwards will expire between 2012 and 2028. At December 31, 2008, CT Topco and its subsidiaries have $0.1 million of federal general business tax credits which will expire between 2008 and 2025 if not utilized. At December 31, 2007 and 2008, CT Topco and its subsidiaries have state net operating loss carryforwards of approximately $28.3 million and approximately $90.4 million, respectively, which have various dates of expiration.
Credit Facility
Our indirect wholly-owned subsidiary, CT Technologies Intermediate Holdings, LLC, or CT Intermediate, is party to a senior secured credit facility, with GE Capital Corporation, as Agent and Collateral Agent, Newstar Financial, Inc. as Co-Lead Arranger, Syndication Agent and Joint Bookrunner, The Governor and Company of the Bank of Ireland, Maranon Capital, L.P and Ares Capital Corporation each, each as a Co-Documentation Agent and other lenders party thereto, or the Lenders.
The credit agreement provides for a (i) $130.0 million term loan facility and (ii) a revolving loan facility with a $20.0 million aggregate loan commitment amount available, including a sub-facility for letters of credit equal to the lesser of $5.0 million or the unused revolving loan commitment and a $2.0 million swingline facility. We used the proceeds of the term loan to acquire ChartOne in September 2008 and for working capital and other general corporate purposes. The revolving credit facility is available for working capital and other general corporate purposes. As of June 30, 2009, (i) $125.1 million was outstanding under the term loan facility and (ii) $7.4 million was outstanding under the revolving credit facility without giving effect to $3.5 million of outstanding but undrawn letters of credit on such date. The amount outstanding under our senior secured credit facility as of June 30, 2009 was $132.5 million.
Borrowings under the credit agreement bear interest based upon a fixed spread above the banks’ prime lending rate or the LIBOR lending rate. The borrowings under the term loan facility bear interest at June 30, 2009 at 8.7%. The borrowings under the revolving loan facility bear interest at June 30, 2009 at 8.0%.
The term loan facility matures on September 22, 2013 and the revolving loan facility matures on September 22, 2013. We are required to make quarterly principal amortization payments in the respective amounts set forth for the following periods: (1) $2,437,500 for the period of March 31, 2009 through and including December 31, 2009; (2) $3,250,000 for the period of March 31, 2010 through and including December 31, 2010; (3) $4,062,500 for the period of March 31, 2011 through and including December 31, 2011; (4) $4,875,000 for the period of March 31, 2012 through, but not including September 22, 2013. No principal payments are due on the revolving loan facility until the revolving facility maturity date.
In connection with this offering, we will obtain an amendment to the credit agreement, which will modify the required quarterly principal amortization payments. We will be required to make quarterly principal amortization payments in the respective amounts set forth for the
71
Table of Contents
following periods: (1) $2,437,500 for the period of March 31, 2009 through and including December 31, 2009; (2) $4,062,500 for the period of March 31, 2010 through and including December 31, 2010; (3) $4,875,000 for the period of March 31, 2011 through and including December 31, 2011; (4) $5,687,500 for the period of March 31, 2012 through, but not including September 22, 2013. No principal payments are due on the revolving loan facility until the revolving facility maturity date.
In addition, our credit agreement contains financial and other restrictive covenants that limit our ability to incur additional debt and engage in other activities. For example, our credit agreement includes covenants restricting, among other things, our ability to declare dividends, make distributions or redeem or repurchase capital stock, prepay, redeem or repurchase other debt, incur liens or grant negative pledges, make loans and investments and enter into acquisitions and joint ventures, incur additional indebtedness, amend or otherwise alter the acquisition documents or any debt agreements, make capital expenditures, engage in mergers, acquisitions and asset sales, conduct transactions with affiliates, alter the nature of the businesses, or change our or our subsidiaries’ fiscal year. In addition, our loans and other obligations under the credit agreement are guaranteed, subject to specified limitations, by our present and future direct and indirect domestic subsidiaries. See “Description of Certain Indebtedness.”
Our credit agreement also requires us to maintain certain financial ratios. We must maintain a maximum total leverage ratio, for the rolling period ending on the last day of each fiscal quarter, of not more than 5.75 to 1.00 as of September 30, 2009 and December 31, 2009, 5.50 to 1.00 as of March 31, 2010 and June 30, 2010, 5.25 to 1.00 as of September 30, 2010, 5.00 to 1.00 as of December 31, 2010, 4.75 to 1.00 as of March 31, 2011 and June 30, 2011, 4.50 to 1.00 as of September 30, 2011, 4.25 to 1.00 as of December 31, 2011, 4.00 to 1.00 as of March 31, 2012 and June 30, 2012, 3.75 to 1.00 as of September 30, 2012, and 3.50 to 1.00 as of December 31, 2012, March 31, 2013, September 30, 2013 and all fiscal quarters ending thereafter.
We must also maintain a senior leverage ratio, for the rolling period ending on the last day of each fiscal quarter, of not more than 3.75 to 1.00 as of December 31, 2008, March 31, 2009, June 30, 2009 and September 30, 2009, 3.50 to 1.00 as of December 31, 2009, March 31, 2010 and June 30, 2010, 3.25 to 1.00 as of September 30, 2010, 3.00 to 1.00 as of December 31, 2010, 2.75 to 1.00 as of March 31, 2011 and June 30, 2011, 2.50 to 1.00 as of September 30, 2011, 2.25 to 1.00 as of December 31, 2011, 2.00 to 1.00 as of March 31, 2012, June 30, 2012, September 30, 2012, December 31, 2012, March 31, 2013, June 13, 2013, September 30, 2013 and each fiscal quarter ending thereafter.
We are required to maintain a minimum consolidated EBITDA as of the last day of each fiscal quarter, plus an amount equal to 82.5% of the historical consolidated EBITDA of any entity acquired during the relevant period for the rolling period most recently ended prior to such acquisition, of $28.5 million as of December 31, 2008, $29.3 million as of March 31, 2009, $30.6 million as of June 30, 2009, $32.9 million as of September 30, 2009 and $35.8 million as of December 31, 2009.
We must additionally maintain a minimum fixed charge coverage ratio for (i) the rolling period ending on the last day of each fiscal quarter during the period of December 31, 2008 through March 31, 2011, a fixed charge coverage ratio of not less than 1.05 to 1.00 and (ii) for the rolling period ending on the last day of each fiscal quarter during the period of June 30, 2011 and thereafter, a fixed charge coverage ratio of not less than 1.10 to 1.00.
If we are not able to comply with or amend the covenants or financial ratios of our senior secured credit facility in the future, it may result in an event of default under the credit agreement which could adversely affect our ability to respond to changes in our business and
72
Table of Contents
manage our operations. Upon the occurrence of an event of default under our credit agreement, the lenders could elect to declare all amounts outstanding to be due and payable, require us to apply all of our available cash to repay these amounts and exercise other remedies as set forth in the credit agreement. If the indebtedness under our credit agreement were to be accelerated, there can be no assurance that our assets would be sufficient to repay this indebtedness in full.
Senior Subordinated Notes
On September 22, 2008, CT Intermediate, our indirect wholly-owned subsidiary, entered into a note purchase agreement with the purchasers named therein for a total of $75.0 million in aggregate principal amount of 14.0% Senior Subordinated Notes due March 22, 2014. The Senior Subordinated Notes are guaranteed by all or our current and future domestic subsidiaries. Interest is payable quarterly on the first business day of January, April, July and October at a 12.0% interest rate for cash payments and a 2.0% interest rate for payments in-kind, or PIK. For PIK payments, the associated quarterly interest becomes additional principal on which interest begins to accrue on the date of any such deferral. The amount outstanding on the Senior Subordinated Notes as of June 30, 2009 is $76.2 million.
In addition, the note purchase agreement contains financial and other restrictive covenants that limit our ability to incur additional debt and engage in other activities. For example, the note purchase agreement includes covenants restricting, among other things, our ability to incur indebtedness senior in right to the payment of the notes, engage in mergers, acquisitions and asset sales, make investments, loans or advances, incur additional indebtedness subject to exceptions, including certain subordinated obligations not to exceed an aggregate of $15.0 million, conduct transactions with affiliates, change our capital structure, incur liens subject to exceptions, including liens securing indebtedness not exceeding $3.45 million in the aggregate, sell, transfer or assign our common stock or assets or change, amend or refinance our senior secured credit facility.
We are required to maintain a maximum total leverage ratio, for the rolling period ending on the last day of each fiscal quarter, of not more than 6.33 to 1.00 as of December 31, 2008, March 31, 2009, June 30, 2009, September 30, 2009 and December 31, 2009, 6.05 to 1.00 as of March 31, 2010 and June 30, 2010, 5.78 to 1.00 as of September 30, 2010, 5.50 to 1.00 as of December 31, 2010, 5.23 to 1.00 as of March 31, 2011 and June 30, 2011, 4.95 to 1.00 as of September 30, 2011, 4.68 to 1.00 as of December 31, 2011, 4.40 to 1.00 as of March 31, 2012 and June 30, 2012, 4.13 to 1.00 as of September 30, 2012, and 3.85 to 1.00 as of December 31, 2012, March 31, 2013, June 30, 2013, September 30, 2013 and all fiscal quarters ending thereafter.
We must also maintain a senior leverage ratio, for the rolling period ending on the last day of each fiscal quarter, of not more than 4.13 to 1.00 as of December 31, 2008, March 31, 2009, June 30, 2009 and September 30, 2009, 3.85 to 1.00 as of December 31, 2009, March 31, 2010 and June 30, 2010, 3.58 to 1.00 as of September 30, 2010, 3.30 to 1.00 as of December 31, 2010, 3.03 to 1.00 as of March 31, 2011 and June 30, 2011, 2.75 to 1.00 as of September 30, 2011, 2.48 to 1.00 as of December 31, 2011, 2.20 to 1.00 as of March 31, 2012, June 30, 2012, September 30, 2012, December 31, 2012, March 31, 2013, June 30, 2013, September 30, 2013 and each fiscal quarter ending thereafter.
We are required to maintain a minimum consolidated EBITDA as of the last day of each fiscal quarter the following amounts, plus an amount equal to 75% of the historical consolidated EBITDA of any entity acquired during the relevant period for the rolling period most recently ended prior to such acquisition, of $25.7 million as of December 31, 2008, $26.3 million as of
73
Table of Contents
March 31, 2009, $27.5 million as of June 30, 2009, $29.6 million as of September 30, 2009 and $32.2 million as of December 31, 2009.
We must additionally maintain a minimum fixed charge coverage ratio (i) for the rolling period ending on the last day of each fiscal quarter during the period of December 31, 2008 through March 31, 2011, a fixed charge coverage ratio of not less than 0.95 to 1.00 and (ii) for the rolling period ending on the last day of each fiscal quarter during the period of June 30, 2011 and thereafter, a fixed charge ratio of not less than 0.99 to 1.00.
If we are not able to comply with or amend the covenants of note purchase agreement in the future, it may result in an event of default which could adversely affect our ability to respond to changes in our business and manage our operations. Upon the occurrence of an event of default under the note purchase agreement, the purchasers may elect to declare all outstanding notes due and payable immediately without further action or notice and exercise other remedies as set forth in the note purchase agreement. If the indebtedness under our credit agreement were to be accelerated, there can be no assurance that our assets would be sufficient to repay this indebtedness in full.
Senior Preferred Stock
In June 2007, in connection with our acquisition of SDS and pursuant to a securities purchase agreement, we issued to ABRY Partners and its affiliates, our largest stockholder, and Ares Capital Corporation 30,000 shares of senior preferred shares and 7,730 shares of Series C shares for a total offering price of $30.0 million. The securities purchase agreement was amended and restated in September 2008 in connection with our acquisition of ChartOne.
The securities purchase agreement contains certain affirmative and negative covenants. We are also required to comply with financial covenants for maintaining certain levels of leverage and fixed charge coverage.
The senior preferred shares earn a yield of 14% compounded quarterly on the amount of unreturned capital value plus any previously unpaid yield. This yield rate increases to 17% if we have a continuing event of default under the securities purchase agreement. In the event of a liquidation or dissolution of our company, the holders of the senior preferred shares would be entitled to receive a liquidation payment in the amount of any unreturned capital plus unpaid yield prior to any distribution to any other members.
In the event of a liquidation or dissolution of our company, the holders of the Series C shares would be entitled to receive a liquidation payment subsequent to the senior preferred shareholders based upon levels of unreturned capital and unpaid yield relating to the Series A shares.
On September 19, 2014, the senior preferred shares must be redeemed by us at the liquidation value as defined in the securities purchase agreement. As of December 31, 2008, the unreturned capital and unpaid yield of the senior preferred shares was $30.0 million and $7.2 million, respectively. As of June 30, 2009, the unreturned capital and unpaid yield of the senior preferred shares was $30.0 million and $9.8 million, respectively. The senior preferred shares were issued at a discount of $3.7 million and accordingly the discount on the senior preferred shares is being accreted using the effective interest method to the mandatory redemption date of September 19, 2014.
The holders of Series C shares have the right to require us to redeem the Series C shares at fair market value, as defined in the securities purchase agreement, on September 19, 2014.
74
Table of Contents
As a result of the corporate reorganization, the Series C shares will be exchanged for shares of our common stock prior to effectiveness of this registration statement. In addition, the senior preferred shares, including any amounts relating to unpaid yield, will be exchanged for shares of our senior preferred stock prior to effectiveness of this registration statement. The senior preferred stock will have substantially similar preferences, powers, rights, limitations and restrictions as the senior preferred shares. These preferences, powers, rights, limitations and restrictions of the senior preferred stock are further described in “Description of Capital Stock — Senior Preferred Stock.”
We intend to use a portion of the net proceeds from this offering for the redemption in whole of our senior preferred stock.
Contractual Obligations and Other Commitments
As of December 31, 2008, our contractual obligations and other commitments were as follows:
| Payments due by Period | |||||||||||||||
| Total | Less than 1 year |
1-3 years | 3-5 years | More than 5 years | |||||||||||
| (in thousands) | |||||||||||||||
| Long-term debt obligations(a) |
$ | 209,413 | $ | 9,750 | $ | 29,250 | $ | 95,000 | $ | 75,413 | |||||
| Interest costs(b) |
92,783 | 20,270 | 37,524 | 32,739 | 2,250 | ||||||||||
| Capital lease obligations(c) |
962 | 314 | 637 | 11 | — | ||||||||||
| Operating lease obligations |
12,869 | 4,792 | 4,739 | 3,338 | — | ||||||||||
| Senior Preferred Shares(d) |
37,200 | — | — | — | 37,200 | ||||||||||
| Total |
$ | 353,227 | $ | 35,126 | $ | 72,150 | $ | 131,088 | $ | 114,863 | |||||
| (a) | Represents principal payments only. |
| (b) | Represents estimated interest costs in such period based on interest rates currently in effect on our outstanding long-term debt as of December 31, 2008. Interest costs exclude the 2% interest rate for deferred payments associated with the Subordinated Notes and the 14% interest rate for deferred payments associated with the Senior Preferred Shares during such period. If held to term, the cumulative payment of the deferred interest under our Subordinated Notes and our Senior Preferred Shares will be $8.3 million and $44.3 million, respectively. See Notes 6 and 10 to our audited Consolidated Financial Statements included elsewhere in this prospectus. |
| (c) | Represents principal and interest payments. |
| (d) | See Note 10 to our audited Consolidated Financial Statements included elsewhere in this prospectus. |
Off-Balance Sheet Arrangements
We have no off-balance sheet financing arrangements other than our operating leases.
Qualitative and Quantitative Disclosures about Market Risk
Interest Rate Risk
We are exposed to interest rate risk in connection with borrowings under our senior secured credit facility. Our term loan bears interest at floating rates based on the LIBOR or the greater of the prime rate or the federal funds rate plus an applicable borrowing margin. Borrowings under our revolving credit facility bear interest at floating rates based on the LIBOR or a base rate plus an applicable borrowing margin. For variable rate debt, interest rate changes generally do not affect the fair value of the debt instrument, but do impact future earnings and cash flows, assuming other factors are held constant.
To manage our interest rate exposure and fulfill requirements under our senior secured credit facility, effective December 31, 2008, we entered into two interest rate swap agreements with HSBC that effectively converted a portion of our debt under our senior secured credit facility from a floating interest rate to a fixed interest rate. Under the first interest rate swap
75
Table of Contents
agreement, we exchange with HSBC on a quarterly basis the difference between a fixed rate of 3.65% and the floating interest rate option equal to the USD-LIBOR-BBA calculated by reference to an agreed notional principal amount of $65.0 million. This interest rate swap agreement will expire on September 30, 2010. The second interest rate swap agreement has a floor under which we exchange with HSBC on a quarterly basis with a floor rate of 3.0% and a floating interest rate option equal to the USD-LIBOR-BBA calculated by reference to an agreed notional principal amount of $65.0 million and expires on May 31, 2010. The fair value of the two interest rate swaps were $(1.9) million and $(2.4) million, at December 31, 2008 and June 30, 2009, and are included in the accompanying consolidated balance sheets in accrued expenses. Based on the amount outstanding under our senior secured credit facility at June 30, 2009, a change of one percentage point in the applicable interest rate, before the effect of our interest rate swap agreements, would cause an increase or decrease in interest expense of $1.3 million on an annual basis. For further information on the interest rate swap agreements, see note 6 to our audited consolidated financial statements included elsewhere in this prospectus.
Effects of Inflation
Inflation generally affects us by increasing costs of labor, supplies and equipment. We do not believe that inflation had any material effect on our results of operations in the periods presented in our financial statements.
Recent Accounting Pronouncements
Fair Value Measurements
In September 2006, the Financial Accounting Standards Board, or FASB, issued SFAS No. 157, Fair Value Measurements, or SFAS No. 157, which, among other things, established a framework for measuring fair value and required supplemental disclosures about fair value measurements. The changes resulting from the application of this new accounting pronouncement primarily relate to the definition of fair value and the methods used to measure fair value. SFAS No. 157 was effective for fiscal years beginning after November 15, 2007. However, the FASB subsequently deferred SFAS No. 157 for one year insofar as it relates to certain non-financial assets and liabilities.
We adopted SFAS No. 157 on January 1, 2008, except for the provisions relating to non-financial assets and liabilities that are not required or permitted to be recognized or disclosed at fair value on a recurring basis. The adoption of SFAS No. 157 for financial assets and liabilities that are carried at fair value on a recurring basis did not have a material impact on our financial position or results of operations. Non-financial assets and liabilities for which the Company has not applied the provisions of SFAS No. 157 include: (i) those items measured at fair value in goodwill impairment testing; (ii) tangible and intangible long-lived assets measured at fair value for impairment testing; and (iii) those items initially measured at fair value in a business combination. The portion of the standard that defers the effective date of SFAS No. 157 for one year for certain non-financial assets and non-financial liabilities measured at fair value, except those that are recognized or disclosed at fair value in the financial statements on a recurring basis, was implemented January 1, 2009.
Fair Value Option for Financial Assets and Financial Liabilities
In February 2007, the FASB issued SFAS No. 159, The Fair Value Option for Financial Assets and Financial Liabilities — Including an amendment of FASB Statement No. 115, or SFAS No. 159, which is effective for fiscal years beginning after November 15, 2007. This statement permits entities to choose to measure many financial instruments and certain other items at fair
76
Table of Contents
value. This statement also establishes presentation and disclosure requirements designed to facilitate comparisons between entities that choose different measurement attributes for similar types of assets and liabilities. Unrealized gains and losses on items for which the fair value option is elected would be reported in earnings. We have adopted SFAS No. 159 and have elected not to measure any additional financial instruments and other items at fair value.
Purchase Method of Accounting for Acquisitions
In December 2007, the FASB issued SFAS No. 141 (revised 2007), Business Combinations, or SFAS No. 141(R). SFAS No. 141(R) retains the purchase method of accounting for acquisitions, but requires a number of changes, including changes in the way assets and liabilities are recognized in the purchase accounting as well as requiring the expensing of acquisition-related costs as incurred. Additionally, SFAS No. 141(R) provides guidance for recognizing and measuring the goodwill acquired in the business combination and determines what information to disclose to enable users of the financial statements to evaluate the nature and financial effects of the business combination. Furthermore, this standard requires any adjustments to acquired deferred tax assets and liabilities occurring after the related allocation period to be made through earnings for both acquisitions occurring prior and subsequent to the effective date of this standard. SFAS No. 141(R) is effective on January 1, 2009 for us. Earlier adoption was prohibited. The adoption of SFAS No. 141(R), prospectively, may have a material effect on our results of operations and financial position, to the extent that we have material acquisitions, as costs that have historically been capitalized as part of the purchase price will now be expensed, such as accounting, legal and other professional fees.
Non-controlling Interests in Consolidated Financial Statements
In December 2007, the FASB issued SFAS No. 160, Noncontrolling Interests in Consolidated Financial Statements — An Amendment of ARB No. 51, or SFAS No. 160. SFAS No. 160 amends Accounting Research Bulletin No. 51, Consolidated Financial Statements, or ARB No. 51, to establish accounting and reporting standards for the noncontrolling interest in a subsidiary and for the deconsolidation of a subsidiary. SFAS No. 160 clarifies that a noncontrolling interest in a subsidiary is an ownership interest in the consolidated entity that should be reported as equity in the consolidated financial statements. Additionally, SFAS No. 160 changes the way the consolidated income statement is presented by requiring consolidated net income to be reported at amounts that include the amounts attributable to both the parent and the noncontrolling interest. SFAS No. 160 requires expanded disclosures in the consolidated financial statements that clearly identify and distinguish between the interests of the parent’s owners and the interests of the noncontrolling owners of a subsidiary, including a reconciliation of the beginning and ending balances of the equity attributable to the parent and the noncontrolling owners and a schedule showing the effects of changes in a parent’s ownership interest in a subsidiary on the equity attributable to the parent. SFAS No. 160 does not change ARB No. 51’s provisions related to consolidation purposes or consolidation policy, or the requirement that a parent consolidate all entities in which it has a controlling financial interest. SFAS No. 160 does, however, amend certain of ARB No. 51’s consolidation procedures to make them consistent with the requirements of SFAS No. 141(R) as well as to provide definitions for certain terms and to clarify some terminology. SFAS No. 160 is effective on January 1, 2009 for us. Earlier adoption was prohibited. SFAS No. 160 must be applied prospectively as of the beginning of the fiscal year in which it is initially applied, except for the presentation and disclosure requirements, which must be applied retrospectively for all periods presented. The adoption of SFAS No. 160 did not have a material impact on our results of operations, cash flows or financial position.
77
Table of Contents
Derivative Instruments and Hedging Activities
In March 2008, the FASB issued SFAS No. 161, Disclosures about Derivative Instruments and Hedging Activities, an amendment of FASB Statement No. 133, or SFAS No. 161. SFAS No. 161 applies to all derivative instruments and related hedged items accounted for under SFAS No. 133, Accounting for Derivative Instruments and Hedging Activities, or SFAS No. 133. SFAS No. 161 requires entities to provide greater transparency about (a) how and why an entity uses derivative instruments, (b) how derivative instruments and related hedged items are accounted for under SFAS No. 133 and its related interpretations, and (c) how derivative instruments and related hedged items affect an entity’s financial position, results of operations, and cash flows. To meet these objectives, SFAS No. 161 requires (1) qualitative disclosures about objectives for using derivatives by primary underlying risk exposure and by purpose or strategy, (2) information about the volume of derivative activity in a flexible format that the preparer believes is the most relevant and practicable, (3) tabular disclosures about balance sheet location and gross fair value amounts of derivative instruments, income statement and other comprehensive income location and amounts of gains and losses on derivative instruments by type of contract, and (4) disclosures about credit-risk related contingent features in derivative agreements. SFAS No. 161 is effective for financial statements issued for fiscal years and interim periods beginning after November 15, 2008. Early application was encouraged, as were comparative disclosures for earlier periods, but neither was required. The adoption of SFAS No. 161 on January 1, 2009 did not have a material impact on our results of operations, cash flow or financial position.
Determination of Useful Life of Intangible Assets
In April 2008, the FASB issued FASB Staff Position, or FSP No. FAS 142-3, Determination of the Useful Life of Intangible Assets, or FSP No. FAS 142-3. This guidance is intended to improve the consistency between the useful life of a recognized intangible asset under SFAS No. 142, Goodwill and Other Intangible Assets, or SFAS No. 142, and the period of expected cash flows used to measure the fair value of the asset under SFAS No. 141(R), when the underlying arrangement includes renewal or extension of terms that would require substantial costs or result in a material modification to the asset upon renewal or extension. Companies estimating the useful life of a recognized intangible asset must now consider their historical experience in renewing or extending similar arrangements or, in the absence of historical experience, must consider assumptions that market participants would use about renewal or extension as adjusted for SFAS No. 142(R)’s entity-specific factors. FSP No. FAS 142-3 is effective for us beginning January 1, 2009. Our adoption of FSP No. FAS 142-3 did not have a material impact on our consolidated financial statements.
Generally Accepted Accounting Principles Hierarchy
In May 2008, the FASB issued SFAS No. 162, The Hierarchy of Generally Accepted Accounting Principles, or SFAS No. 162. SFAS No. 162 identifies the sources of accounting principles and the framework for selecting the principles used in the preparation of financial statements of nongovernmental entities that are presented in conformity with the GAAP hierarchy. SFAS No. 162 is effective for financial statements issued for fiscal years and interim periods beginning after November 15, 2008. Our adoption of SFAS No. 162 did not have a material impact on our consolidated financial statements.
Convertible Debt Instruments
In May 2008, the FASB issued FSP No. APB 14-1, Accounting for Convertible Debt Instruments That May Be Settled in Cash upon Conversion (Including Partial Cash Settlement), or FSP APB 14-1. FSP APB 14-1 specifies that issuers of certain convertible debt instruments must separately account for the liability and equity components thereof and reflect interest
78
Table of Contents
expense at the entity’s market rate of borrowing for non-convertible debt instruments. FSP APB 14-1 is effective for financial statements issued for fiscal years beginning after December 15, 2008, and interim periods within those fiscal years. Early adoption was not permitted. FSP APB 14-1 requires retrospective application to all periods presented in the annual financial statements for the period of adoption and where applicable instruments were outstanding during an earlier period. The cumulative effect of the change in accounting principle on periods prior to those presented shall be recognized as of the beginning of the first period presented. An offsetting adjustment shall be made to the opening balance of retained earnings for that period, presented separately. The adoption of FSP APB 14-1 did not have a material impact on our results of operations, cash flows or financial position.
Income Taxes
Effective January 1, 2009, we adopted Financial Accounting Standards Board Interpretation No. 48, Accounting for Uncertainty in Income Taxes, or FIN 48, which requires a more-likely-than-not threshold for financial statement recognition and measurement of income tax positions taken or expected to be taken in an income tax return. We record a liability for the difference between the income tax benefit recognized and measured pursuant to FIN 48 and the income tax position taken or expected to be taken on our income tax returns. To the extent that our assessment of such income tax positions changes, the change in estimate is recorded in the period in which the determination is made. Prior to 2009, we established contingencies for income taxes when, despite the belief that our income tax positions were fully supportable, we believed that it was probable that our income tax positions would be challenged and possibly disallowed by various authorities. The consolidated income tax provision and related accruals included the impact of such reasonably estimable losses and related interest and penalties as deemed appropriate.
Upon adoption of FIN 48, our policy is to include interest and penalties in our provision for income taxes. Our federal and state income tax returns filed for the tax years 2007 through 2008, the pre-acquisition federal and state income tax returns filed by Companion for tax years 2005 through 2006, the pre-acquisition federal and state income tax returns filed by Smart Holdings Corporation for tax years 2005 through 2007, the pre-acquisition federal and state income tax returns filed by Micro Innovations, Inc. for tax years 2005 through 2006 and the pre-acquisition federal and state income tax returns filed by ChartOne for the tax years 2005 through 2008 generally remain open for examination by the Internal Revenue Service and relevant state taxing jurisdictions.
Fair Value Measurements
In April 2009, the FASB issued FSP No. FAS 157-4, Determining Fair Value When the Volume and Level of Activity for the Asset or Liability Have Significantly Decreased and Identifying Transactions That Are Not Orderly, or FSP No. FAS 157-4. This FSP provides additional guidance for estimating fair value in accordance with SFAS No. 157 when the volume and level of activity for the asset or liability have significantly decreased. This FSP also includes guidance on identifying circumstances that indicate a transaction is not orderly. This FSP emphasizes that even if there has been a significant decrease in the volume and level of activity for the asset or liability and regardless of the valuation technique(s) used, the objective of a fair value measurement remains the same. Fair value is the price that would be received to sell an asset or paid to transfer a liability in an orderly transaction , not a forced liquidation or distressed sale, between market participants at the measurement date under current market conditions. FSP No. FAS 157-4 is effective for interim and annual reporting periods ending after June 15, 2009, and is applied prospectively. The adoption of this standard did not have a material impact on our consolidated financial statements.
79
Table of Contents
Interim Disclosures about Fair Value of Financial Instruments
In April 2009, the FASB issued FSP No. FAS 107-1 and No. APB 28-1, Interim Disclosures about Fair Value of Financial Instruments, or FSP No. FAS 107-1 and No. APB 28-1. This FSP amends FASB Statement No. 107, Disclosures about Fair Value of Financial Instruments, to require disclosures about fair value of financial instruments for interim reporting periods of publicly traded companies as well as in annual financial statements. This FSP also amends APB Opinion No. 28, Interim Financial Reporting, to require those disclosures in summarized financial information at interim reporting periods. FSP No. FAS 107-1 and No. APB 28-1 are effective for interim and annual reporting periods ending after June 15, 2009. The adoption of this standard did not have a material impact on our consolidated financial statements.
Subsequent Events
In May 2009, the FASB issued SFAS No. 165, Subsequent Events, or SFAS No. 165, to establish general standards of accounting for and disclosure of events that occur after the balance sheet date but before financial statements are issued. We adopted this pronouncement for the quarter ended June 30, 2009. We have evaluated our subsequent events through October 21, 2009, which is the filing date of this filing.
Codification and Hierarchy of Generally Accepted Accounting Principles
In June 2009, the FASB issued SFAS No. 168, The FASB Accounting Standards Codification and the Hierarchy of Generally Accepted Accounting Principles, or SFAS No. 168. SFAS No. 168 establishes the FASB Accounting Standards Codification, the Codification, as the single source of authoritative, nongovernmental U.S. GAAP. The Codification does not change U.S. GAAP. All existing accounting standard documents will be superseded and all other accounting literature not included in the Codification will be considered non-authoritative. SFAS No. 168 is effective for interim and annual periods ending after September 15, 2009. Accordingly, we will adopt the provision of SFAS No. 168 in the fourth quarter 2009 to have a material impact on our consolidated financial statements. We do not expect the adoption of the provisions of SFAS No. 168 to have any effect on our financial condition and results of operations.
80
Table of Contents
Overview
We are a leading provider of healthcare information services and technology solutions to approximately 1,900 hospitals and health systems and 8,000 independent and hospital-affiliated physician clinics. Our primary business is providing outsourced technology-enabled release-of-information services to our customers, which we refer to as ROI. ROI is the process by which information contained in patient health records is requested by and provided to authorized requestors such as attorneys, insurance companies, government agencies and others. We believe we are the largest provider of ROI services with a market share of approximately 20%, and utilize our expertise and technology to fulfill requests for health records in an accurate, regulatory-compliant and timely manner. Our ROI services enable our customers to reduce staffing levels associated with these time-consuming and labor-intensive healthcare information functions, allowing them to increase their focus on patient care, and to more effectively comply with increasingly complex and cumbersome regulatory requirements. We also provide other software and services that complement our ROI services, including as recovery audit compliance solutions, revenue cycle management software, healthcare coding and consulting services and physician practice management software.
Our centralized operating model, combined with our proprietary technology platform, is unique to the ROI industry and enables greater economies of scale as well as expedited response times and high service levels. Unlike our competitors’ ROI service offerings, which typically involve simply photocopying and mailing health records, we employ on-site digital imaging and electronically transfer the requested health record via an encrypted Internet-based channel to our centralized data center. Our technology contains user-friendly, secure on-line tracking functionality with extensive reporting capabilities for both our customers and requestors and enables us to deliver the information in either electronic or paper-based form based on the requestor’s preferred medium.
Healthcare providers are required by law to provide ROI services. We estimate, based upon publicly available market information, the total market for ROI services to be approximately $1.2 billion, of which we estimate approximately $500 million relates to hospitals and health systems and $700 million relates to independent and hospital-affiliated physician clinics. We estimate that approximately two-thirds of these services are performed using internal resources, while one-third is outsourced to third-party vendors. We believe we are the largest outsourced ROI provider with approximately 70% of the outsourced market. Requestors who access health records for a variety of reasons include attorneys, usually in connection with a legal proceeding; insurance companies, usually to help underwrite a policy or pay a claim; government agencies, usually to pay entitlement benefits; and physicians, healthcare institutions or individuals, usually for medical purposes. Requestors pay the healthcare provider or outsourced service provider for retrieval and delivery of the health record directly, in accordance with a fee schedule typically established by state regulation. As a result, unlike healthcare providers, we are not affected by changes in regulated reimbursement rates by commercial payers, Medicare or Medicaid. We believe that the complexity of healthcare regulation, as well as recent federal initiatives to control the rising cost of healthcare through the elimination of administrative and clinical inefficiencies, will significantly increase the adoption of healthcare information systems and promote the use of electronic transactions and further utilization of our outsourced services and solutions.
In addition to providing ROI services, we offer a suite of related products and services to our customer base, including software and services to assist in RAC compliance, revenue cycle management, healthcare coding and consulting services and physician practice management.
81
Table of Contents
Most of these products and services enhance the functionality and capabilities of our ROI services. For example, our RAC solution allows our customers to prepare for and comply with a new Medicare payment recovery system that is being phased in and is scheduled for nationwide implementation in 2010, helping them track and organize documentation requests, coding, billing, reviews and all associated paperwork.
For the twelve months ended December 31, 2008, we generated net revenue of $188.2 million and incurred a net loss of $49.8 million. For the twelve months ended December 31, 2008 we generated pro forma net revenue of $242.1 million and incurred a pro forma loss from continuing operations of $59.2 million, inclusive of the September 2008 acquisition of ChartOne, as if acquired on January 1, 2008. For the six months ended June 30, 2009, we generated net revenue of $126.8 million and incurred a net loss of $6.9 million. For the twelve months ended December 31, 2008, we generated Adjusted EBITDA of $18.8 million and we also generated Non-GAAP With Acquisition Adjusted EBITDA of $28.3 million, inclusive of the acquisition of ChartOne as if acquired on January 1, 2008. For the six months ended June 30, 2009, we generated Adjusted EBITDA of $19.0 million. See page 12 for discussion of Adjusted EBITDA, an accompanying presentation of the most directly comparable GAAP financial measure and a reconciliation of the differences between Adjusted EBITDA and the most directly comparable GAAP financial measure.
Our Corporate History
We have completed a series of acquisitions since our inception. These acquired companies have established histories of providing services and solutions to the healthcare industry. Companion was created as a division of Blue Cross Blue Shield of South Carolina in 1975, and SDS began ROI services in 1976. We acquired Companion in December 2006. We acquired SDS in June 2007. The acquisitions combined SDS’s 30-year history in the ROI industry and Companion’s software applications to offer a more complete set of solutions to the hospital, health system and physician clinic markets. We continued to grow with the September 2008 acquisition of ChartOne, which we believe was the second-largest provider of outsourced ROI services in the United States at that time. The ChartOne acquisition allowed us to further leverage our efficient operating capabilities through increased size and market penetration.
Industry
According to a January 2009 report by the CMS, spending on healthcare in the United States was estimated to be $2.2 trillion in 2007, or 16% of the U.S. Gross Domestic Product, or GDP. Healthcare spending is projected to grow at a rate of approximately 6% per annum, and reach approximately $4.4 trillion by 2018, or 20% of GDP. Healthcare providers are under increasing pressures to trim costs while continuing to provide quality care, and as a result have increasingly outsourced non-core healthcare functions to improve efficiency, drive down costs and maintain quality patient care. According to an August 2009 supplemental report issued by International Data Corp., healthcare spending on outsourcing services totaled $2.7 billion in 2007 and is expected to increase to $4.8 billion by 2013, a compounded annual growth rate of 10.7%.
Our outsourced services and technology solutions are focused primarily on the release-of-information market, and also include products and services in the revenue cycle management, healthcare coding and consulting and physician practice management software and services markets. We believe that the markets for our outsourced services and technology solutions will benefit from recent federal initiatives to control the rising cost of healthcare through the elimination of administrative and clinical inefficiencies, which we believe will increase adoption of healthcare information systems and electronic transactions.
82
Table of Contents
Release-of-Information
Millions of healthcare-related records are generated annually in the United States, the vast majority of which are paper-based. These records are maintained by health information management, which we refer to as HIM, departments of hospitals or various administrative personnel at physician clinics. The ROI function for healthcare providers consists of processing requests for a patient’s health record made by a requestor, such as a physician, insurance company, attorney, government agency, healthcare institution or other authorized individual, and delivering a copy of the appropriate records to the requestor for a fee. The process involves examining the requests and corresponding patient medical information to ensure it is compliant with HIPAA, auditing selected requests and records being produced pursuant to such request and determining where the requested information is to be sent and the mode in which it is to be sent, either electronically or via paper-based delivery.
ROI services can be performed either on-site or off-site of a given healthcare provider, depending on the volume of requests experienced and the nature of the provider’s HIM infrastructure. The ROI service provider, whether the healthcare provider itself or its outsourced provider, bills the requestor directly. Pricing is regulated by law in the vast majority of states, depending on the type of requestor, purpose of request and size of record, and varies from state to state. In 2008, our average ROI service price for a billable request was approximately $38.
We estimate that only one-third of the $1.2 billion ROI market currently outsources the ROI function, despite the challenges for healthcare providers to manage the relatively low volume of requests, the complex regulatory framework involved, the continued need for confidentiality of the medical information being processed and the complicated logistics inherent in managing large numbers of relatively small-dollar accounts receivable. Outsourcing this function to an ROI service provider allows healthcare providers to focus on their core competencies, including offering quality patient care, while obtaining third-party assistance in complying with regulatory requirements. The market for ROI services is highly fragmented and the majority of our competitors are regional and local companies that provide services only in a specific geographic market or to certain hospitals and/or physician practices.
Several factors are driving ROI industry growth and are causing more healthcare providers to outsource the process of releasing health records, including:
| • | the aging population in the U.S., which is increasing the quantity of procedures performed; |
| • | increasing complexity of legislation, such as HIPAA and state privacy laws, related to ROI has made the process difficult, expensive and time consuming for healthcare providers to manage internally; |
| • | increasing litigation volume and related increases in requests for health records from attorneys; |
| • | the continued advancement of clinical medical technology, such as imaging modalities, that create significant amounts of incremental data to patients’ health records; |
| • | increasing scrutiny of healthcare providers’ fees by CMS and other insurance payers, leading to increased document requests via RAC audits and other integrity efforts; |
| • | budgetary pressures within healthcare provider organizations, encouraging the outsourcing of non-core processes; |
83
Table of Contents
| • | government regulations that require lengthy document retention periods for healthcare providers and timely access to many types of records, for instance requests that do not require a patient release are required to be kept for several years, depending upon the type of record and the governing state; and |
| • | advancements in information technology, including the adoption of EHRs, that will continue to generate greater volumes of information as well as facilitate the creation of documents. |
Adoption of EHRs will allow us to perform ROI services with higher margins as less labor is required to retrieve an electronic record. We expect to indirectly benefit from federal government incentives recently signed into law that are designed to encourage physicians to adopt EHR systems. Starting in 2011, federal incentives will be significantly expanded over a five-year period for hospitals and physicians who adopt meaningful use of electronic health records. While EHR systems will allow healthcare providers to store and retrieve health records in an efficient and less-costly manner, we believe the demand for ROI services to manage requests for records whether in paper or electronic form and fulfill these requests in a HIPAA-compliant manner will remain strong. Furthermore, the majority of EHR installations generate electronic records only on a go-forward basis meaning that ROI requests most likely will also have a paper component for the foreseeable future.
Revenue Cycle Management Software
RCM software consists of all the processes and efforts that healthcare providers undertake to ensure that payment is properly received for the medical services provided to patients. These processes begin with the collection of relevant demographic information before care is administered and the determination of eligibility for reimbursement related to care, and ends once cash is collected from payers and patients. According to a Health Information Management Systems Society, or HIMSS, Analytics December 2008 publication, total expenditures by U.S. hospitals for RCM software are estimated to exceed $700 million in 2009. While many providers already use information technology, or IT, solutions in managing their revenue, many of them use legacy systems which lack the ability to proactively screen patients’ financial and insurance profiles, adapt to changes in coding protocols in an automated fashion, adequately detect errors during claims preparation before the submission process and identify instances when claims may have been unjustifiably underpaid or not paid at all. Accordingly, hospitals and providers are increasingly finding that adoption of RCM software can yield powerful return on investment and rapid investment payback. Combined with the overall financial pressures discussed above, there has been increasing interest in RCM IT solutions.
Healthcare Coding and Consulting Services
Healthcare consulting consists of a variety of services including HIPAA-compliance expertise, data management, compliance auditing, education, master patient index clean-up and medical coding. These services allow hospitals and physicians to improve margins, reduce backlogs and downtime, improve processes and increase focus on patient care.
According to an August 2009 statement by the American Health Information Management Association, there is a nationwide shortage of certified medical coders in hospitals, physician practices and other healthcare facilities. Due to this lack of certified medical coding specialists, healthcare organizations may struggle to recruit and retain qualified, experienced clinical coders. Accurate and timely coding is a critical component of the hospital revenue cycle. If charts are miscoded due to a lack of coder experience, or are waiting to be coded due to a
84
Table of Contents
shortage of coders, services may be incorrectly billed or the claim submission to the insurer may be delayed. Additionally, the National Committee on Vital and Health Statistics is planning to overhaul the current coding system, which will be replaced by a new system referred to as ICD-10. The target deadline to implement ICD-10 is currently October 1, 2013. When this occurs, coders will need to learn new codes, including 50 times more codes than are used in the current system, which we believe will increase the demand for coding services.
Physician Practice Management Software
Practice management software assists physician practices with administrative tasks such as patient information tracking, appointment scheduling and billing. A December 2006 Frost & Sullivan research report estimates practice management to currently be a greater than $1 billion market opportunity.
Government Healthcare Initiatives
We believe recent federal initiatives to control the rising cost of healthcare through the elimination of administrative and clinical inefficiencies will significantly increase adoption of healthcare information systems and electronic health records, which we expect will drive the increased use of our services and solutions. Furthermore, the goal of reducing administrative costs in healthcare has garnered significant public policy focus. We believe our ability to generate cost reductions for healthcare providers aligns our solutions with stated public policy goals. The current administration’s April 2007 Plan For a Healthy America estimates that 25% of all healthcare spending goes to administrative and overhead spending and that reliance on paper-based records and information systems needlessly increases these costs. A key component of the administration’s healthcare reform initiative includes a significant focus on reducing inefficiency and increasing quality of care.
Government payers have increased initiatives to recover improper payments and overpayments. For example, in March 2005, CMS initiated a demonstration project in three states using recovery audit contractors, who are paid a contingent fee to detect and correct improper Medicare payments. As part of their duties, RACs collect overpayments from Medicare providers, including those providers who were paid for services that were not medically necessary or were incorrectly coded. Effective January 1, 2010, the RAC program will be implemented throughout the United States, with RACs provided authority to pursue improper payments made on or after October 1, 2007.
Federal, state and local government initiatives have further accelerated the adoption of healthcare information technology, or HCIT, beyond the fundamental shifts in the demand for technology by physicians and patients. Most notably, the U.S. government has recently passed the administration’s 2009 federal stimulus package, the HCIT components of which are collectively known as HITECH. This package outlines $20 billion of incentives targeting the acceleration of meaningful usage of EHRs for the purpose of driving significant future healthcare cost savings and clinical benefits. Of that amount, approximately $2 billion is projected to be spent to specifically facilitate the electronic connectivity and use of health information among organizations via EHRs. Because EHR adoption will allow us to perform ROI operations in a more efficient manner, we expect to indirectly benefit from these initiatives. Because EHRs are not currently configured to deliver HIPAA-compliant health record requests nor will they be able to manage the back office functions of the ROI process such as billing and collections, we expect the demand for ROI services to remain strong.
85
Table of Contents
Our Strengths
Leading Market Position
We believe we are the largest ROI service provider to the healthcare industry with approximately 20% of the ROI services market. We estimate, based upon publicly available market information, that the ROI market in the U.S. is approximately $1.2 billion in size, comprising approximately 5,700 hospitals and 200,000 independent and hospital-affiliated physician clinics. We believe that approximately two-thirds of ROI services are performed using internal sources and the remaining one-third is outsourced to third-party vendors. As a result of increased legislative complexity and cost containment initiatives, we believe healthcare providers are increasingly adopting an outsourced strategy. We believe we are the largest outsourced ROI provider with approximately 70% of the outsourced market with the remaining market being highly fragmented and consisting primarily of regional and local providers. We are the only provider of ROI services for the vast majority of our customers, creating a significant barrier to entry. Our national coverage enables us to serve large hospital chains effectively and has enabled us to develop a large group of highly referenceable customers.
Advanced ROI Services
Our centralized operating model, combined with our proprietary technology platform, is unique to the outsourced ROI industry and allows for greater efficiencies and accuracy in processing health information requests. Our ROI solution features several unique benefits to customers, including:
| • | expedited response times and enhanced service levels; |
| • | a flexible platform, which allows us to interface with EHR systems and integrate them into our proprietary technology; |
| • | user-friendly and secure on-line tracking functionality for both requestors and customers, allowing qualified requestors to access their health record requests on-line; |
| • | audit functionality to ensure accuracy on all sensitive requests, such as psychiatric- and HIV-related requests; |
| • | extensive reporting capabilities for customers; and |
| • | an ability to deliver requests via electronic and paper-based media. |
Replication of our ROI solution would require industry expertise and a considerable initial capital investment as well as sufficient scale to warrant such investment, thereby providing a significant barrier to market entry. Unlike our competitors’ ROI service offerings, which typically involve simply creating and mailing photocopies from a hospital customer’s health records department, we employ on-site digital imaging, which enables requested health records to be transmitted electronically to a centralized data center, driving significant economies of scale. Further, this technology allows records to be delivered via an encrypted Internet-based channel that expedites delivery to time-sensitive customers while driving still greater operating efficiencies. We believe our proprietary technology and service allows us to differentiate ourselves from all of our competitors and to replicate our offerings would be expensive and time-consuming. Our ROI services continue to be enhanced by functionality developed in conjunction with certain of our related software and service offerings.
Compelling Value Proposition
We offer a compelling value proposition for hospitals, health systems and physician clinics by allowing these healthcare providers to reduce staffing levels associated with time-consuming and labor-intensive healthcare information management functions. A reduced administrative
86
Table of Contents
burden allows our customers to focus on patient care and more effectively comply with complex regulatory requirements. Our customers achieve savings through the elimination of certain administrative functions needed for (i) compliance with HIPAA regulations to fulfill requests by confirming the appropriate authorization and verifying addresses, etc., (ii) tracking requests, and (iii) delivery of information to the requestor in either electronic or paper-based form. Furthermore, our ROI services enable the collection of the high volume of relatively small-dollar receivables generated by the ROI process more effectively than our customers can achieve internally. For a hospital that manages the ROI function in-house, these relatively small-dollar invoices are often difficult to track and collect and are ultimately written off. Budgetary pressures within healthcare provider organizations further encourage the outsourcing of non-core processes, such as ROI. We estimate that our ROI service recently enabled a single division of a leading national hospital chain to save in excess of $500,000 per year.
In addition, one of the primary ancillary benefits of our technology is the ability to audit the health record request prior to its release. This allows us to enhance compliance for our customers without slowing down the delivery of the health record. On a daily basis, we audit approximately 10% of all processed requests and 100% of all sensitive requests, such as records for psychiatric and HIV-related requests, which hospitals themselves and our competitors cannot efficiently undertake due to their limited technology and processes.
Highly Predictable Revenue Model
We operate a highly predictable and non-cyclical business model, and our ROI customer retention rates have historically exceeded 95%. In addition, the majority of our ROI customers have entered into multi-year contracts with us, which typically generate recurring volumes of health record requests. In excess of 95% of our revenue are repeat or recurring in nature because of the contractual nature of our business.
We are paid by requestors, such as attorneys, insurance companies, government agencies or individuals, on a base rate plus fee per page requested. Payment from requestors is typically established through state regulation and our current average has consistently increased from approximately $36 per billable request in 2006 to approximately $38 per billable request in 2008.
Strong Cash Flow with Low Capital Requirements
Our business generates strong, stable cash flows as a result of our significant operating leverage, our relatively low working capital requirements and the modest capital expenditures needed to support our infrastructure. In addition, to the extent that we can generate taxable income in the future, we expect to be able to use our approximately $126 million of federal net operating loss carryforwards, as of December 31, 2008.
Diversified Customer Base
Currently, we serve approximately 1,900 hospitals and health systems and 8,000 independent and hospital-affiliated physician clinics. Our ROI revenue, while paid to us by the billable requestor, is tracked at the hospital/clinic customer level. Our revenue base is highly diverse, with no single customer accounting for more than 1% of our revenue. Our customers are also highly diversified by geography, type and size, with customers ranging from national hospital systems and academic institutions to small rural clinics. We have long-standing customer relationships with some of the most technologically-advanced and efficient healthcare providers in the country. Moreover, several of our customers have acquired additional facilities in connection with the ongoing consolidation of the hospital and physician clinic sectors, which has enabled us to further grow our relationship with a number of these customers.
87
Table of Contents
Experienced Management Team
We have assembled a highly-experienced management team. Our senior management team averages more than 20 years of healthcare industry experience. Our management team and board of directors include a balance of internally developed leaders and experienced managers from the healthcare industry which provides us with an understanding of the complex needs of our customer base. In addition, our management team has significant experience in identifying, executing and integrating acquisitions, as well as driving organic growth.
Our Growth Strategy
Increase Penetration of ROI Market
We estimate, based upon publicly available market information, that the market for ROI services today is approximately $1.2 billion, of which we estimate $500 million relates to hospitals and $700 million relates to independent and hospital-affiliated physician clinics. We estimate that only approximately one-third of this market currently outsources the ROI function. We believe that the overall trend towards outsourcing non-core functions across the healthcare industry will continue to apply to the outsourcing of the ROI process. The increasing complexity of healthcare legislation in combination with recent federal initiatives to control the rising cost of healthcare through the elimination of administrative and clinical inefficiencies will further accelerate the outsourcing trend and, we believe, increase the use of outsourcing services by hospitals, health systems and physician clinics. We also believe our proprietary technology and our ability to help our customers manage regulatory compliance while reducing cost will continue to allow us to successfully differentiate our ROI services from those of our competitors and increase our market share as the outsourced ROI market continues to expand.
Enhance Our Value Proposition through New Services and Solutions
We believe we are the largest provider to health record requestors and healthcare providers and with our existing relationships with approximately 1,900 hospitals and 8,000 independent and hospital-affiliated physician clinics, we are positioned to leverage our ROI services platform to develop and drive the adoption of new services and solutions within the healthcare information management function. Our many long-standing customer relationships have positioned us to leverage our ROI services platform to develop and drive the adoption of new services and solutions within the healthcare information management function of our customers. For example, government payers have increased initiatives to recover improper underpayments and overpayments through the RAC audit program, pursuant to which contractors are paid a contingent fee to detect and correct improper Medicare payments. In response, we developed a product, RACPro that will allow our customers to manage the challenges of health record requests, coding, billing, and paperwork associated with RAC audits. Our development of RACPro has also led to additional sales of our outsourced ROI services from customers initially interested in the RACPro product.
Capitalize on Industry Trends
We believe that increasing regulatory complexity, advancements in information technology as well as the continued growth in the volume of health records will continue to drive ROI industry growth and will cause more healthcare providers to outsource ROI services.
Continued Growth in Health Records. Advancement in technology, as well as an increasing number of in-hospital and clinic-based procedures, will continue to generate higher volumes of information and require the production and distribution of an increasing number of
88
Table of Contents
documents. Furthermore, increasing scrutiny of healthcare provider’s fees by CMS and other insurance payers are leading to increased document audits and document requests, which we believe will increase the need for ROI services and solutions such as RACPro.
Increasing Regulatory Complexity. Government regulations continue to require lengthy document retention periods and timely access to many types of records. Increasing complexity of HIPAA regulations and state privacy legislation related to ROI has made the process difficult, expensive and time-consuming for healthcare providers to manage internally. As financial pressures at hospitals increase, they may look to outsource non-core ROI functions to improve efficiency, decrease costs and maintain quality patient care.
Advances in Information Technology. The adoption of EHRs will continue to generate greater volumes of information as well as facilitate the production of documents. While EHR systems will allow healthcare providers to store and retrieve health records in an efficient and less costly manner, we believe the demand for outsourced ROI services to manage requests for records whether in paper, electronic or hybrid form, deliver HIPAA-compliant health record requests and manage back-office functions such as billing for and collecting the fees associated with ROI requests will remain strong.
Further Realize Efficiencies of Scale and Rationalize Costs to Improve Profitability
We evaluate and implement initiatives on an ongoing basis to improve our operating and financial performance through cost savings, productivity improvements, and by streamlining our operations by using new technologies. Since late 2007, we have adopted a number of programs to streamline our operations by utilizing new technologies. We also expect to increase margins by increasing the number of health records delivered electronically using our secure, web-based electronic imaging systems. In 2008, approximately 45% of our requests were derived from health records delivered electronically to our requestors. In addition, EHR adoption by our customers significantly reduces the labor component required to process requests that were historically processed with paper records, allowing us to increase our margins and profitability. For example, EHR adoption by one of our large, national, multi-site customers has enabled us to service their many locations with far fewer resources, producing operating margins that are more than double the margins of our average ROI account.
Continue to Successfully Acquire and Integrate Businesses
We have grown our business both organically and through acquisitions and have successfully acquired and integrated multiple businesses across the ROI and healthcare information technology sectors. In June 2007, our predecessor, Companion, acquired SDS. The acquisition combined SDS’s 30-year history in the ROI industry and Companion’s software applications to offer a more complete set of solutions to the hospital, health system and physician clinic markets. We continued to grow with the acquisition of ChartOne, Inc. in September 2008, which we believe was the second-largest provider of outsourced ROI services in the United States at that time. The ChartOne acquisition allowed us to further leverage our efficient operating capabilities through increased scale and market penetration. We expect to continue to evaluate opportunities to improve and expand our revenue and profitability by targeting acquisition candidates in the fragmented ROI market and broader HCIT sector with services and solutions that are complementary to our service offerings. We intend to selectively acquire businesses that will expand our services and solutions while enhancing value for our company.
89
Table of Contents
Our Services and Solutions
We conduct our operations through two business segments: Release-of-Information Services and Software and Other Services. All of our services and solutions are supported by our proprietary technology platform. This infrastructure provides for connectivity between us, our hospital, health system and physician clinic customers, health record requestors and other constituents. In addition, it allows for functionality developed in our software and other services segment to be leveraged in our ROI services to enhance the value proposition to our customers.
Release-of-Information Services
ROI is the process by which information contained in patient health records is requested by and provided to authorized requestors. Requestors who access health records for a variety of reasons, include attorneys, usually for a legal proceeding; insurance companies, usually to help underwrite a policy or pay a claim; government agencies, usually to pay entitlement benefits; and physicians, healthcare institutions or individuals, usually for medical purposes. We use our expertise and proprietary technology to fulfill requests for health records in an accurate, regulatory compliant and timely manner. Our ROI process includes the following steps:
| • | a formal request for medical information is made to the healthcare provider, hospital or physician clinic by an authorized requestor, such as an insurance provider or attorney; |
| • | the healthcare provider forwards the request to us; |
| • | we verify the request against HIPAA and state requirements; |
| • | we retrieve and/or capture the health record from the healthcare provider, then we scan, compress and encrypt the health record; |
| • | the health record data is transmitted to our centralized data center, decrypted and audited for HIPAA compliance; and |
| • | if the health record data is HIPAA-compliant, the request is indexed, invoiced and shipped by mail or through secure electronic delivery to the requestor. |
90
Table of Contents
The flowchart shown below reflects the key elements of our ROI process:
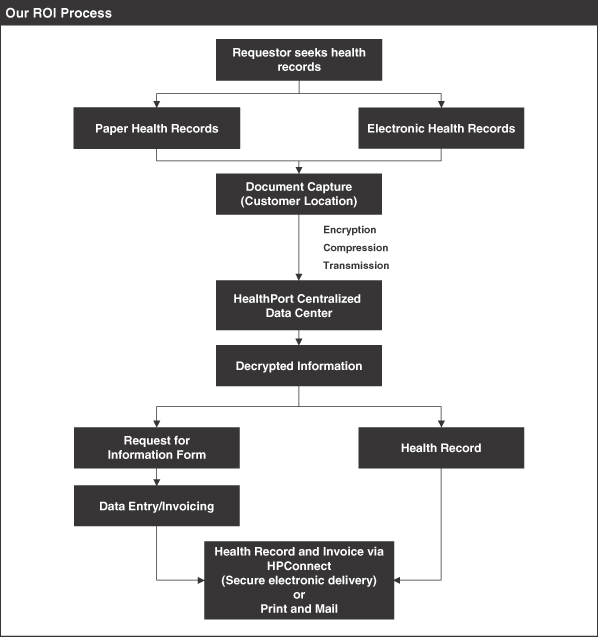
To accommodate paper-based requests, our centralized data center uses an automated document processing system. This system performs address verification and electronic pre-sort functions, produces postage statements and prints, packages and seals the requested materials. Because we pre-sort our packages by sequential postal codes, we benefit from lower postage rates resulting in a more competitive cost structure.
Our proprietary technology and centralized data center enable us to offer important benefits to our ROI customers. We are able to achieve expedited response times and high service levels. Our technology contains user-friendly, secure on-line tracking functionality with extensive
91
Table of Contents
reporting capabilities for both our customers and requestors, and enables us to deliver the information in either electronic or paper-based form based on the requestor’s preferred medium. We offer the ability for qualified requestors to access their health record requests on-line, and our flexible platform allows most EHR systems to integrate into our proprietary technology. In addition, we audit approximately 10% of our daily requests and 100% of any sensitive requests, such as health records of HIV patients or psychiatric-related requests, prior to distribution.
Our ROI services segment revenue is primarily derived from charging requestors a flat fee plus a per-page fee, which varies from state to state. In addition, we also receive revenue from our customers for courtesy copies, which are provided within hospitals themselves or between doctors, in accordance with our contracts.
Software and Other Services
Our software and other services segment provides solutions that complement our ROI services, including recovery audit compliance solutions, revenue cycle management software, healthcare coding and consulting services and physician practice management software.
Recovery Audit Contractor Compliance Solution. Our RAC solution allows hospitals to efficiently manage the challenges associated with U.S. government payers’ increased initiatives to recover improper underpayments and overpayments through the recovery audit contractor program, which we refer to as RAC, pursuant to which selected contractors are paid a contingent fee to detect and correct improper Medicare payments made to healthcare providers. If health records are not made available within the specified timeframe during a RAC audit, a RAC may deny a claim for insufficient documentation, or a technical denial, and affected customers may lose associated Medicare payments as a result. Our RAC compliance solution is comprised of the following elements:
| • | RACPro Software. Our web-based application tracks RAC requests, denials, rebuttals and appeals and provides advanced RAC administrative tools, including real-time financial, compliance and HIM dashboard reports and a full application audit trail history by user. We offer various levels of functionality based on the needs of the healthcare provider. |
| • | RAC Consulting Services. Our consultants use a data-driven approach to help organize, prepare, adapt and manage the RAC process, mitigate RAC risks and assist in RAC appeals and payment disputes. |
Revenue Cycle Management Software. We offer claims management software to hospitals, health systems and physician clinics that improves customer profitability by streamlining the management of a healthcare provider’s revenue cycle. Our software provides for the collection of appropriate demographic information before care is administered, determines eligibility for reimbursement from the appropriate payer and monitors the receipt of payment for medical services provided to patients.
Healthcare Coding and Consulting Services. We offer a variety of services to hospitals and physician clinics that focus on areas of HIPAA-compliance expertise, coding, data management, compliance auditing, education and master patient index rationalization. Our customized programs help fulfill anticipated coding needs by supplementing staff or providing longer-term departmental solutions consisting of both remote coding and on-site options.
Physician Practice Management Software. We offer administrative and financial management software that provide appointment scheduling, regulatory reporting, patient
92
Table of Contents
registration, patient tracking, document management, insurance processing and billing functions. We offer this software primarily to physician clinics on a traditional perpetual license and annually recurring maintenance basis as well as on a hosted basis, inclusive of maintenance services, under a monthly subscription fee.
Customers
Our customers consist of approximately 1,900 hospitals and 8,000 independent and hospital-affiliated physician clinics located throughout the United States. We serve a wide variety of hospitals and physician clinics, ranging from large academic medical centers and multi-specialty clinics to smaller, rural hospitals and single-physician clinics. We have long-standing customer relationships with some of the most technologically advanced and efficient healthcare providers in the country. Our customer base is highly diversified, with no single customer accounting for more than 1% of our total revenue in 2008 and our top 50 customers accounting for only 10% of total revenue in 2008. We have maintained approximately 95% of our ROI customer base annually since our acquisition of SDS in June 2007.
Although we refer to hospitals, health systems and physician clinics as our customers, and our contracts are entered into with them, almost all of our ROI revenue is received directly from various requestors of health records, including attorneys, insurance companies, government agencies and individual patients.
The following table shows our ROI revenue by requestor for the fiscal year ended December 31, 2008:
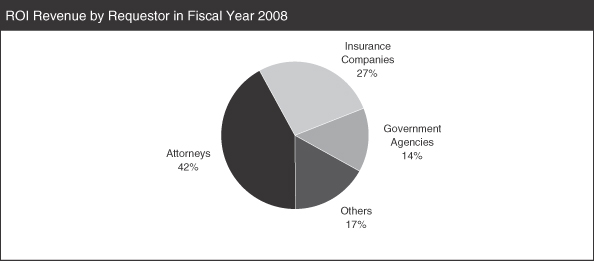
Operations
Sales and Marketing
We actively seek to attract new hospital, health system and physician clinic customers that are currently managing the ROI process internally or using one of our competitors, in addition to healthcare providers that have a need for our services and related software. We market and sell our services and solutions through a direct sales team consisting of 53 employees. This team consists of 10 sales management personnel overseeing 43 direct sales representatives.
93
Table of Contents
The direct sales team is organized geographically and managed on a regional basis, with 12 focused on the hospital ROI market, 23 focused on the physician clinic ROI market, and 18 focused on the market for our other services and related software. Each sales representative is compensated with a base salary plus commissions based on annual new customer revenue generated. The vast majority of our direct sales representatives’ compensation is commission-based and therefore highly correlates with actual sales performance.
We are an active participant in various industry trade shows, including annual meetings for the American Health Information Management Association, or AHIMA, which attracts health information management professionals, the HIMSS, which attracts chief information officers in the healthcare industry and the Healthcare Financial Management Association, or HFMA, which attracts chief financial officers of hospitals and health systems.
Research and Development
Our research and development, or R&D, expenditures primarily consist of investment in our technology infrastructure. We spent $5.0 million and $4.7 million for R&D activities in 2008 and 2007, respectively. As of June 30, 2009, our research and development activities involved approximately 76 employees, including 50 developers, 13 analysts and quality assurance professionals and 13 managers.
Competition
The market for providing outsourced ROI services is highly competitive and fragmented and is characterized by rapidly evolving industry and regulatory standards, technology and customer needs. We have experienced, and expect to continue to experience, competition from multiple sources. We have a number of competitors that offer outsourced ROI services, including various regional and local companies that provide services in a specific geographic market or to certain hospitals and/or physician clinics.
In our software and other services segment, we compete with products and services offered by certain healthcare information technology and service providers, many of whom are large, well-financed and technologically sophisticated companies, such as Allscripts-Misys Healthcare Solutions, Inc., Cerner Corporation, Emdeon Business Services LLC, McKesson Corporation, MedAssets, Inc., The Sage Group plc and The SSI Group. We also compete with hundreds of smaller niche providers in this segment.
Across both our segments, we compete on the basis of several factors, including:
| • | breadth, depth, quality, reliability and ease of use of service and product offerings; |
| • | interoperability of services and products with the existing technology and workflow of customers; |
| • | ability to deliver financial improvement through the use of these services and products; |
| • | brand recognition; and |
| • | contractual price and terms. |
We believe that our ability to provide a compelling value proposition through our technology-driven centralized operating model allows us to effectively compete in the provision of outsourced ROI services. However, in the future, our existing customers may elect, and many of our potential customers may continue to elect, not to outsource their ROI processes to us and instead choose to perform these services internally. In February 2009, Congress passed the
94
Table of Contents
American Recovery and Reinvestment Act of 2009, or ARRA, which provides $20 billion to encourage the adoption and meaningful use of electronic health records systems. As hospitals, physician clinics and other providers adopt and utilize electronic health records systems, they may be able to perform ROI functions internally and the need for our services may decrease. We believe our key advantage over in-house ROI processing is our ability to enable our customers to reduce staffing levels for time-consuming and labor-intensive healthcare information functions, allow them to increase their focus on patient care and more effectively comply with complex regulatory requirements. However, our competitors, particularly in the software and other services segment, may have greater resources, larger sales forces and broader product and service capabilities than us.
Intellectual Property
We rely upon a combination of trade secret, copyright and trademark laws, license agreements, confidentiality procedures, nondisclosure agreements and technical measures to protect the intellectual property used in our business. We generally enter into confidentiality agreements with our employees, consultants, vendors and customers. We also seek to control access to and distribution of our technology, documentation and other proprietary information.
We use numerous trademarks, trade names and service marks for our services and solutions and we also use numerous domain names, including our website www.healthport.com. We also rely on a variety of intellectual property rights that we license from third parties. Although we believe that alternative technologies are generally available to replace such licenses, these third-party technologies may not continue to be available to us on commercially reasonable terms.
The steps we have taken to protect our copyrights, trademarks, servicemarks and other intellectual property may not be adequate, and third parties could infringe, misappropriate or misuse our intellectual property. If this were to occur, it could harm our reputation and adversely affect our competitive position or results of operations. See “Risk Factors — If the protection of our intellectual property is inadequate, our competitors may gain access to our technology or confidential information and we may lose our competitive advantage.”
Regulation and Legislation
The healthcare industry is subject to changing political, regulatory and other influences. National healthcare reform is currently a major focus at the federal level, and congressional leaders are targeting legislation to be passed by the fall of 2009. Among other things, healthcare reform may increase governmental involvement in healthcare, lower reimbursement rates or otherwise change the environment in which healthcare industry constituents operate. Healthcare industry constituents may respond by reducing their expenditures or postponing expenditure decisions, including expenditures for our product and service offerings.
In addition, the healthcare industry is required to comply with extensive and complex laws and regulations at the federal and state levels. Although many regulatory and governmental requirements do not directly apply to our operations, our customers are required to comply with a variety of laws, and we may be impacted by these laws as a result of our contractual obligations. For many of these requirements, there is little history of regulatory or judicial interpretation upon which to rely. We have attempted to structure our operations to comply with applicable legal requirements, but there can be no assurance that our operations will not be challenged or impacted by enforcement initiatives.
95
Table of Contents
We are unable to predict the future course of federal, state or local legislation and regulatory efforts. Further changes in the law, regulatory framework or the interpretation of applicable laws and regulations could reduce our revenue or increase our costs and have an adverse effect on our business, financial condition or results of operations.
HIPAA Administrative Simplification Requirements
General. HIPAA mandated a package of interlocking administrative simplification rules to establish standards and requirements for the privacy and security of health information, including the electronic transmission of certain healthcare claims and payment transactions. These regulations are intended to encourage electronic commerce in the healthcare industry and apply directly to health plans, most providers and healthcare clearinghouses, or Covered Entities. Some of our businesses are considered Covered Entities under HIPAA and its implementing regulations. Other aspects of our operations are considered a business associate under HIPAA and are indirectly impacted by the HIPAA regulations as a result of our contractual obligations to our customers and interactions with other constituents in the healthcare industry that are Covered Entities, or Business Associates. Effective February 17, 2010, ARRA will extend the direct application of some provisions of the Privacy Standards and Security Standards to us when we are functioning as a business associate of our payer or provider customers.
Transaction Standards. The standard transaction regulations established under HIPAA, or Transaction Standards, mandate certain format and data content standards for the most common electronic healthcare transactions, using technical standards promulgated by recognized standards publishing organizations. These transactions include healthcare claims, enrollment, payment and eligibility. The Transaction Standards are applicable to that portion of our business involving the processing of healthcare transactions among payers, providers, patients and other healthcare industry constituents. Failure to comply with the Transaction Standards may subject us to civil and potentially criminal penalties and breach of contract claims. CMS is responsible for enforcing the Transaction Standards.
Providers who are unable to exchange data in the required standard formats can achieve Transaction Standards compliance by contracting with a clearinghouse to translate between standard and non-standard formats. As a result, use of a clearinghouse has allowed numerous payers and providers to establish compliance with the Transaction Standards independently and at different times, reducing transition costs and risks. In addition, the standardization of formats and data standards envisioned by the Transaction Standards has only partially occurred. Multiple versions of a HIPAA standard claim have emerged as each payer defines for itself what constitutes a HIPAA-compliant claim.
In order to help prevent disruptions in the healthcare payment system, CMS has permitted the use of contingency plans under which claims and other covered transactions can be processed, in some circumstances, in either HIPAA standard or legacy formats. CMS terminated the Medicare contingency plan for incoming claims in 2005. The Medicare contingency plan for HIPAA transactions, other than claims, remains in effect. Our contingency plan, pursuant to which we process HIPAA-compliant standard transactions and legacy transactions, as appropriate, based on the needs of our customers, remains in effect. We cannot provide assurance regarding how CMS will enforce the Transaction Standards or how long CMS will permit constituents in the healthcare industry to utilize contingency plans. We continue to work with payers and providers, healthcare information system vendors and other healthcare constituents to implement fully the Transaction Standards.
In January 2009, CMS published a final rule adopting updated standard code sets for diagnoses and procedures known as the ICD-10 code sets. The final rule also resulted in
96
Table of Contents
changes to the formats used for electronic transactions subject to the rule. While use of the ICD-10 code sets is not mandatory until October 1, 2013 and the use of the updated formats is not mandatory until January 1, 2012, we have begun to modify our processes to prepare for their implementation. These changes may result in errors and otherwise negatively impact our service levels, and we may experience complications related to supporting customers that are not fully compliant with the revised requirements as of the applicable compliance date.
NPI Standard. The national provider identifier, or NPI, regulations established under HIPAA, or NPI Standard, require providers that transmit any health information in electronic form in connection with a HIPAA-standard transaction to obtain a single, 10-position all-numeric NPI and to use the NPI in standard transactions for which a provider identifier is required. Health plans and healthcare clearinghouses must use a provider’s NPI to identify the provider on all standard transactions requiring a provider identifier.
All of our clearinghouse systems are fully capable of transmitting transactions that include the NPI. We continue to process transactions using legacy identifiers for non-Medicare claims that are sent to us to the extent that the intended recipients have not instructed us to suppress those legacy identifiers. We cannot provide assurance regarding how CMS will enforce the NPI Standard or how CMS will view our practice of including legacy identifiers for non-Medicare claims. We continue to work with payers, providers, practice management system vendors and other healthcare industry constituents to implement the NPI Standard. Any CMS regulatory change or clarification or enforcement action that prohibited the processing by healthcare clearinghouses or private payers of transactions containing legacy identifiers could have an adverse effect on our business.
Regulation of Healthcare Relationships
A number of federal and state laws govern patient referrals, financial relationships with physicians and other referral sources and inducements to providers and patients, including restrictions contained in amendments to the Social Security Act, commonly known as the federal Anti-Kickback Law. The federal Anti-Kickback Law prohibits any person or entity from offering, paying, soliciting or receiving, directly or indirectly, anything of value with the intent of generating referrals or orders for services or items covered by a federal healthcare program, such as Medicare, Medicaid or TriCare. Violation of the federal Anti-Kickback Law is a felony.
The Office of the Inspector General of HHS has created regulatory safe harbors to the federal Anti-Kickback Law. Activities that comply precisely with a safe harbor are deemed protected from prosecution under the federal Anti-Kickback Law. Failure to meet a safe harbor does not automatically render an arrangement illegal under the Anti-Kickback Law. The arrangement, however, does risk increased scrutiny by government enforcement authorities, based on its particular facts and circumstances. Our contracts and other arrangements may not meet a safe harbor. Many states have laws and regulations that are similar to the federal Anti-Kickback Law. In many cases, these state requirements are not limited to items or services for which payment is made by a federal healthcare program.
The laws in this area are both broad and vague and generally not subject to frequent regulatory or judicial interpretation. We review our practices with regulatory experts in an effort to comply with all applicable laws and regulatory requirements. However, we are unable to predict how these laws will be interpreted or the full extent of their application, particularly to services that are not directly reimbursed by federal healthcare programs, such as transaction processing services. Any determination by a state or federal regulatory agency that any of our practices violate any of these laws could subject us to civil or criminal penalties and require us
97
Table of Contents
to change or terminate some portions of our business. Even an unsuccessful challenge by regulatory authorities of our practices could cause adverse publicity and cause us to incur significant legal and related costs.
False Claims Laws and Other Fraud and Abuse Restrictions
We provide claims processing and other transaction services to providers that relate to, or directly involve, the reimbursement of health services covered by Medicare, Medicaid, other federal healthcare programs and private payers. In addition, as part of our data transmission and claims submission services, we may employ certain edits, using logic, mapping and defaults, when submitting claims to third-party payers. Such edits are utilized when the information received from providers is insufficient to complete individual data elements requested by payers.
As a result of these aspects of our business, we may be subject to, or contractually required to comply with, state and federal laws that govern various aspects of the submission of healthcare claims for reimbursement and the receipt of payments for healthcare items or services. These laws generally prohibit an individual or entity from knowingly presenting or causing to be presented claims for payment to Medicare, Medicaid or other third-party payers that are false or fraudulent. False or fraudulent claims include, but are not limited to, billing for services not rendered, failing to refund known overpayments, misrepresenting actual services rendered in order to obtain higher reimbursement, improper coding and billing for medically unnecessary goods and services. Further, providers may not contract with individuals or entities excluded from participation in any federal healthcare program. Like the federal Anti-Kickback Law, these provisions are very broad. To avoid liability, providers and their contractors must, among other things, carefully and accurately code, complete and submit claims for reimbursement.
Some of these laws, including restrictions contained in amendments to the Social Security Act, commonly known as the federal Civil Monetary Penalty Law, require a lower burden of proof than other fraud and abuse laws. Federal and state governments increasingly use the federal Civil Monetary Penalty Law, especially where they believe they cannot meet the higher burden of proof requirements under the various criminal healthcare fraud provisions. Many of these laws provide significant civil and criminal penalties for noncompliance and can be enforced by private individuals through whistleblower or qui tam actions. For example, the federal Civil Monetary Penalty Law provides for penalties ranging from $10,000 to $50,000 per prohibited act and assessments of up to three times the amount claimed or received. Further, violations of the FCA are punishable by treble damages and penalties of up to $11,000 per false claim. Whistleblowers, the federal government and some courts have taken the position that entities that allegedly have violated other statutes, such as the federal Anti-Kickback Law, have thereby submitted false claims under the FCA.
From time to time, constituents in the healthcare industry, including us, may be subject to actions under the FCA or other fraud and abuse provisions. We cannot guarantee that state and federal agencies will regard any billing errors we process as inadvertent or will not hold us responsible for any compliance issues related to claims we handle on behalf of providers and payers. Although we believe our editing processes are consistent with applicable reimbursement rules and industry practice, a court, enforcement agency or whistleblower could challenge these practices. We cannot predict the impact of any enforcement actions under the various false claims and fraud and abuse laws applicable to our operations. Even an unsuccessful challenge of our practices could cause adverse publicity and cause us to incur significant legal and related costs.
98
Table of Contents
Requirements Regarding the Confidentiality, Privacy and Security of Personal Information
Data Protection and Breaches. In recent years, there have been a number of well-publicized data breaches involving the improper dissemination of personal information of individuals both within and outside of the healthcare industry. Many states have responded to these incidents by enacting laws requiring holders of personal information to maintain safeguards and to take certain actions in response to a data breach, such as providing prompt notification of the breach to affected individuals. In many cases, these laws are limited to electronic data, but states are increasingly enacting or considering stricter and broader requirements. Pursuant to ARRA, HHS must issue regulations later this year requiring covered entities to report certain security breaches to individuals affected by the breach and, in some cases, to HHS or to the public via a website. This reporting obligation will apply broadly to breaches involving unsecured protected health information and will become effective 30 days from the date HHS issues these regulations for Covered Entities, such as our clearinghouse. In addition, the Federal Trade Commission, or FTC, has prosecuted some data breach cases as unfair and deceptive acts or practices under the Federal Trade Commission Act. Further, some of our customers are subject to a new federal rule requiring creditors, which may include health providers and health plans, to implement identity theft prevention programs to detect, prevent, and mitigate identity theft in connection with customer accounts. We may be required to make changes to our operations to assist our customers in complying with this rule. We have implemented and maintain physical, technical and administrative safeguards intended to protect all personal data and have processes in place to assist us in complying with all applicable laws and regulations regarding the protection of this data and properly responding to any security breaches or incidents.
HIPAA Privacy Standards and Security Standards. The privacy regulations established under HIPAA, or Privacy Standards, and the security regulations established under HIPAA, or Security Standards, apply directly as a Covered Entity to our operations as a healthcare clearinghouse and indirectly as a Business Associate to other aspects of our operations as a result of our contractual obligations to our customers. Effective February 17, 2010, ARRA will extend the direct application of some provisions of the Privacy Standards and Security Standards to us when we are functioning as a Business Associate of our payer or provider customers. The Privacy Standards extensively regulate the use and disclosure of individually identifiable health information by Covered Entities and their Business Associates. For example, the Privacy Standards permit Covered Entities and their Business Associates to use and disclose individually identifiable health information for treatment and to process claims for payment, but other uses and disclosures, such as marketing communications, require written authorization from the individual or must meet an exception specified under the Privacy Standards. The Privacy Standards also provide patients with rights related to understanding and controlling how their health information is used and disclosed. Effective February 17, 2010 or later, in the case of restrictions tied to the issuance of implementing regulations, ARRA will impose stricter limitations on certain types of uses and disclosures, such as additional restrictions on marketing communications and the sale of individually identifiable health information. To the extent permitted by the Privacy Standards, ARRA and our contracts with our customers, we may use and disclose individually identifiable health information to perform our services and for other limited purposes, such as creating de-identified information. Determining whether data has been sufficiently de-identified to comply with the Privacy Standards and our contractual obligations may require complex factual and statistical analyses and may be subject to interpretation. The Security Standards require Covered Entities and their Business Associates to implement and maintain administrative, physical and technical safeguards to protect the privacy and security of individually identifiable health information that is electronically transmitted or electronically stored.
99
Table of Contents
If we are unable to properly protect the privacy and security of health information entrusted to us, we could be found to have breached our contracts with our customers. Further, HIPAA includes civil and criminal penalties for Covered Entities that violate the Privacy Standards or the Security Standards, and ARRA significantly increased the amount of the civil penalties. Effective February 17, 2010, Business Associates will also be directly subject to civil and criminal penalties for violation of these standards. Recently, CMS, which enforced the Security Standards until July 2009, and the HHS Office for Civil Rights, which enforces the Privacy Standards and the Security Standards as well, appear to have increased their enforcement activities. CMS announced August 3, 2009 that the Office of Civil Rights, or OCR, will now have responsibility for Security Standards enforcement as well, which may result in even greater enforcement. ARRA has strengthened the enforcement provisions of HIPAA, which may result in further increases in enforcement activity. For example, HHS is required by ARRA to conduct periodic compliance audits of Covered Entities and their Business Associates. ARRA also authorizes state attorneys general to bring civil actions seeking either injunctions or damages in response to violations of HIPAA privacy and security regulations that threaten the privacy of state residents.
We have implemented and maintain policies and processes to assist us in complying with the Privacy Standards, the Security Standards and our contractual obligations. We cannot provide assurance regarding how these standards will be interpreted, enforced or applied to our operations.
Other Requirements. In addition to HIPAA, numerous other state and federal laws govern the collection, dissemination, use, access to and confidentiality of individually identifiable health information and healthcare provider information. In addition, some states are considering new laws and regulations that further protect the confidentiality, privacy and security of health records or other types of medical information. In many cases, these state laws are not preempted by the HIPAA Privacy Standards and may be subject to interpretation by various courts and other governmental authorities. Further, the U.S. Congress and a number of states have considered or are considering prohibitions or limitations on the disclosure of medical or other information to individuals or entities located outside of the United States.
Insurance
Our business involves an inherent risk of product liability and general liability and any claims of these types could have an adverse impact on us. We believe we take appropriate precautions, primarily self-insurance combined with product liability and general liability insurance coverage, to provide adequate coverage for possible liability claims. Though our insurance coverage and cash flows have been adequate to provide for liability claims in the past, such liability claims could exceed our insurance coverage limits and cash flows, and insurance may not be available on commercially reasonable terms or at all. We evaluate our insurance requirements on an ongoing basis to ensure we maintain adequate levels of coverage.
Legal Proceedings
From time to time we may be involved in disputes or litigation relating to claims arising out of our operations. We are not currently a party to any material legal proceedings.
Employees
As of June 30, 2009, we had 2,865 full-time employees and 835 part-time employees, consisting of 379 general and administrative personnel, 3,148 field management and operations
100
Table of Contents
personnel, 76 research and development personnel, 36 information technology personnel, and 61 sales and marketing personnel. We believe that we have a good working relationship with our employees.
Properties
We do not own any real property. Our principal executive offices are located in Alpharetta, Georgia. The following is a list of our principal facilities and their principal functions:
| Location |
Square Footage | Principal Function | ||
| Alpharetta, Georgia |
57,354 | ROI data and distribution center | ||
| Alpharetta, Georgia |
14,105 | Principal executive offices | ||
| Columbia, South Carolina |
46,030 | Operations and data center | ||
| Las Vegas, Nevada |
20,625 | Warehouse | ||
| Midvale, Utah |
5,268 | Western regional office | ||
| Morrisville, North Carolina |
7,897 | Mid-Atlantic regional office | ||
| Nixa, Missouri |
72,120 | Healthcare consulting division | ||
| Ridgeland, Mississippi |
7,172 | Southern regional office |
We believe that our facilities are generally adequate for current and anticipated future use, although we may from time to time lease new facilities or vacate existing facilities as our operations require.
101
Table of Contents
Directors, Executive Officers and Key Employees
Set forth below are the name, age, position and a description of the business experience of each of our executive officers, directors, director nominees and other key employees as of October 21, 2009. The descriptions below include each person’s service as a board member of HealthPort, Inc. and our predecessor. Currently, each of the individuals listed below as a director serves as a member of the board of directors of CT Technologies Holdings, LLC pursuant to the terms of the CT Technologies Holdings, LLC Agreement. See “Certain Relationships and Related Person Transactions — CT Technologies Holdings, LLC Agreement.”
| Name |
Age | Position | ||
| Patrick J. Haynes III |
60 | Chairman of the Board of Directors | ||
| Michael J. Labedz |
44 | President, Chief Executive Officer and Director | ||
| Brian M. Grazzini |
45 | Chief Financial Officer | ||
| Steve Roberts |
38 | Chief Operating Officer | ||
| William V.B. Webb |
57 | Executive Vice President | ||
| William Matits |
43 | Senior Vice President — Sales | ||
| Gene Guertin |
53 | Chief Information Officer | ||
| Jay M. Grossman |
49 | Director | ||
| Erik Brooks |
42 | Director | ||
| Hilary K. Grove |
34 | Director | ||
| Harry S. Bennett |
64 | Director Nominee | ||
| Jack Langer |
60 | Director Nominee |
Executive Officers
Michael J. Labedz has served as our president and chief executive officer since June 19, 2008 and as a member of our board of directors since December 2006. Prior to becoming president and chief executive officer, Mr. Labedz held several senior management positions. He has over 20 years of industry and operational experience in industries such as healthcare, insurance, telecommunications, transaction processing, financial settlement, information technology services and business integration. From July 2006 to December 2006, Mr. Labedz was president of Thurston Group, LLC, a private investment firm located in Chicago, Illinois. From 2001 to 2006, Mr. Labedz held several senior positions with Billing Services Group, a telecommunications data clearinghouse and settlement company, most recently as senior vice president of strategy and operations. Mr. Labedz also served as chief operating officer for Productivity Point International, a computer services company, and as a management consultant with Deloitte Consulting. Mr. Labedz graduated from the University of Illinois with a joint Bachelor of Arts degree in Economics and a Master of Science degree in Accountancy Sciences.
Brian M. Grazzini has served as our chief financial officer since March 2008. From July 2007 through March 2008, Mr. Grazzini served as a consultant to Genoa Healthcare, a provider of long-term healthcare services. From August 2004 through July 2007, Mr. Grazzini served as chief financial officer for Genoa Healthcare. From 2002 to 2004, Mr. Grazzini served as executive vice president and chief financial officer for Centennial Healthcare Corporation, a provider of long-term healthcare services. From 1995 to 2001, he served as senior vice president of finance for Mariner Healthcare, Inc., where he was responsible for financial reporting functions and the direction of the treasury and accounts receivable departments. Mr. Grazzini also served as vice president of finance for several different operational divisions, including rehabilitative services, institutional pharmacy, outpatient rehabilitation clinics, physician management practice, nursing
102
Table of Contents
home and assisted living facilities. Mr. Grazzini has 25 years of experience in accounting and finance, 14 of those years in various senior management positions in healthcare. Mr. Grazzini holds a Bachelor of Accounting degree from Kennesaw State University.
Steve Roberts has served as our chief operating officer since June 2007. From October 2005 to June 2007, Mr. Roberts served as chief operating officer of Smart Document Solutions, LLC, which we acquired in June 2007. From June 2003 to October 2005, Mr. Roberts served as general manager of the Americas services of General Electric Healthcare. Prior to joining GE Healthcare, from June 2001 to June 2003, Mr. Roberts served as vice president of operations for Allscripts Healthcare Solutions, a leading provider of prescription management software and services. Prior to joining Allscripts, Mr. Roberts served in key leadership positions in the areas of services, systems integration, and support for over nine years at McKesson Corporation, a healthcare services company. Mr. Roberts holds a Bachelor of Arts degree in Business Administration from Augustana College and a Master of Business Administration degree from The Kellogg School at Northwestern University.
William V.B. Webb has served as our executive vice president since January 2007. From June 1999 through January 2007, Mr. Webb was the chief development officer and served as a director for Symbion, Inc., a public company that owned and managed national ambulatory care centers. Prior to June 1999, Mr. Webb served as the chief executive officer and as a member of the board of directors of Ambulatory Resource Centres, Inc. until it was acquired by Symbion, Inc. Mr. Webb graduated from Vanderbilt University and served four years as a supply officer in the United States Navy.
William Matits has served as our senior vice president — sales since July 2007. From October 2005 to June 2007, Mr. Matits served as the senior vice president of sales of Smart Document Solutions, LLC, which we acquired in June 2007. Prior to joining SDS, Mr. Matits served as sales territory manager from September 1992 to August 1994 for TMC Corporation, a global medical device manufacturer. Previous to TMC Corporation, Mr. Matits served as district sales manager for Bank of America, Business Services from June 1990 to July 1992. Before that, Mr. Matits served as district sales manager for Automatic Data Processing, the world’s largest provider of outsourcing services from June 1988 to May 1990. Mr. Matits holds a Bachelor of Science degree in Marketing from Fairfield University’s Dolan School of Business.
Gene Guertin has served as our chief information officer since June 2007. From May 2001 to June 2007, Mr. Guertin served as chief information officer of Smart Document Solutions, LLC, which we acquired in June 2007. From September 2000 through April 2001, Mr. Guertin served as senior vice president of operations and development for Zip-Zap.com, a wireless application service provider. From October 1999 to September 2000, Mr. Guertin was vice president of software development for USGift.com, an internet on-line retailer. Prior to joining USGift.com, Mr. Guertin held executive and senior management positions with American Business Products/Curtis 1000, GTE/Contel, now known as Verizon, Tanner Companies and Bechtel Power Corporation. Mr. Guertin holds a Bachelor of Science degree in Civil and Environment Engineering from the New Jersey Institute of Technology and a Master of Business Administration degree from Frostburg State University. Mr. Guertin received CIO Decisions magazine CIO Leadership award in 2006 and is a licensed Professional Engineer in the State of Maryland.
Our executive officers are appointed by our board of directors and serve until their successors have been duly elected and qualified, or their earlier resignation or removal. There are no family relationships among any of our directors or executive officers.
103
Table of Contents
Directors
Patrick J. Haynes, III has served as our Chairman and as a member of our board of directors since December 2006. From December 2006 through June 2008, Mr. Haynes served as our president and chief executive officer. From 2002 until 2006, he served as chairman of Billing Services Group, LTD, which was the successor to Avery Communication, Inc. From 1998 to 2000, he served as chairman of Invengen, LLC, which was acquired by US Information Technologies. From 1992 to 1995, he served as chairman of American Communications Services, Inc. which became E-Spire. Mr. Haynes serves as chairman of Thurston Group, LLC, which he founded in 1986. Prior to that, Mr. Haynes was an investment banker with Merrill Lynch, Pierce, Fenner & Smith LLP, now known as Bank of America Merrill Lynch, and Lehman Brothers. Mr. Haynes serves as a member of the board of directors of various not-for-profit entities.
Jay M. Grossman has served as a director since December 2006. Mr. Grossman is a managing partner at ABRY Partners, our largest stockholder, which he joined in 1996. Prior to joining ABRY Partners, Mr. Grossman was an investment banker specializing in media and entertainment at Kidder Peabody and Prudential Securities. Mr. Grossman currently serves as a director (or the equivalent) of Nexstar Broadcasting Group, Inc. and several private companies, including Monitronics International, Inc., Caprock Communications, LLC, Atlantic Broadband, LLC, CyrusOne, LLC and Executive Health Resource, Inc. Mr. Grossman has a Bachelors of Arts degree from Dickinson College and a Master of Business Administration degree from Harvard Business School.
Erik Brooks has served as a director since December 2006. Mr. Brooks is a partner at ABRY Partners, our largest stockholder, which he joined in 1999. Prior to joining ABRY Partners, Mr. Brooks was a vice president at NCH Capital, a private equity investment fund, from 1995 to 1999. Mr. Brooks currently serves as a director (or the equivalent) of Nexstar Broadcasting Group, Inc. and several private companies, including Monitronics International, Inc., KidzCo LLC Music Resorts, Inc., and Proquest, Inc. Mr. Brooks has a Bachelor of Science degree from Brown University and a Master of Business Administration degree from Harvard Business School.
Hilary K. Grove has served as a director since December 2006. Ms. Grove is a principal at ABRY Partners, our largest stockholder, which she joined in 1999. Prior to joining ABRY Partners, Ms. Grove was an investment banking analyst at Lehman Brothers from 1997 to 1999. Ms. Grove currently serves as a director of several private companies, including Executive Health Resources, Inc., Triple Point Technology, Inc. and Charleston Newspapers. Ms. Grove holds a Bachelor of Arts degree from Dartmouth College.
Director Nominees
Harry S. Bennett has been nominated, and has agreed to serve, as a member of our board of directors upon the completion of this offering. From 2000 until 2008, he served as chairman and chief executive officer of Country Road Communications, LLC, a diversified telecommunications services provider. From 1973 until 1998, he served in several roles, including executive vice president at AT&T Inc. Mr. Bennett has a Bachelor of Arts degree from the United States Military Academy at West Point and a Master of Science degree from the Massachusetts Institute of Technology Sloan School of Business.
Jack Langer has been nominated, and has agreed to serve, as a member of our board of directors upon the completion of this offering. Mr. Langer is a private investor. From 1997 until 2002, he served as managing director and global co-head of the media group at Lehman Brothers Inc. From 1995 until 1997, he served as the managing director and head of the media group at Bankers Trust & Company. From 1990 until 1994, he served as managing director and head of the media group at Kidder Peabody & Company, Inc. Mr. Langer currently serves as a
104
Table of Contents
director of CKX, Inc., SBA Communications Corp., and Atlantic Broadband Corporation, a private company. Mr. Langer has a Bachelor of Arts degree from Yale College and a Master of Business Administration degree from Harvard Business School.
Corporate Governance
Controlled Company
We intend to avail ourselves of the controlled company exception under the corporate governance rules of The NASDAQ Stock Market. Accordingly, we will not have a majority of independent directors on our board of directors, nor will we have a compensation committee and a nominating and corporate governance committee composed entirely of independent directors as defined under the rules of The NASDAQ Stock Market. The controlled company exception does not modify the independence requirements for the audit committee, and we intend to comply with the requirements of Sarbanes-Oxley and The NASDAQ Stock Market, which require that our audit committee be composed of at least three members, a majority of whom will be independent within 90 days of the date of this prospectus, and each of whom will be independent within one year of the date of this prospectus.
Board Composition
Our business and affairs will be managed under the direction of our board of directors. Our bylaws will provide that our board of directors will consist of between and directors. Upon completion of this offering, our board of directors will be comprised of seven directors. Currently, all of our directors are either employed by us or affiliated with ABRY Partners and, therefore, none are considered independent under The NASDAQ Stock Market rules. Messrs. Bennett and Langer have been nominated as directors, each to serve a term beginning immediately following the completion of this offering. Our board of directors has determined that Messrs. Bennett and Langer are independent under the corporate governance rules of The NASDAQ Stock Market. The directors will have discretion to increase or decrease the size of the board of directors.
Board Committees
Our board of directors has or plans to establish the following committees: an audit committee, a compensation committee and a nominating and corporate governance committee. The composition and responsibilities of each committee are described below. Members serve on these committees until their resignation or until otherwise determined by our board.
Audit Committee
We have an audit committee consisting of Messrs. Haynes and Labedz and Ms. Grove. Upon completion of this offering, our audit committee will consist of Mr. Bennett, Mr. Langer and . Mr. Langer will be the chairperson of this committee. Our audit committee will have responsibility for, among other things:
| • | selecting and hiring our independent auditors, and approving the audit and non-audit services to be performed by our independent auditors; |
| • | evaluating the qualifications, performance and independence of our independent auditors; |
| • | monitoring the integrity of our financial statements and our compliance with legal and regulatory requirements as they relate to financial statements or accounting matters; |
| • | reviewing the adequacy and effectiveness of our internal control policies and procedures; |
105
Table of Contents
| • | discussing the scope and results of the audit with the independent auditors and reviewing with management and the independent auditors our interim and year-end operating results; and |
| • | preparing the audit committee report that the SEC requires in our annual proxy statement. |
The SEC rules and The NASDAQ Stock Market rules require us to have one independent audit committee member upon the listing of our common stock on The NASDAQ Stock Market, a majority of independent directors within 90 days of the date of this prospectus and all independent audit committee members within one year of the date of this prospectus. Our board of directors has affirmatively determined that Mr. Bennett and Mr. Langer meet the definition of independent directors for purposes of serving on an audit committee under applicable SEC and The NASDAQ Stock Market rules, and we intend to comply with these independence requirements within the time periods specified. In addition, Mr. Bennett qualifies as our audit committee financial expert.
Our board of directors will adopt a written charter for the audit committee, which will be available on our website upon completion of this offering.
Compensation Committee
Upon completion of this offering, our compensation committee will consist of , and . will be the chairperson of this committee. The compensation committee will be responsible for, among other things:
| • | reviewing and approving compensation of our executive officers including annual base salary, annual incentive bonuses, specific goals, equity compensation, employment agreements, severance and change in control arrangements, and any other benefits, compensations or arrangements; |
| • | reviewing succession planning for our executive officers; |
| • | reviewing and recommending compensation goals, bonus and equity-based compensation criteria for our employees; |
| • | reviewing and discussing annually with management our “Executive Compensation” disclosure required by SEC rules; |
| • | preparing the compensation committee report required by the SEC to be included in our annual proxy statement; and |
| • | administrating, reviewing and making recommendations with respect to our equity compensation plans. |
Corporate Governance and Nominating Committee
Upon completion of this offering, our corporate governance and nominating committee will consist of , and . will be the chairperson of this committee.
The corporate governance and nominating committee is responsible for, among other things:
| • | assisting our board of directors in identifying prospective director nominees and recommending nominees for each annual meeting of stockholders to the board of directors; |
| • | reviewing developments in corporate governance practices and developing and recommending governance principles applicable to our board of directors; |
| • | overseeing the evaluation of our board of directors and management; |
| • | determining the compensation of our directors; and |
| • | recommending members for each board committee of our board of directors. |
106
Table of Contents
Compensation Committee Interlocks and Insider Participation
None of the members of our compensation committee is an officer or employee of our company. None of our executive officers currently serves, or in the past year has served, as a member of the board of directors or compensation committee of any entity that has one or more executive officers serving on our board of directors or compensation committee.
Code of Ethics
We will adopt a code of business conduct and ethics applicable to our principal executive, financial and accounting officers and all persons performing similar functions. A copy of our code of business conduct and ethics will be available upon completion of this offering on our corporate website at www.healthport.com. We expect that any amendments to the code, or any waivers of its requirements, will be disclosed on our website.
Director Compensation
Prior to this offering and our corporate reorganization, our directors have not received compensation for their services as directors, except for the reimbursement of reasonable and documented costs and expenses incurred by directors in connection with attending any meetings of the board of directors or any committee thereof. Certain members of our board of directors received incentive shares and reimbursements for services provided to HealthPort. See “Certain Relationships and Related Party Transactions.”
We did not pay any compensation to our directors during 2008 because all of our directors were either employees of our company or affiliated with ABRY Partners, our largest stockholder.
Our executive officers who are members of our board of directors and the directors who continue to provide services to, or are affiliated with, ABRY Partners will not receive compensation from us for their service on our board of directors. Only those directors who are considered independent directors under the corporate governance rules of The NASDAQ Stock Market are eligible to receive compensation from us for their service on our board of directors. Messrs. Bennett and Langer and all other non-employee directors not affiliated with ABRY Partners will be paid quarterly in arrears:
| • | a base annual retainer of $40,000 in cash; |
| • | an additional annual retainer of $10,000 in cash to the chair of the audit committee; and |
| • | a fee of $1,000 for each board meeting and audit committee meeting attended. |
In addition, upon initial election to our board of directors, each non-employee director will receive an option grant of 25,000 shares of our common stock, which will vest annually in equal installments over four years. For each year of continued service thereafter, each non-employee director will receive an annual option grant of 7,500 shares, which will vest annually in equal installments over four years. We will also reimburse directors for reasonable expenses incurred to attend meetings of our board of directors or committees.
Upon completion of this offering, we will enter into a consulting agreement with Mr. Haynes, our Chairman, for his services as the chairman of the board of directors. Pursuant to the consulting agreement, Mr. Haynes will be paid an annual fee ranging from $276,000 to $451,000 depending on the achievement of certain Measured EBITDA targets and a monthly automobile allowance of $1,250. We have also agreed to indemnify Mr. Haynes from and against any claim by any person with respect to his activities as Chairman. Mr. Haynes will be subject to restrictive covenants, including confidentiality, non-competition and non-solicitation obligations.
107
Table of Contents
Compensation Discussion and Analysis
The purpose of this compensation discussion and analysis section is to provide information about the material elements of compensation that are paid or awarded to, or earned by, our named executive officers, or NEOs, who consist of our principal executive officer, principal financial officer, and the three other most highly compensated executive officers. For 2008, the named executive officers were:
| • | Michael J. Labedz, our President and Chief Executive Officer; |
| • | Brian M. Grazzini, our Chief Financial Officer; |
| • | Steve Roberts, our Chief Operating Officer; |
| • | William V.B. Webb, our Executive Vice President; |
| • | William Matits, our Senior Vice President — Sales; |
| • | Patrick J. Haynes, III, our current Chairman and our former President and Chief Executive Officer; and |
| • | Peter Schmitt, our former Chief Financial Officer. |
Historical Compensation Decisions
Our compensation approach is necessarily tied to our stage of development. Prior to this offering, we were a privately-held company with a relatively small number of stockholders, including our largest stockholder, ABRY Partners. As such, we have not been subject to stock exchange listing or SEC rules requiring a majority of our board of directors to be independent or relating to the formation and functioning of a compensation committee. Most, if not all, of our prior compensation policies and determinations, including those made for 2008, have been the product of negotiations between the named executive officers and our board of directors. These negotiations centered around the expected contribution of the respective executive officer to our corporate performance, the responsibilities delegated to each executive officer and the competitive marketplace for executive talent at other similarly situated companies operating in the healthcare information technology and services industry based upon the general knowledge possessed by our board of directors. Bonus payments and grants of incentive shares were determined in the sole discretion of our board of directors.
Compensation Philosophy and Objectives
Our compensation committee will review and approve the compensation of our NEOs and oversee and administer our executive compensation program and initiatives. As we gain experience as a public company, we expect that the specific direction, emphasis and components of our executive compensation program will continue to evolve. For example, over time we may reduce our reliance upon subjective determinations made by our board of directors in favor of a more empirically-based approach that involves benchmarking against peer companies. Accordingly, the compensation paid to our named executive officers for 2008 is not necessarily indicative of how we will compensate our named executive officers after this offering.
We have strived to create an executive compensation program that balances short-term versus long-term payments and awards, cash payments versus equity awards and fixed versus
108
Table of Contents
contingent payments and awards in ways that we believe are most appropriate to motivate our executive officers. Our executive compensation program is designed to:
| • | attract and retain talented and experienced executives in our industry; |
| • | reward executives whose knowledge, skills and performance are critical to our success; |
| • | align the interests of our executive officers and stockholders by motivating executive officers to increase stockholder value and rewarding executive officers when stockholder value increases; |
| • | ensure fairness among the executive management team by recognizing the contributions each executive makes to our success; |
| • | foster a shared commitment among executives by aligning their individual goals with the goals of the executive management team and our company; |
| • | compensate our executives in a manner that incentivizes them to manage our business to meet our long-range objectives; and |
| • | weigh tax and accounting considerations and the expectation of our executive officers and stockholders including, following this offering, our public stockholders. |
The compensation committee will meet outside the presence of all of our executive officers, including our NEOs, to consider appropriate compensation for our Chief Executive Officer. For all other NEOs, the compensation committee will meet outside the presence of all executive officers except our Chief Executive Officer. Going forward, our Chief Executive Officer will review annually each other NEO’s performance with the compensation committee and recommend appropriate base salary, cash performance awards and grants of long-term equity incentive awards for all other executive officers. Based upon these recommendations from our Chief Executive Officer and in consideration of the objectives described above and the principles described below, the compensation committee will approve the annual compensation packages of our executive officers other than our Chief Executive Officer. The compensation committee also will annually analyze our Chief Executive Officer’s performance and determine his base salary, cash performance awards and grants of long-term equity incentive awards based on its assessment of his performance with input from any consultants engaged by the compensation committee.
We have not retained a compensation consultant to review our policies and procedures with respect to executive compensation, although the compensation committee may elect in the future to retain a compensation consultant if it determines that doing so would assist it in implementing and maintaining compensation plans.
Following this offering, our compensation committee, subject to the terms of each executive’s employment agreement, will determine compensation for our NEOs.
Elements of Compensation
We anticipate that our executive compensation program will consist of:
| • | base salary; |
| • | cash incentive awards linked to corporate and business segment performance under our cash incentive opportunity program; |
| • | periodic grants of long-term equity-based compensation, such as restricted stock or options; |
| • | other executive benefits and perquisites; and |
| • | employment agreements, which contain termination and change of control benefits. |
109
Table of Contents
We will combine these elements in order to formulate compensation packages that provide competitive pay, reward the achievement of financial, operational and strategic objectives and align the interests of our executive officers and other senior personnel with those of our stockholders.
Base Salary
The primary component of compensation of our executive officers has historically been base salary. We believe that the base salary element is required in order to provide our executive officers with a stable income stream that is commensurate with their responsibilities and competitive market conditions. The base salaries of Messrs. Grazzini, Roberts and Schmitt are reviewed on an annual basis and are established in their respective employment agreements.
The base salaries of Messrs. Labedz, Haynes and Webb are determined at least annually, subject to additional determinations upon an acquisition, based upon the achievement of Measured EBITDA, as defined below, within a range of $5.0 million to greater than $25.0 million as set forth in their respective employment agreements. At the time we negotiated their respective employment agreements, we established our corporate financial performance objective and target amounts with reference to achieving pre-set levels of desired financial performance, and with consideration given to our annual and long-term financial plan, as well as to macroeconomic conditions. We believe this corporate performance objective reflected our overall company goals, which balanced the achievement of revenue growth and improving our operating efficiency. For each of Messrs. Labedz, Haynes and Webb, the Measured EBITDA target levels increase in $5 million increments, with each target level subject to a corresponding salary level. Under their respective employment agreements, Measured EBITDA is defined as earnings before interest, taxes, depreciation and amortization, excluding any add-backs and pro forma adjustments for acquisitions, as determined in good faith by our board of directors, for the trailing three months, which is then annualized. We then compare Measured EBITDA with the Measured EBITDA target levels set forth in their respective employment agreement to determine whether to readjust their respective salary level going forward. The Measured EBITDA performance evaluation metric as calculated under their respective employment agreements is calculated differently from the Adjusted EBITDA financial measure that is used by management to measure the consolidated financial performance of the business and adjusted EBITDA as defined in our credit agreement.
For the quarter ended June 30, 2008, our Measured EBITDA was $20.0 million. Measured EBITDA during this period was defined as earnings before interest, taxes, depreciation and amortization, including approximately $900,000 of add backs related to severance and compensation related expenses. In accordance with their respective employment agreements, each of Messrs. Labedz and Haynes’s salary was increased from $350,000 to $400,000, effective July 1, 2008. For the quarter ended December 31, 2008, our Measured EBITDA was $28.4 million. Measured EBITDA during this period was defined as earnings before interest, taxes, depreciation and amortization, excluding approximately $1.3 million of various other adjustments primarily related to the accrual of expenses allowed under our credit facility. In accordance with their respective employment agreements, each of Messrs. Labedz and Haynes’s salary was increased from $400,000 to $475,000, effective October 1, 2008. Our President and Chief Executive Officer and/or board of directors determined that their base salaries should be effective as of October 1, 2008 rather than January 1, 2009 because of their significant contribution towards the successful integration of the ChartOne acquisition, which was completed during the fourth quarter, and the overall performance of the company. Mr. Webb’s salary was maintained at $300,000 during 2008. The base salaries paid to our NEOs in 2008 are set forth in the Summary Compensation Table below.
110
Table of Contents
We are a party to a consulting arrangement with Haynes, LLC to provide consulting services to us. Mr. Haynes, our Chairman, is the sole member, officer and manager of Haynes, LLC. We are also party to an expense-sharing arrangement with Thurston Group, an entity controlled by Mr. Haynes, whereby we reimburse Thurston Group for various corporate services including rent and certain administrative and clerical services. Fees paid to Haynes, LLC for Mr. Haynes are included in the 2008 Summary Compensation Table.
On January 5, 2009, HealthPort Technologies, LLC, our indirect subsidiary, entered into an employment agreement with Mr. Matits. Under his employment agreement, Mr. Matits’s salary is set at $200,000 per year, subject to review on a quarterly basis.
Upon completion of this offering, we intend to enter into a consulting agreement with Mr. Haynes, our Chairman, for his services as the chairman of the board of directors. Pursuant to the consulting agreement, Mr. Haynes will be paid an annual fee ranging from $276,000 to $451,000 depending on the achievement of certain Measured EBITDA targets and a monthly automobile allowance of $1,250. We have also agreed to indemnify Mr. Haynes from and against any and all claims by any person with respect to his activities as Chairman. Mr. Haynes will be subject to restrictive covenants, including confidentiality, non-competition and non-solicitation obligations.
Cash Incentive Awards
An additional component of compensation of our executive officers is our annual cash incentive opportunity program. The starting point involved the determination of a target cash incentive opportunity for each NEO, which is an amount based on a specific percentage of each NEOs salary. The cash incentive targets of Messrs. Grazzini and Roberts are based upon negotiations between the respective NEO and our board of directors in connection with the NEOs employment agreement, which currently provide that Messrs. Grazzini and Roberts are each eligible to receive an annual cash bonus of up to 100% of their respective base salary.
The cash incentive targets of Messrs. Labedz, Haynes and Webb are determined on an annual basis upon the achievement of Measured EBITDA within a range of $5.0 million to greater than $25.0 million as set forth in their respective employment agreements. At the time we negotiated their respective employment agreements, we established our corporate financial performance objective and target amounts with reference to achieving pre-set levels of desired financial performance, and with consideration given to our annual and long-term financial plan, as well as to macroeconomic conditions. We believe this corporate performance objective reflected our overall company goals, which balanced the achievement of revenue growth and improving our operating efficiency. For each of Messrs. Labedz, Haynes and Webb, the Measured EBITDA target levels increase in $5 million increments, with each target level subject to a corresponding target level of bonus compensation that is structured as a percentage of such executive officer’s annual base salary. Under their respective employment agreements, Measured EBITDA is defined the same for the cash incentive opportunity program as for the determination of base salary, but is only used to determine the target level of bonus compensation as a percentage of such executive officer’s annual base salary. We then compare Measured EBITDA with the Measured EBITDA target levels set forth in their respective employment agreement to determine the cash incentive opportunity as a percentage of salary. The Measured EBITDA performance evaluation metric as calculated under their respective employment agreements is calculated differently from the Adjusted EBITDA financial measure that is used by management to measure the consolidated financial performance of the business and adjusted EBITDA, as defined in our credit agreement. For 2008, the target cash incentive opportunity (stated as a percentage of salary) for Messrs. Labedz, Grazzini, Roberts, Webb, Haynes and Schmitt was 50%, 100%, 100%, 50%, 100% and 50%, respectively.
111
Table of Contents
Each year we establish our corporate financial performance objective and target amounts with reference to achieving pre-set levels of desired financial performance, and with consideration given to our annual and long-term financial plan, as well as to macroeconomic conditions. For 2008, the annual cash bonus was linked to achievement of adjusted EBITDA as defined in our credit agreement. We believe this corporate performance objective reflected our overall company goals for 2008, which balanced the achievement of revenue growth and improving our operating efficiency. For purposes of determining the actual bonus amounts under our cash incentive opportunity program in 2008, we used adjusted EBITDA as defined in our credit agreement, which was defined as earnings before interest, taxes, depreciation and amortization, including approximately $9.7 million in pro forma adjustments related to the ChartOne acquisition in September 2008 and excluding approximately $1.7 million of various other adjustments primarily related to the accrual of expenses allowed under our credit facility. Our President and Chief Executive Officer and/or board of directors determined that these unplanned costs were outside management’s control and excluded them when measuring adjusted EBITDA achievement under the cash incentive opportunity program.
For the year ended December 31, 2008, our adjusted EBITDA, as defined in our credit agreement, was $30.2 million. Our board of directors, in its discretion, determined to award Messrs. Labedz, Grazzini, Roberts, Webb, Haynes and Schmitt’s cash incentive bonus of approximately 50%, 109%, 79%, 24%, 100% and 0% of base salary, respectively. Our board of directors, together with Mr. Labedz, reviewed the achievement of adjusted EBITDA, as defined in our credit agreement, by the Company and the respective executive’s scope of responsibility and impact on the performance on the Company, including factors related to the integration of ChartOne, following December 31, 2008. Our board of directors determined the actual amount of bonus paid to Mr. Labedz, and together with Mr. Labedz, determined the bonus payment for each of the other NEOs.
Mr. Matits’s cash incentive was based upon commissions generated by him and his sales organization during the year. Mr. Matits’s current commission rate is 6.5% of second month sales of reoccurring revenue, which is defined as the first full month of revenue from a new site, attributed to all individuals in his sales organization. In addition, if the sales dollar volume based on fourth month sales, which is defined as the average revenue of months two, three and four from a new site, exceeds the sales dollar volume based on actual second month sales, Mr. Matits’s earns an additional commission of 6.5% of this increase. If fourth month sales are less than the sales dollar volume based on actual second month sales 6.5% of the decrease between the second and fourth month sales dollar volume will be deducted from future commission earnings. Mr. Matits’s is also eligible to receive additional commission payments if individuals in his sales group generate certain levels of non-reoccurring revenue based upon a formula set forth in his employment agreement, as well as if we realize certain amounts of sales dollar volumes for a particular fiscal quarter.
Our board of directors, in its discretion, may make adjustments to an NEOs cash incentive payout. In addition, our board of directors, in its discretion, may also choose to authorize additional cash awards to NEOs for outstanding individual performance, which constitutes significant accomplishments achieved in part or in full by the NEO in advancing our overall business objectives. For 2008, as with prior years, individual performance goals and objectives were not formally pre-established and documented for each NEO. Rather, the board of directors’ review involved obtaining an understanding of the specific significant contributions made by each NEO. For 2008, our board of directors did not pay out any additional discretionary cash awards.
Our board of directors has recently agreed to pay Mr. Labedz $187,500 as part of his anticipated bonus for 2009. In addition, our board of directors has recently agreed to pay
112
Table of Contents
Mr. Haynes a pro rata portion of his anticipated bonus for 2009 that would be due through the closing date of this offering. As discussed earlier, the cash incentive targets of Messrs. Labedz and Haynes is determined on an annual basis upon the achievement of Measured EBITDA within a range of $5.0 million to greater than $25.0 million. Our Measured EBITDA for the trailing three months ended March 31, 2009 and June 30, 2009 was $34.0 million and $42.0 million, respectively. Pursuant to their employment agreements, Messrs. Labedz and Haynes’s cash incentive targets were set at 50% and 100% of their base salary, respectively. As discussed earlier, each of their base salaries was increased from $400,000 to $475,000, effective as of October 1, 2008. As a result, Mr. Labedz received $187,500 as part of his anticipated bonus for 2009 and Mr. Haynes will receive the pro rata portion of his anticipated bonus for 2009, which we currently expect to be approximately $395,000. Our board of directors determined in its discretion that Mr. Labedz should receive a portion of his anticipated bonus for 2009 because of his contribution towards the successful integration of the ChartOne acquisition, which was completed during the period, and the overall performance of the company during this period. Similarly, our board of directors determined in its discretion that Mr. Haynes should receive the pro rata portion of his anticipated bonus for 2009 in light of his move to a fixed compensation structure as Chairman of our board of directors.
Based upon our achievement of Measured EBITDA as calculated under the cash incentive opportunity program, and each of Messrs. Labedz, Haynes and Webb’s respective performance review, actual cash incentives earned pursuant to the annual cash incentive opportunity program for each NEO for 2008 are shown in the Summary Compensation Table. Based upon our overall corporate performance and Messrs. Grazzini and Roberts’s respective performance review, actual cash incentives earned pursuant to the annual cash incentive opportunity program for Messrs. Grazzini and Roberts’s for 2008 are shown in the Summary Compensation Table.
Long-Term Equity-Based Compensation
Equity-based awards granted to our NEOs, which prior to this offering have been in the form of Series B shares, provide a long-term incentive and align a portion of our executives’ compensation to the interests of our stockholders and to each other, helping them to work together for their mutual success. Equity-based compensation also fosters a long-term commitment to us by our NEOs and balances the short-term cash components of compensation that we provide. We believe that, when our executive officers possess an ownership interest in us, they have a continuing stake in our long-term success.
Prior to the corporate reorganization, we granted equity awards to our NEOs pursuant to incentive share purchase agreements with each recipient, subject to the terms and conditions set forth in the CT Technologies Holdings, LLC Agreement and Amended and Restated Members Agreement, dated September 22, 2008, which we refer to as the Members Agreement, which permit the grant of incentive shares to our employees by our board of directors. In allocating the number of incentive shares awarded to our NEOs, our board of directors considered each individual’s compensation package and made a subjective determination of the number of incentive shares that would be appropriate to retain and motivate each executive officer in his position. Our board of directors also considered the individual responsibilities of our NEOs.
Our board of directors granted Series B shares to Messrs. Grazzini and Roberts on March 31, 2008. On December 15, 2008, our board of directors granted Series B shares to senior executives, including Messrs. Labedz, Roberts, Matits and Haynes. In connection with each grant of Series B shares, each executive officer executed an incentive share purchase agreement
113
Table of Contents
as of the date of such grant. The grants to Messrs. Labedz, Grazzini, Roberts, Matits and Haynes consisted of 2,691,075, 2,800,000, 2,800,000, 600,000 and 3,321,200 Series B shares, respectively. The Series B shares may not be transferred without the prior written consent of our board of directors, except as provided in the Members Agreement or in accordance with the repurchase provisions of the respective NEOs incentive share purchase agreement.
Under Mr. Labedz’s incentive share purchase agreement, Mr. Labedz’s Series B shares vest in cumulative installments as follows: 30% immediately upon grant, 45% on the first anniversary, 60% on the second anniversary, 80% on the third anniversary, 90% on the fourth anniversary and 100% on the fifth anniversary of the grant date. In addition, all Series B shares will become immediately vested upon a sale of the company or upon an initial public offering provided Mr. Labedz is an employee of our company at the time of such event.
Under Mr. Grazzini’s incentive share purchase agreement, Mr. Grazzini’s Series B shares vest in cumulative installments as follows: 10% on the first anniversary, 30% on the second anniversary, 50% on the third anniversary, 75% on the fourth anniversary and 100% on the fifth anniversary of the grant date. In addition, all Series B shares will become immediately vested upon a sale of the company provided Mr. Grazzini is an employee of our company at the time of such event.
Under Mr. Roberts’s incentive share purchase agreements dated March 31 and December 15, 2008, respectively, Mr. Roberts Series B shares vest in cumulative installments as follows: 10% on the first anniversary, 30% on the second anniversary, 50% on the third anniversary, 75% on the fourth anniversary and 100% on the fifth anniversary of each of the respective grant dates. In addition, all Series B shares will become immediately vested upon a sale of the company provided Mr. Roberts is an employee of our company at the time of such event.
Under Mr. Matits’s incentive share purchase agreement, Mr. Matits’s Series B shares vest in cumulative installments as follows: 10% on the first anniversary, 30% on the second anniversary, 50% on the third anniversary, 75% on the fourth anniversary and 100% on the fifth anniversary of the grant date. In addition, all Series B shares will become immediately vested upon a sale of the company provided Mr. Matits is an employee of our company at the time of such event.
Under Mr. Haynes’s incentive share purchase agreement, Mr. Haynes’s Series B shares vest in cumulative installments as follows: 30% immediately upon grant, 45% on the first anniversary, 60% on the second anniversary, 80% on the third anniversary, 90% on the fourth anniversary and 100% on the fifth anniversary of the grant date. In addition, all Series B shares will become immediately vested upon a sale of the company or upon an initial public offering provided Mr. Haynes is an employee of our company at the time of such event.
Mr. Webb did not receive a grant of Series B shares in 2008.
In connection with our corporate reorganization, our NEO’s will receive 1,283,804 shares of our common stock in exchange for their Series B shares, based upon a price of $15.00 per share, the midpoint of the price range set forth on the cover page of this prospectus.
In addition, in connection with this offering, our board of directors will adopt a new omnibus incentive plan pursuant to which a total of shares of our common stock will be
114
Table of Contents
authorized for issuance. See “— 2009 Omnibus Incentive Plan.” The compensation committee will determine, subject to the employment agreements, any future equity awards that each NEO will be granted pursuant to the 2009 Omnibus Incentive Plan. Shares subject to awards that expire or are cancelled or forfeited, or that are repurchased by us pursuant to the terms of the agreements, will again become available for issuance under the 2009 Omnibus Incentive Plan.
Upon completion of this offering, we intend to issue 282,200, 252,658, 200,000, 110,400, 108,267 and 262,200 shares, in the aggregate, of restricted stock and stock options to Messrs. Labedz, Grazzini, Roberts, Webb, Matits and Haynes, respectively to incentive them to increase shareholder value and to further align management’s goals with our shareholders. Each of these awards will be granted under our omnibus incentive plan, which we plan to adopt in connection with this offering. See “— 2009 Omnibus Incentive Plan.”
Other Executive Benefits and Perquisites
Our NEOs are eligible to receive the same benefits that we provide to other full-time employees, including health and welfare benefits and participation in our 401(k) Savings Plan. In April 2008, we suspended our company match of contributions of our employees participating in our 401(k) Savings Plan. We also provide a select group of management employees, including our NEOs, term life and disability insurance.
We also provide certain of our NEOs with an automobile allowance, a tax gross up for spousal travel and all are eligible to participate in our deferred compensation plan. For 2008, we reimbursed Mr. Haynes for club dues and expenses. In 2009, we expect to continue to provide the same elements of compensation (base salary, perquisites, annual cash incentives and equity-based awards) to our NEOs. In addition, following this offering, we will continue to evaluate our compensation programs in light of our status as a public company.
Employment Agreements and Termination and Change of Control Benefits
Each of our NEOs is party to an employment agreement with us, which agreements were negotiated with the respective NEO and which specify some terms of compensation, including base salary, eligibility for an annual cash bonus and severance payments and benefits. Pursuant to these agreements, each NEO is subject to restrictive covenants, including confidentiality, non-competition and non-solicitation obligations. The employment of each NEO under these agreements will continue in effect until terminated by us or by the NEO. These agreements are intended to assure us of the executive’s continued employment and to provide stability in our senior management team. Upon completion of this offering, Mr. Haynes’s current employment agreement will terminate with us and we intend to enter into a consulting agreement with Mr. Haynes, our Chairman. Mr. Schmitt resigned from his position as our chief financial officer effective March 18, 2008. See “— Potential Payments Upon Termination or Change in Control.”
115
Table of Contents
2008 Summary Compensation Table
The following table sets forth certain information with respect to compensation for the year ended December 31, 2008 earned by, or paid to, our NEOs.
| Name and Principal Position |
Year | Salary ($) |
Bonus ($)(1) |
Stock Awards ($)(2) |
Non-Equity Incentive Plan Compensation ($)(3) |
All Other Compensation ($)(4) |
Total ($) | ||||||||
| Michael J. Labedz President and Chief Executive Officer(5) |
2008 | 381,750 | (6) | — | 178,607 | 187,500 | 20,139 | 767,996 | |||||||
| Brian M. Grazzini Chief Financial Officer(7) |
2008 | 217,709 | — | 112,796 | 237,500 | 9,500 | 577,505 | ||||||||
| Steve Roberts Chief Operating Officer |
2008 | 300,000 | — | 61,854 | 237,500 | 14,744 | 614,098 | ||||||||
| William V.B. Webb Executive Vice President |
2008 | 306,750 | (8) | — | 35,169 | 75,000 | 18,730 | 435,649 | |||||||
| William Matits Senior Vice President — Sales(9) |
2008 | 188,662 | 142,397 | 638 | — | 11,757 | 343,454 | ||||||||
| Patrick J. Haynes, III Chairman Former President and Chief Executive Officer(10) |
2008 | 397,467 | (11) | — | 252,719 | 381,250 | 16,081 | 1,047,517 | |||||||
| Peter Schmitt Former Chief Financial Officer(12) |
2008 | 76,541 | — | — | — | 9,009 | 85,550 |
| (1) | Mr. Matits’s bonus represents commissions on sales. |
| (2) | The amounts reported in this column reflect the aggregate dollar amounts recognized for incentive shares for financial statement reporting purposes for fiscal year 2008 (disregarding any estimate of forfeitures related to service-based vesting conditions) in accordance with SFAS No. 123(R). See note 11 to our audited consolidated financial statements included elsewhere in this prospectus. |
| (3) | Reflects annual performance bonuses earned by the NEO pursuant to their employment agreements and our cash incentive opportunity program. These annual performance bonuses are defined as non-equity incentive plan compensation by the rules and regulations of the SEC. |
| (4) | This column includes 401(k) employer match, term life insurance, disability insurance, automobile allowance and tax gross ups for spousal travel. The amounts included in that column include the following: |
| Name |
401(k) Match(a) |
Term Life Insurance(b) |
Disability Insurance(b) |
Automobile Allowance |
Tax Gross Ups for Spousal Travel | |||||
| Michael J. Labedz |
3,750 | 131 | 1,258 | 15,000 | — | |||||
| Brian M. Grazzini |
— | — | — | 9,500 | — | |||||
| Steve Roberts |
— | — | 3,892 | 9,427 | 1,425 | |||||
| William V.B. Webb |
2,250 | 296 | 1,184 | 15,000 | — | |||||
| William Matits |
— | — | 6,732 | 3,475 | 1,550 | |||||
| Patrick J. Haynes, III |
— | 399 | 682 | 15,000 | — | |||||
| Peter Schmitt |
— | — | 1,885 | — | 7,124 |
| (a) | Our 401(k) Savings Plan match was suspended in April 2008. |
| (b) | Represents premiums paid by us for applicable insurance policies. |
| (5) | Mr. Labedz became our President and Chief Executive Officer effective June 19, 2008. Mr. Labedz previously served as our Vice President. |
| (6) | Includes $3,000 that was paid by us to cover amounts that would have been provided by us from May 2008 through December 2008 if we had not suspended the company match feature of our 401(k) Savings Plan. |
| (7) | Mr. Grazzini became our Chief Financial Officer effective March 18, 2008. |
| (8) | Includes $4,500 that was paid by us to cover amounts that would have been provided by us from May 2008 through December 2008 if we had not suspended the company match feature of our 401(k) Savings Plan. |
| (9) | Mr. Matits’s salary was increased from $190,000 to $200,000 in June 2008. |
| (10) | Mr. Haynes resigned from his position as our President and Chief Executive Officer effective June 19, 2008. |
| (11) | Includes $16,228 received as a Social Security and Medicaid payroll tax reimbursement. |
| (12) | Mr. Schmitt resigned from his position as our Chief Financial Officer effective March 18, 2008. |
116
Table of Contents
2008 Grants of Plan-Based Awards
The following table sets forth certain information with respect to grants of plan-based awards for the year ended December 31, 2008 with respect to the NEOs.
| Estimated Future Payouts Under Non-Equity Incentive Plan Awards(1) |
All Other Stock Awards | |||||||||||
| Name |
Threshold ($) |
Target ($) |
Maximum ($) |
Grant Date |
Number of Shares of Stock or Units (#)(2) |
Grant Date Fair Value of Stock Awards ($)(3) | ||||||
| Michael J. Labedz President and Chief Executive Officer(4) |
187,500 | 187,500 | 187,500 | 12/15/2008 | 2,691,075 | 487,947 | ||||||
| Brian M. Grazzini Chief Financial Officer(5) |
237,500 | 275,000 | 275,000 | 3/31/2008 | 2,800,000 | 508,000 | ||||||
| Steve Roberts Chief Operating Officer |
237,500 | 300,000 | 300,000 | 3/31/2008 12/15/2008 |
1,500,000 1,300,000 |
272,410 235,590 | ||||||
| William V.B. Webb Executive Vice President |
75,000 | 150,000 | 150,000 | — | — | — | ||||||
| William Matits Senior Vice President — Sales |
— | — | — | 12/15/2008 | 600,000 | 109,030 | ||||||
| Patrick J. Haynes, III Chairman Former President and Chief Executive Officer(6) |
381,250 | 381,250 |
381,250 |
12/15/2008 | 3,321,200 | 602,262 | ||||||
| Peter Schmitt Former Chief Financial Officer(7) |
— | — | — | — | — | — | ||||||
| (1) | Reflects estimated future annual cash performance awards earned by the NEOs under our cash incentive opportunity program. The amounts in the “threshold,” “target” and “maximum” columns reflect for each NEO a percentage of base salary for such NEO. Awards are calculated and payable based, in the board of directors discretion, on a comparison between actual EBITDA, as defined in the credit agreement, and the target levels established by Measured EBITDA. For a description of the material terms of these awards, see “— Cash Incentive Awards.” |
| (2) | Messrs. Labedz and Haynes’s Series B shares vest in cumulative installments as follows: 30% immediately upon grant, 45% on the first anniversary, 60% on the second anniversary, 80% on the third anniversary, 90% on the fourth anniversary and 100% on the fifth anniversary of each of their respective grant dates. |
| Messrs. Grazzini, Roberts and Matits’s Series B shares vest in cumulative installments as follows: 10% on the first anniversary, 30% on the second anniversary, 50% on the third anniversary, 75% on the fourth anniversary and 100% on the fifth anniversary of the grant date. |
| (3) | Represents grant date fair value of units calculated in accordance with SFAS No. 123(R). |
| (4) | Mr. Labedz became our President and Chief Executive Officer effective June 19, 2008. Mr. Labedz previously served as our Vice President. |
| (5) | Mr. Grazzini became our Chief Financial Officer effective March 18, 2008. |
| (6) | Mr. Haynes resigned as our President and Chief Executive Officer effective June 19, 2008. |
| (7) | Mr. Schmitt resigned as our Chief Financial Officer effective March 18, 2008. |
117
Table of Contents
Outstanding Equity Awards at 2008 Fiscal Year End
The following table sets forth certain information with respect to outstanding equity awards of our NEOs as of December 31, 2008 with respect to the NEO.
| Number of Shares or Units of Stock That Have Not Vested(#) |
Market Value of Shares or Units of Stock That Have Not Vested($)(1) |
Equity Incentive Plan Awards: Number of Unearned Shares, Units or Other Rights That Have Not Vested(#) |
Equity Incentive Plan Awards: Market or Payout Value of Unearned Shares or Other Rights That Have Not Vested($) | ||||||
| Michael J. Labedz President and Chief Executive Officer(2) |
3,808,753 | 690,813 | — | — | |||||
| Brian M. Grazzini Chief Financial Officer(3) |
2,800,000 | 508,000 | — | — | |||||
| Steve Roberts Chief Operating Officer |
2,800,000 | (4) | 508,000 | — | — | ||||
| William V.B. Webb Executive Vice President |
2,143,750 | (5) | 388,938 | — | — | ||||
| William Matits Senior Vice President —Sales |
600,000 | (6) | 109,030 | — | — | ||||
| Patrick J. Haynes, III Chairman Former President and Chief Executive Officer(7) |
5,824,840 | 1,056,583 | — | — | |||||
| Peter Schmitt Former Chief Financial Officer(8) |
— | — | — | — |
| (1) | There was no public market for the Series B shares as of December 31, 2008. The market value of unvested incentive shares is based upon the fair market value of such incentive shares as of December 31, 2008. The value of the Series B-1 and B-2 shares was $0.26 and $0.15 per-share, respectively. |
| (2) | Mr. Labedz became our President and Chief Executive Officer effective June 19, 2008. Mr. Labedz previously served as our Vice President. Mr. Labedz’s Series B shares vest in cumulative installments as follows: 30% immediately upon grant, 45% on the first anniversary, 60% on the second anniversary, 80% on the third anniversary, 90% on the fourth anniversary and 100% on the fifth anniversary of each of his respective grant dates. |
| (3) | Mr. Grazzini became our Chief Financial Officer effective March 18, 2008. Mr. Grazzini’s Series B shares vest in cumulative installments as follows: 10% on the first anniversary, 30% on the second anniversary, 50% on the third anniversary, 75% on the fourth anniversary and 100% on the fifth anniversary of the grant date. |
| (4) | Mr. Roberts’s Series B shares vest in cumulative installments as follows: 10% on the first anniversary, 30% on the second anniversary, 50% on the third anniversary, 75% on the fourth anniversary and 100% on the fifth anniversary of each of his respective grant dates. |
| (5) | Mr. Webb’s Series B shares vest in cumulative installments as follows: 10% on the first anniversary, 30% on the second anniversary, 50% on the third anniversary, 75% on the fourth anniversary and 100% on the fifth anniversary of the grant date. |
| (6) | Mr. Matits’s Series B shares vest in cumulative installments as follows: 10% on the first anniversary, 30% on the second anniversary, 50% on the third anniversary, 75% on the fourth anniversary and 100% on the fifth anniversary of the grant date. |
| (7) | Mr. Haynes resigned as our President and Chief Executive Officer effective June 19, 2008. Mr. Haynes’s Series B shares vest in cumulative installments as follows: 30% immediately upon grant, 45% on the first anniversary, 60% on the second anniversary, 80% on the third anniversary, 90% on the fourth anniversary and 100% on the fifth anniversary of the grant date. |
| (8) | Mr. Schmitt resigned as our Chief Financial Officer effective March 18, 2008. |
118
Table of Contents
2008 Stock Vested
The following table sets forth certain information with respect to incentive shares vesting during the year ended December 31, 2008 with respect to the NEOs.
| Stock Awards | ||||
| Name |
Number of Shares or Units Acquired on Vesting (#)(1) |
Value Realized on Vesting ($)(2) | ||
| Michael J. Labedz President and Chief Executive Officer(3) |
1,529,198 | 277,353 | ||
| Brian M. Grazzini Chief Financial Officer |
— | — | ||
| Steve Roberts Chief Operating Officer(4) |
— | — | ||
| William V.B. Webb Executive Vice President |
612,500 | 111,125 | ||
| William Matits Senior Vice President — Sales |
— | — | ||
| Patrick J. Haynes, III Chairman Former President and Chief Executive Officer(5) |
2,308,860 | 418,804 | ||
| Peter Schmitt Former Chief Financial Officer(6) |
— | — | ||
| (1) | Messrs. Labedz and Haynes’s Series B shares vest in cumulative installments as follows: 30% immediately upon grant, 45% on the first anniversary, 60% on the second anniversary, 80% on the third anniversary, 90% on the fourth anniversary and 100% on the fifth anniversary of each of their respective grant dates. |
| Mr. Webb’s Series B shares vest in cumulative installments as follows: 10% on the first anniversary, 30% on the second anniversary, 50% on the third anniversary, 75% on the fourth anniversary and 100% on the fifth anniversary of the grant date. |
| (2) | There was no public market for the Series B shares as of December 31, 2008. The market value of unvested incentive shares is based upon the fair market value of such incentive shares as of December 31, 2008. The value of the Series B-1 and B-2 shares was $0.26 and $0.15 per-share, respectively. |
| (3) | Mr. Labedz became our President and Chief Executive Officer effective June 19, 2008. Mr. Labedz previously served as our Vice President. |
| (4) | Mr. Grazzini became our Chief Financial Officer effective March 18, 2008. |
| (5) | Mr. Haynes resigned as our President and Chief Executive Officer effective June 19, 2008. |
| (6) | Mr. Schmitt resigned as our Chief Financial Officer effective March 18, 2008. |
Pension Benefits
In the year ended December 31, 2008, our NEOs did not receive pension benefits and had no accumulated pension benefits.
Nonqualified Deferred Compensation
We have a deferred compensation plan, or Non-Qualified Plan, for certain employees. On January 1, 2008, the Non-Qualified Plan was amended to comply with recently enacted tax law changes. The purpose of this Non-Qualifed Plan is to provide selected management or highly compensated personnel of our company with the opportunity to defer amounts of their compensation which might not otherwise be deferrable under other company plans, including our 401(k) Savings Plan, and to receive the benefits of deferring their compensation, in the absence of certain restrictions and limitations in the federal tax laws. Participants elect the amount of pay they wish to defer and are immediately vested. The Non-Qualified Plan provides for these amounts to be paid upon termination of employment or upon change in ownership of our company. We do not make any contributions to this plan. Voluntary compensation deferrals are held in a Rabbi Trust as that term is defined in the federal tax laws. Distributions of plan contributions and earnings will be made upon termination of employment, disability, retirement or the financial hardship of the participant. In-service benefits are also available to participants.
119
Table of Contents
The following table sets forth information regarding contributions and earnings under our Non-Qualified Plan during fiscal year 2008.
| Name |
Executive Contributions in Last FY ($) |
Registrant contributions in Last FY ($) |
Aggregate Earnings in Last FY ($)(1) |
Aggregate Withdrawals/ Distributions ($) |
Aggregate Balance at Last FYE ($) | ||||||
| Michael J. Labedz President and Chief Executive Officer(2) |
— | — | — | — | — | ||||||
| Brian M. Grazzini Chief Financial Officer(3) |
— | — | — | — | — | ||||||
| Steve Roberts Chief Operating Officer |
— | — | — | — | — | ||||||
| William V.B. Webb Executive Vice President |
— | — | — | — | — | ||||||
| William Matits Senior Vice President — Sales |
7,341 | — | (12,143 | ) | — | 23,113 | |||||
| Patrick J. Haynes, III Chairman Former President and Chief Executive Officer(4) |
— | — | — | — | — | ||||||
| Peter Schmitt Former Chief Financial Officer(5) |
4,709 | — | (2,760 | ) | 344,910 | — |
| (1) | Our deferred compensation plan does not offer above market earnings (as defined by SEC rules). As a result, none of these earnings (losses) are included in the summary compensation table. |
| (2) | Mr. Labedz became our President and Chief Executive Officer effective June 19, 2008. Mr. Labedz previously served as our Vice President. |
| (3) | Mr. Grazzini became our Chief Financial Officer effective March 18, 2008. |
| (4) | Mr. Haynes resigned as our President and Chief Executive Officer effective June 19, 2008. |
| (5) | Mr. Schmitt resigned as our Chief Financial Officer effective March 18, 2008. |
Potential Payments Upon Termination or Change in Control
The information below describes and quantifies certain compensation that would become payable under each NEO’s employment agreement if, as of December 31, 2008, such executive’s employment had been terminated or a change of control had been consummated. Due to the number of factors that affect the nature and amount of any benefits provided upon the events discussed below, any actual amounts paid or distributed may be different. Factors that could affect these amounts include the timing during the year of any such event.
Each of Messrs. Labedz, Grazzini, Roberts, Webb, Matits and Haynes are entitled to payments upon termination of their employment pursuant to their respective employment agreements.
If each of Messrs. Labedz, Grazzini, Roberts, Webb, Matits and Haynes is terminated by us for any reason, including upon a “sale of the company” (with the exception of Messrs. Labedz, Webb and Haynes), other than for cause, as defined in their respective employment agreement, upon the death of the executive, failure to perform on account of disability, or such executive initiates termination due to a material breach of our obligations under the respective employment agreement, each of Messrs. Labedz, Grazzini, Roberts, Webb, Matits and Haynes will be entitled to receive as severance (i) one year’s annual base salary based on the salary in effect at the time of termination and (ii) any family health and dental, life and long-term disability and directors’ and officers’ liability insurance under plans established by the board of directors during the time of such executives’ employment, at the same level as they are provided to our senior management, for a period equal to one year from the date of termination. Any such severance payments paid to each of Messrs. Labedz, Grazzini and Roberts will be paid in 12 consecutive equal monthly installments commencing one month from the termination date, to Messrs. Webb and Haynes in equal monthly installments, and to Mr. Matits over 12 months according to our normal payroll
120
Table of Contents
processing commencing at the termination date, provided that each executive will be required to sign a release of all past, present and future claims against us, ABRY Partners, its affiliates and related companies as a condition to receiving such payments and benefits. Each of Messrs., Grazzini, Roberts and Matits are also entitled to receive these benefits if we elect not to renew the employment agreement.
Mr. Schmitt received no severance payments or benefits under his employment agreement as a result of his voluntary resignation from his position as chief financial officer effective March 18, 2008.
The following table summarizes the potential payments to our NEOs assuming that such events occurred as of December 31, 2008.
| Severance Amounts($) |
Benefit Continuation($) |
Vested Incentive Shares($)(1) |
Accelerated Vesting of Incentive Shares($)(1) |
Total($) | ||||||
| Michael J. Labedz |
||||||||||
| Termination* |
475,000 | 27,250 | 670,259 | — | 1,172,509 | |||||
| Sale of the Company |
— | — | — | 690,813 | 690,813 | |||||
| Brian M. Grazzini |
||||||||||
| Non-renewal or Termination* |
275,000 | 11,605 | — | — | 286,605 | |||||
| Sale of the Company |
— | — | — | 508,000 | 508,000 | |||||
| Steve Roberts |
||||||||||
| Non-renewal or Termination* |
300,000 | 11,605 | — | — | 311,605 | |||||
| Sale of the Company |
— | — | — | 508,000 | 508,000 | |||||
| William V.B. Webb |
||||||||||
| Termination* |
300,000 | 23,248 | 166,688 | — | 489,936 | |||||
| Sale of the Company |
— | — | — | 388,938 | 388,938 | |||||
| William Matits |
||||||||||
| Non-renewal or Termination* |
200,000 | 14,445 | — | — | 214,445 | |||||
| Sale of the Company |
— | — | — | 109,030 | 109,030 | |||||
| Patrick J. Haynes, III |
||||||||||
| Termination* |
475,000 | 22,207 | — | 1,133,179 | 1,630,386 | |||||
| Sale of the Company |
— | — | — | 1,056,583 | 1,056,583 | |||||
| Peter Schmitt |
||||||||||
| Termination* |
— | — | — | — | — |
| * | The term “Termination” in the above table refers to the provisions covering severance and benefit continuation amounts due as a result of termination of the applicable NEO under such NEO’s employment agreement. The term “Non-renewal” refers to the provisions covering severance and benefit continuation amounts due as a result of non-renewal of the applicable NEO’s employment agreement in accordance with the terms of such NEO’s employment agreement. |
| (1) | There was no public market for the Series B shares as of December 31, 2008. The fair market value of unvested incentive shares is based upon the fair market value of such incentive shares as of December 31, 2008. The value of the Series B-1 and B-2 shares was $0.26 and $0.15 shares, respectively. |
Employment Agreements
We have entered into employment agreements with each of our NEOs. We also entered into an employment agreement with Mr. Haynes, who resigned as our President and Chief Executive Officer effective June 19, 2008, and Mr. Schmitt, who resigned as Chief Financial Officer effective March 18, 2008. Upon completion of this offering, we intend to enter into a consulting agreement with Mr. Haynes, our Chairman. Under the respective employment agreement of our NEOs, each is entitled to certain benefits if his employment is terminated or upon other events. See “— Potential Payments Upon Termination or Change in Control.”
121
Table of Contents
Michael J. Labedz
Pursuant to Mr. Labedz’s employment agreement entered into with Companion, our predecessor, effective as of December 29, 2006, as amended on December 30, 2008, Mr. Labedz’s base salary ranges from $300,000 to $475,000, and he is eligible to receive an annual performance bonus in an amount of up to 50% of his annual base salary. Mr. Labedz is eligible to receive benefits including family health and dental, life and long-term disability, director’s and officer’s and key man insurance, four weeks of annual paid vacation, up to $1,250 in monthly automobile allowance and reimbursement of all reasonable out-of-pocket expenses. The term of his agreement expires on December 29, 2011, unless earlier terminated for cause, death, disability or resignation in the event of a material breach of his agreement by us or otherwise with written notice of up to 30 days. In the event Mr. Labedz’s employment terminates for reasons other than for cause, death, disability or resignation, he will be entitled to receive severance payments equal to one year’s salary and continued benefits for one year, including family health and dental, life and long-term disability, and directors’ and officers’ insurance. We may terminate his employment due to physical or mental disability.
Brian M. Grazzini
Pursuant to Mr. Grazzini’s employment agreement entered into with HealthPort Technologies, LLC, our indirect subsidiary, effective as of March 3, 2008, as amended on December 30, 2008, Mr. Grazzini’s annual base salary was $275,000. Mr. Grazzini is eligible to receive an annual performance bonus in an amount of up to 100% of his annual base salary. Mr. Grazzini is also eligible to receive benefits including family health and dental, life and long-term disability, director’s and officer’s and key man insurance, four weeks of annual paid vacation, up to $1,000 in monthly automobile allowance and reimbursement of all reasonable out-of-pocket expenses. The term of Mr. Grazzini’s agreement expires on March 3, 2013, with such terms automatically extending for one-year periods unless we give notice at least 60 days prior to the expiration of the applicable term or earlier terminated for cause, death, disability or resignation in the event of a material breach of his agreement by us or otherwise with written notice of up to 30 days. In the event Mr. Grazzini’s employment terminates for reasons other than for cause, death, disability or resignation, he will be entitled to receive severance payments equal to one year’s salary and continued benefits for one year, including family health and dental, life and long-term disability, and director’s and officer’s insurance. We may terminate his employment due to physical or mental disability.
Steve Roberts
Pursuant to Mr. Roberts’s employment agreement entered into with HealthPort Technologies, LLC, our indirect subsidiary, effective as of September 22, 2008, Mr. Roberts’s annual base salary was $300,000. Mr. Roberts is eligible to receive an annual performance bonus in an amount of up to 100% of his annual base salary. Mr. Roberts has benefits including family health and dental, life and long-term liability, director’s and officer’s insurance, four weeks of annual paid vacation, up to $1,000 in monthly automobile allowance and reimbursement of all reasonable out-of-pocket expenses. The initial term of Mr. Roberts’s agreement expires on September 22, 2013, with such terms automatically extending for one-year periods unless we give notice at least 60 days prior to the expiration of the applicable term or earlier terminated for cause, death, disability or resignation in the event of a material breach of his agreement by us or otherwise with written notice of up to 30 days. In the event Mr. Roberts’s employment terminates for reasons other than for cause, death, disability or resignation, he will be entitled to receive severance payments equal to one year’s salary and continued benefits for one year, including family health and dental, life, long-term disability, and director’s and officer’s insurance. We may terminate his employment due to physical or mental disability.
122
Table of Contents
William V.B. Webb
Pursuant to Mr. Webb’s employment agreement entered into with Companion, our predecessor, effective as of January 15, 2007, as amended on December 23, 2008, Mr. Webb’s base salary ranges from $300,000 to $475,000 and he is eligible to receive an annual performance bonus in an amount of up to 50% of his annual base salary. Mr. Webb is entitled to receive benefits including family health and dental, life and long-term disability, director’s and officer’s and key man insurance, four weeks of annual paid vacation, up to $1,250 in monthly automobile allowance and reimbursement of all reasonable out-of-pocket expenses. The term of his agreement expires on January 15, 2012, unless earlier terminated for cause, death, disability or resignation in the event of a material breach of his agreement by us or otherwise with written notice of up to 30 days. In the event Mr. Webb’s employment terminates for reasons other than for cause, death, disability or resignation, he will be entitled to receive severance payments equal to one year’s salary and continued benefits for one year, including family health and dental, life and long-term disability, and directors’ and officers’ insurance. We may terminate his employment due to physical or mental disability.
William Matits
Pursuant to Mr. Matits’s employment agreement entered into with HealthPort Technologies, LLC, our indirect subsidiary, effective as of January 5, 2009, Mr. Matits’s annual base salary was $200,000. Mr. Matits is eligible to receive commissions based on his executive commission plan and benefits including family health and dental, life and long-term disability, director’s and officer’s and key man insurance, four weeks of annual paid vacation, up to $500 in monthly automobile allowance and reimbursement of all reasonable out-of-pocket expenses. The initial term of Mr. Matits’s agreement expires on January 5, 2014, with such terms automatically extending for one-year periods unless we give notice at least 90 days prior to the expiration of the applicable term or earlier terminated for cause, death, disability or resignation in the event of a material breach of his agreement by us or otherwise with written notice of up to 30 days. In the event Mr. Matits’s employment terminates for reasons other than for cause, death, disability or resignation, he will be entitled to receive severance payments equal to one year’s salary and continued benefits for one year, including family health and dental, life and long-term disability, and directors’ and officers’ insurance. We may terminate his employment due to physical or mental disability.
Patrick J. Haynes, III
Pursuant to Mr. Haynes’s employment agreement entered into with Companion, our predecessor, effective as of December 29, 2006, as amended on December 23, 2008, Mr. Haynes’s base salary ranges from $300,000 to $475,000 and he is eligible to receive an annual performance bonus in an amount of up to 100% of his annual base salary. Mr. Haynes is eligible to receive benefits including family health and dental, life and long-term disability, director’s and officer’s and key man insurance, four weeks of annual paid vacation, up to $1,250 in monthly automobile allowance and reimbursement of all reasonable out-of-pocket expenses. We may terminate his employment due to physical or mental disability. The term of his agreement expires on December 29, 2011, unless earlier terminated for cause, death, disability or resignation in the event of a material breach of his agreement by us or otherwise with written notice of up to 30 days. In the event Mr. Haynes’s employment terminates for reasons other than for cause, death, disability or resignation, he will be entitled to receive severance payments equal to one year’s salary and continued benefits for one year, including family health and dental, life, long-term disability, and directors’ and officers’ insurance. We may terminate his employment due to physical or mental disability. Upon completion of this offering, Mr. Haynes’s employment agreement will terminate
123
Table of Contents
with us and we intend to enter into a consulting agreement with Mr. Haynes, our Chairman. See “Certain Relationships and Related Party Transactions — Consulting Agreement” and “— Employment Agreements.”
Peter Schmitt
Pursuant to Mr. Schmitt’s employment agreement entered into with Smart Document Solutions, LLC, our indirect subsidiary, effective as of January 1, 2007, Mr. Schmitt’s annual base salary was $250,000. Mr. Schmitt was eligible to receive an annual performance bonus in an amount of up to 50% of his annual base salary. Mr. Schmitt’s benefits included family health and dental, life and long-term disability, and director’s and officer’s insurance, four weeks of annual paid vacation and reimbursement of all reasonable out-of-pocket expenses. Mr. Schmitt’s employment agreement terminated when Mr. Schmitt resigned from his position as chief financial officer March 18, 2008.
Non-Competition and Non-Solicitation
As part of their employment agreements, each of our NEOs has entered into non-competition and non-solicitation agreements with us. Pursuant to such agreements, Messrs. Labedz and Webb have agreed not to compete with us for two years following their respective date of termination. Each other NEO has agreed not to compete with us for one year following their respective such executive’s date of termination. In addition, Messrs. Labedz and Webb may not solicit any of our employees during the term of their employment or for two years following such executive’s date of termination. Each other NEO may not solicit any of our employees during the term of his employment or for one year following such executive’s date of termination.
2009 Omnibus Incentive Plan
We intend to adopt the HealthPort, Inc. 2009 Omnibus Incentive Plan, or the 2009 Plan, in connection with our initial public offering. The 2009 Plan provides for grants of stock options, stock appreciation rights, restricted stock, restricted stock units, dividend equivalents, other stock-based awards and other cash-based awards. Directors, officers and other employees of us and our subsidiaries, as well as others performing consulting or advisory services for us, will be eligible for grants under the 2009 Plan. The purpose of the 2009 Plan is to provide incentives that will attract, retain and motivate highly competent officers, directors, employees and consultants by providing them with appropriate incentives and rewards either through a proprietary interest in our long-term success or compensation based on their performance in fulfilling their personal responsibilities. The following is a summary of the material terms of the 2009 Plan, but does not include all of the provisions of the 2009 Plan. For further information about the 2009 Plan, we refer you to the complete copy of the 2009 Plan, which we have filed as an exhibit to the registration statement of which this prospectus is a part.
Administration
The 2009 Plan provides for its administration by the compensation committee of our board of directors, any committee designated by our board of directors to administer the 2009 Plan or our board of directors. Among the committee’s powers are to determine the form, amount and other terms and conditions of awards, clarify, construe or resolve any ambiguity in any provision of the 2009 Plan or any award agreement, amend the terms of outstanding awards and adopt such rules, forms, instruments and guidelines for administering the 2009 Plan as it deems necessary or proper. All actions, interpretations and determinations by the committee or by our board of directors are final and binding.
124
Table of Contents
Shares Available
The 2009 Plan makes available an aggregate of shares of our common stock, subject to adjustments. In the event that any outstanding award expires, is forfeited, cancelled or otherwise terminated without consideration, shares of our common stock allocable to such award, including the unexercised portion of such award, shall again be available for the purposes of the 2009 Plan. If any award is exercised by tendering shares of our common stock to us, either as full or partial payment, in connection with the exercise of such award under the 2009 Plan or to satisfy our withholding obligation with respect to an award, only the number of shares of our common stock issued net of such shares tendered will be deemed delivered for purposes of determining the maximum number of shares of our common stock then available for delivery under the 2009 Plan.
Eligibility for Participation
Members of our board of directors, as well as employees of, and consultants to, us or any of our subsidiaries and affiliates are eligible to receive awards under the 2009 Plan. The selection of participants is within the sole discretion of the committee.
Types of Awards
The 2009 Plan provides for the grant of stock options, including incentive stock options and nonqualified stock options, collectively, options, stock appreciation rights, shares of restricted stock, or restricted stock, restricted stock units, rights to dividend equivalents, other stock-based awards and other cash-based awards, collectively, the awards. The committee will, with regard to each award, determine the terms and conditions of the award, including the number of shares subject to the award, the vesting terms of the award, and the purchase price for the award. Awards may be made in assumption of or in substitution for outstanding awards previously granted by us or our affiliates, or a company acquired by us or with which we combine.
Award Agreement
Awards granted under the 2009 Plan shall be evidenced by award agreements, which need not be identical, that provide additional terms, conditions, restrictions and/or limitations covering the grant of the award, including, without limitation, terms providing for the acceleration of exercisability or vesting of awards in the event of a change of control or conditions regarding the participant’s employment, as determined by the committee in its sole discretion; provided, however, that in the event of any conflict between the provisions of the 2009 Plan and any such award agreement, the provisions of the 2009 Plan shall prevail.
Options
An option granted under the 2009 Plan will enable the holder to purchase a number of shares of our common stock on set terms. Options shall be designated as either a nonqualified stock option or an incentive stock option. An option granted as an incentive stock option shall, to the extent it fails to qualify as an incentive stock option, be treated as a nonqualified option. None of us, including any of our affiliates or the committee, shall be liable to any participant or to any other person if it is determined that an option intended to be an incentive stock option does not qualify as an incentive stock option. Each option shall be subject to terms and conditions, including exercise price, vesting and conditions and timing of exercise, consistent with the 2009 Plan and as the committee may impose from time to time.
125
Table of Contents
The exercise price of an option granted under the 2009 Plan will be determined by the committee and it is expected that the exercise price will not be less than 100% of the fair market value of a share of our common stock on the date of grant, provided the exercise price of an incentive stock option granted to a person holding greater than 10% of our voting power may not be less than 110% of such fair market value on such date. The committee will determine the term of each option at the time of grant in its discretion; however, the term may not exceed ten years or, in the case of an incentive stock option granted to a ten percent stockholder, five years.
Stock Appreciation Rights
A stock appreciation right entitles the holder to receive, upon its exercise, the excess of the fair market value of a specified number of shares of our common stock on the date of exercise over the grant price of the stock appreciation right. The payment of the value may be in the form of cash, shares of our common stock, other property or any combination thereof, as the committee determines in its sole discretion. Stock appreciation rights may be granted alone or in tandem with any option at the same time such option is granted, which we refer to as a tandem SAR. A tandem SAR is only exercisable to the extent that the related option is exercisable and expires no later than the expiration of the related option. Upon the exercise of all or a portion of a tandem SAR, a participant is required to forfeit the right to purchase an equivalent portion of the related option and vice versa. Subject to the terms of the 2009 Plan and any applicable award agreement, the grant price, which is not expected to be less than 100% of the fair market value of a share of our common stock on the date of grant, term, methods of exercise, methods of settlement, and any other terms and conditions of any stock appreciation right shall be determined by the committee. The committee may impose such other conditions or restrictions on the exercise of any stock appreciation right as it may deem appropriate.
Restricted Stock
The committee may, in its discretion, grant awards of restricted stock. Restricted stock may be subject to such terms and conditions, including vesting, as the committee determines appropriate, including, without limitation, restrictions on the sale or other disposition of such shares of our common stock. The committee may require the participant to deliver a duly signed stock power, endorsed in blank, relating to shares of our common stock covered by such an award. The committee may also require that the stock certificates evidencing such shares be held in custody or bear restrictive legends until the restrictions thereon shall have lapsed. Unless otherwise determined by the committee and set forth in the award agreement, a participant holding restricted stock will have the right to vote and receive dividends with respect to such restricted stock.
Dividend Equivalents
The committee may, in its discretion, grant dividend equivalents based on the dividends declared on shares that are subject to any award. The grant of dividend equivalents shall be treated as a separate award. Such dividend equivalents shall be converted to cash or shares by such formula and at such time and subject to such limitations as may be determined by the committee. As determined by the committee, dividend equivalents granted with respect to any option or stock appreciation right may be payable regardless of whether such option or stock appreciation right is subsequently exercised.
Restricted Stock Units
The committee may, in its discretion, grant awards of restricted stock units, or RSUs. RSUs are awards that provide for the deferred delivery of a specified number of shares of our common stock. RSUs may be subject to such terms and conditions, including vesting, as the committee determines appropriate.
126
Table of Contents
Other Stock-Based Awards
The committee, in its discretion, may grant awards of shares of our common stock and awards that are valued, in whole or in part, by reference to, or are otherwise based on the fair market value of, such shares, the other stock-based awards. Such other stock-based awards shall be in such form, and dependent on such conditions, as the committee shall determine, including, without limitation, the right to receive one or more shares of our common stock, or the equivalent cash value of such stock, upon the completion of a specified period of service, the occurrence of an event and/or the attainment of performance objectives. Subject to the provisions of the 2009 Plan, the committee shall determine to whom and when other stock-based awards will be made, the number of shares of our common stock to be awarded under, or otherwise related to, such other stock-based awards, whether such other stock-based awards shall be settled in cash, shares of our common stock or a combination of cash and such shares, and all other terms and conditions of such awards.
Other Cash-Based Awards
The committee, in its discretion, may grant awards payable in cash. Cash-based awards shall be in such form, and dependent on such conditions, as the committee shall determine, including, without limitation, being subject to the satisfaction of vesting conditions or awarded purely as a bonus and not subject to restrictions or conditions. If a cash-based award is subject to vesting conditions, the committee may accelerate the vesting of such award in its discretion.
Transferability
Except as otherwise determined by the committee, an award shall not be transferable or assignable by a participant except in the event of his death (subject to the applicable laws of descent and distribution) and any such purported assignment, alienation, pledge, attachment, sale, transfer or encumbrance shall be void and unenforceable against us or any of our subsidiaries or affiliates. Any permitted transfer of the awards to heirs or legatees of a participant shall not be effective to bind us unless the committee has been furnished with written notice thereof and a copy of such evidence as the committee may deem necessary to establish the validity of the transfer and the acceptance by the transferee or transferees of the terms and conditions of the 2009 Plan and any award agreement.
Stockholder Rights
Except as otherwise provided in the applicable award agreement, a participant has no rights as a stockholder with respect to shares of our common stock covered by any award until the participant becomes the record holder of such shares.
Adjustment of Awards
Notwithstanding any other provision of the 2009 Plan, in the event of any corporate event or transaction such as a merger, consolidation, reorganization, recapitalization, separation, stock dividend, stock split, reverse stock split, split up, spin-off, combination of shares of our common stock, exchange of shares of our common stock, dividend in kind, extraordinary cash dividend, or other like change in capital structure, other than normal cash dividends, to our stockholders, or any similar corporate event or transaction, the committee, to prevent dilution or enlargement of participants’ rights under the 2009 Plan, shall, in its sole discretion, as applicable, (a) adjust the number and kind of shares of stock or other securities that may be issued under the 2009 Plan, the number and kind of shares of our common stock or other securities subject to
127
Table of Contents
outstanding awards, and/or where applicable, the exercise price, base value or purchase price applicable to such awards; (b) grant a right to receive one or more payments of securities, cash and/or property, which right may be evidenced as an additional award under the 2009 Plan, in respect of any outstanding award; or (c) provide for the settlement of any outstanding award, other than a stock option or stock appreciation right, in such securities, cash and/or other property as would have been received had the award been settled in full immediately prior to such corporate event or transaction; provided, however, that in the case of an adjustment made in accordance with (b) or (c) above, the right to any securities, cash and/or property may be issued subject to the same vesting schedule as the outstanding award being adjusted; and provided, further, that any adjustment shall comply with Section 409A of the Internal Revenue Code of 1986, as amended, or the Code, to the extent applicable. Should the vesting of any award be conditioned upon our attainment of performance conditions, our board of directors may make such adjustments to the terms and conditions of such awards and the criteria therein to recognize unusual and nonrecurring events affecting us or in response to changes in applicable laws, regulations or accounting principles.
In the event we are a party to a merger or consolidation or similar transaction, including a change in control, unless otherwise prohibited under applicable law or by the applicable rules and regulations of national securities exchanges or unless the committee determines otherwise in an award agreement, the committee is authorized, but not obligated, to make adjustments in the terms and conditions of outstanding awards, including, without limitation, the continuation or assumption of such outstanding awards under the 2009 Plan by us, if we are the surviving company or corporation, or by the surviving company or corporation or its parent; substitution by the surviving company or corporation or its parent of awards with substantially the same terms for such outstanding awards; accelerated exercisability, vesting and/or lapse of restrictions under all then outstanding awards immediately prior to the occurrence of such event; upon written notice, provided that any outstanding awards must be exercised, to the extent then exercisable, within fifteen days immediately prior to the scheduled consummation of the event, or such other period as determined by the committee, in either case contingent upon the consummation of the event, at the end of which period such awards shall terminate to the extent not so exercised within such period; and cancellation of all or any portion of outstanding awards for fair value, as determined in the sole discretion of the committee, which, in the case of options and stock appreciation rights, may equal the excess, if any, of the value of the consideration to be paid in the change of control transaction to holders of the same number of shares subject to such awards, or, if no such consideration is paid, fair market value of our shares of common stock subject to such outstanding awards or portion thereof being canceled, over the aggregate option price or grant price, as applicable, with respect to such awards or portion thereof being canceled.
Amendment and Termination
Our board of directors may amend, alter, suspend, discontinue, or terminate the 2009 Plan or any portion thereof or any award or award agreement thereunder at any time; provided that no such amendment, alteration, suspension, discontinuation or termination shall be made (i) without stockholder approval if such approval is necessary to comply with any tax or regulatory requirement applicable to the 2009 Plan and (ii) without the consent of the participant, if such action would materially diminish any of the rights of any participant under any award granted to such participant under the 2009 Plan; provided, however, the committee may amend the 2009 Plan, any award or any award agreement in such manner as it deems necessary to permit the granting of awards meeting the requirements of applicable laws.
128
Table of Contents
Compliance with Code Section 409A
To the extent that the 2009 Plan and/or awards are subject to Section 409A of the Code, the committee may, in its sole discretion and without a participant’s prior consent, amend the 2009 Plan and/or awards, adopt policies and procedures, or take any other actions, including amendments, policies, procedures and actions with retroactive effect, as are necessary or appropriate to (a) exempt any award from the application of Section 409A, (b) preserve the intended tax treatment of any such award, or (c) comply with the requirements of Section 409A, Department of Treasury regulations and other interpretive guidance issued thereunder, including without limitation any such regulations or other guidance that may be issued after the date of the grant. The 2009 Plan shall be interpreted at all times in such a manner that the terms and provisions of the 2009 Plan and awards comply with Section 409A and any guidance issued thereunder. Neither we nor the committee has any obligation to take any action to prevent the assessment of any excise tax on any person with respect to any award under Section 409A, and none of us or any of our subsidiaries or affiliates, or any of our employees or representatives, has any liability to a participant with respect thereto.
Effective Date
The 2009 Plan will become effective prior to the completion of this offering.
Indemnification of Officers and Directors
Our amended and restated certificate of incorporation and bylaws will provide that we will indemnify our directors and officers to the fullest extent permitted by Delaware General Corporation Law. Upon completion of this offering, we intend to have in place directors’ and officers’ liability insurance that insures such persons against the costs of defense, settlement or payment of a judgment under certain circumstances.
In addition, our amended and restated certificate of incorporation will provide that our directors will not be liable for monetary damages for breach of fiduciary duty.
In addition, prior to the completion of this offering, we will enter into indemnification agreements with each of our executive officers and directors. The indemnification agreements will provide the executive officers and directors with contractual rights to indemnification, expense advancement and reimbursement, to the fullest extent permitted under the Delaware General Corporation Law.
There is no pending litigation or proceeding naming any of our directors or officers to which indemnification is being sought, and we are not aware of any pending or threatened litigation that may result in claims for indemnification by any director or officer.
129
Table of Contents
SECURITY OWNERSHIP OF CERTAIN BENEFICIAL OWNERS
The following table shows information regarding the beneficial ownership of our common stock (1) immediately prior to and (2) as adjusted to give effect to this offering by:
| • | each person or group who is known by us to own beneficially more than 5% of our outstanding shares of common stock; |
| • | each of our named executive officers; |
| • | each of our directors and each director nominee; and |
| • | all of the executive officers, directors and director nominees as a group. |
For further information regarding material transactions between us and certain of our stockholders, see “Certain Relationships and Related Party Transactions.”
Beneficial ownership for the purposes of the following table is determined in accordance with the rules and regulations of the SEC. These rules generally provide that a person is the beneficial owner of securities if they have or share the power to vote or direct the voting thereof, or to dispose or direct the disposition thereof or have the right to acquire such powers within 60 days. Common stock subject to options that are currently exercisable or exercisable within 60 days of October 15, 2009 are deemed to be outstanding and beneficially owned by the person holding the options. These shares, however, are not deemed outstanding for the purposes of computing the percentage ownership of any other person. Percentage of beneficial ownership is based on 16,509,285 shares of common stock outstanding after giving effect to our corporate reorganization, and 22,509,285 shares of common stock to be outstanding after the completion of this offering, assuming no exercise of the option to purchase additional shares, or 23,409,285 shares, assuming full exercise of the option to purchase additional shares. Except as disclosed in the footnotes to this table and subject to applicable community property laws, we believe that each stockholder identified in the table possesses sole voting and investment power over all shares of common stock shown as beneficially owned by the stockholder. Unless otherwise indicated in the table or footnotes below, the address for each beneficial owner is c/o HealthPort, Inc., 925 North Point Parkway, Suite 350, Alpharetta, Georgia 30005.
| Shares Beneficially Owned Prior to This Offering(1) |
Number of Shares Offered |
Shares Beneficially Owned After This Offering(2) | ||||||||
| Name |
Number | Percent | Number | Percent | ||||||
| 5% Stockholders: |
||||||||||
| Funds affiliated with ABRY Partners(3) 111 Huntington Ave., 30th Floor Boston, MA 02199 |
12,625,382 | 76.5 | — | 12,625,382 | 56.1 | |||||
| Executive Officers and Directors: |
||||||||||
| Patrick J. Haynes, III(4) |
783,550 | 4.7 | — | 783,550 | 3.5 | |||||
| Michael J. Labedz |
555,178 | 3.4 | — | 555,178 | 2.5 | |||||
| Brian M. Grazzini |
15,586 | * | — | 15,586 | * | |||||
| Steve Roberts |
8,360 | * | — | 8,360 | * | |||||
| William V.B. Webb |
287,876 | 1.7 | — | 287,876 | 1.3 | |||||
| William Matits |
— | * | — | — | * | |||||
| Gene Guertin |
836 | * | — | 836 | * | |||||
| Jay M. Grossman(5) |
12,625,382 | 76.5 | — | 12,625,382 | 56.1 | |||||
| Erik Brooks(5) |
12,625,382 | 76.5 | — | 12,625,382 | 56.1 | |||||
| Hilary K. Grove(5) |
12,625,382 | 76.5 | — | 12,625,382 | 56.1 | |||||
| Harry S. Bennett |
— | * | — | — | * | |||||
| Jack Langer |
— | * | — | — | * | |||||
| All executive officers and directors as a group (12 persons) |
14,276,768 | 86.5 | — | 14,276,768 | 63.5 | |||||
130
Table of Contents
| * | Represents beneficial ownership of less than one percent (1%) of our outstanding common stock. |
| (1) | Shares shown in the table above include shares held in the beneficial owner’s name or jointly with others, or in the name of a bank, nominee or trustee for the beneficial owner’s account. |
| (2) | Beneficial ownership does not include any shares that may be purchased in this offering, including in the directed share program or any of the shares of restricted stock and stock options that will be issued upon completion of this offering. See “Underwriting.” |
| (3) | Includes 225,746 shares of common stock held by ABRY Partners V Affiliated Investors, L.P., 9,763,534 shares of common stock held by ABRY Partners Fund V, L.P., 384,264 shares of common stock ABRY Senior Equity II, L.P., 31,084 shares of common stock ABRY Senior Equity II-A, L.P., 15,909 shares of common stock ABRY Senior Equity Co-Investment Fund, L.P., 2,198,807 shares of common stock ABRY Partners VI, L.P. and 6,038 shares held by ABRY Investment Partnership, L.P. The address of the funds affiliated with ABRY Partners is 111 Huntington Avenue, 30th Floor, Boston, MA 02199. |
| (4) | Mr. Haynes, our Chairman, is the sole manager of Waveland, LLC. |
| (5) | ABRY Partners, LLC is a service provider to which certain investment advisory and management functions have been delegated by the general partners of each of ABRY Partners V Affiliated Investors, L.P., ABRY Partners V, L.P., ABRY Senior Equity II, L.P., ABRY Senior Equity II-A, L.P., ABRY Senior Equity Co-Investment Fund, L.P., ABRY Investment Partnership, L.P. and ABRY Partners VI, L.P., which we collectively refer to as the ABRY Funds. The managing partners of ABRY Partners, LLC provide investment advisory and management services pursuant to which the general partners of the ABRY Funds make voting and investment decisions with respect to the securities held by the ABRY Funds. The managing partners of ABRY Partners, LLC and the ABRY Funds are a “group” within the meaning of Rule 13d-5 promulgated under the Securities Exchange Act of 1934, as amended, and may be deemed to beneficially own an aggregate of 12,625,382 shares of our common stock, which represents 76.5 % of the outstanding shares of our common stock. Mr. Grossman, one of our directors, holds the title of managing partner of ABRY Partners, LLC. Mr. Grossman disclaims beneficial ownership of such shares beneficially owned by him except to the extent of his pecuniary interest therein. In addition, Mr. Brooks, a partner of ABRY Partners, LLC, and Ms. Grove, a principal of ABRY Partners, LLC, each disclaim beneficial ownership of such shares owned by ABRY Partners, LLC, except to the extent he or she has a pecuniary interest therein. The address for Messrs. Grossman and Brooks and Ms. Grove is 111 Huntington Avenue, 30th Floor, Boston, MA 02199. |
131
Table of Contents
CERTAIN RELATIONSHIPS AND RELATED PARTY TRANSACTIONS
General
Under our code of business conduct and ethics, our employees, officers and directors are discouraged from entering into any transaction that may cause a conflict of interest for us. In addition, they must report any potential conflict of interest, including related party transactions, to their managers or our general counsel who then reviews and summarizes the proposed transaction for our audit committee. Pursuant to its charter, our audit committee must then approve any related-party transactions, including those transactions involving our directors. In approving or rejecting such proposed transactions, the audit committee considers the relevant facts and circumstances available and deemed relevant to the audit committee, including the material terms of the transactions, risks, benefits, costs, availability of other comparable services or products and, if applicable, the impact on a director’s independence. Our audit committee will approve only those transactions that, in light of known circumstances, are in, or are not inconsistent with, our best interests, as our audit committee determines in the good faith exercise of its discretion. A copy of our code of business conduct and ethics and audit committee charter may be found at our corporate website www.healthport.com upon completion of this offering.
Members Agreement
On September 22, 2008, we entered into an amended and restated members agreement with our limited liability company members, which governs our management, ownership and transfer of shares. Upon completion of our corporate reorganization and this offering, the Members Agreement will terminate and be of no further force or effect.
Under the Members Agreement, each member must vote all of its member shares entitled to vote, and all member shares over which it has voting control, to cause the membership of the board of directors to be comprised of five managers, including (i) two directors designated by the ABRY Partners investors, (ii) one director designated by the holders of Series C shares, so long as the senior preferred shares are outstanding, and (iii) two directors designated by management investors.
Subject to certain exceptions, members are restricted from transferring their shares under the Members Agreement. No member may transfer shares unless approved in advance by the directors elected by the ABRY Partners investors, except for transfers to permitted transferees, pursuant to incentive share purchase agreements or upon a sale of the company. Members also have participation rights allowing them to participate in the proposed transfer on the same terms as the proposed transferee. ABRY Partners investors have a limited first offer right on shares held by new mezzanine investors allowing them to make an offer to purchase all of the shares proposed to be transferred.
If a majority of the outstanding shares held by ABRY Partners investors approve a bona fide sale of our company to a person that is not an affiliate of ABRY Partners or an ABRY Partners investor, then each member is obligated to consent and raise no objections to the approved company sale.
Under the Members Agreement, the restrictions on transfer of shares terminate upon the consummation of a qualified public offering with a value greater than $50 million. In addition, members must take all necessary actions in connection with an underwritten public offering, and cooperate to preserve the rights and preferences described in the CT Technologies Holdings, LLC Agreement, the investor securities purchase agreements, the incentive share purchase agreements and the registration rights agreement. Following the issuance of common
132
Table of Contents
stock to management investors in connection with a public offering and until such time as the ABRY Partners investors have received their aggregate net cash proceeds from distributions under the CT Technologies Holdings, LLC Agreement, no management investor may transfer any common stock in a public sale except if such management investor sells his shares on a pro rata basis with ABRY Partners investors in such sales. Members may not effect any public sale or distribution of shares during (i) the seven days prior to and the 180-day period beginning on the effective date of an initial public offering or (ii) during the seven days prior to and the 90-day period beginning on the effective date of any subsequent public offering. Under the Members Agreement, subject to certain exceptions, if we authorize the issuance or sale of any of our equity securities, we must offer to sell to each member who holds Series A shares or Series C shares a portion of such equity securities in amounts equal to a formula described in the Members Agreement. Each of the members eligible to participate will be entitled to purchase such equity securities to be offered on the most favorable terms and price as are offered to other persons.
CT Technologies Holdings, LLC Agreement
On September 22, 2008, we and our members entered into the CT Technologies Holdings, LLC Agreement, which governs our operations. Upon completion of our corporate reorganization and this offering, we will be converted into a Delaware corporation and the CT Technologies Holdings, LLC Agreement will terminate and be of no further force or effect.
The CT Technologies Holdings, LLC Agreement sets forth the rights relating to the Series A shares, Series B shares, Series C shares and senior preferred shares. Members are entitled to one vote per point associated with their Series A, B or C shares. The Series A shares receive a fixed amount of points per share and the Series B-1 shares, Series B-2 shares and Series C shares each receive points pursuant to formulae set forth in the CT Technologies Holdings, LLC Agreement. Repurchased or cancelled Series B shares or Series A shares repurchased pursuant to each investor securities purchase agreement are deemed outstanding and held by us or a member, as applicable. Any unvested Series B share that is forfeited and cancelled under an incentive share agreement is no longer deemed to be outstanding under the CT Technologies Holdings, LLC Agreement.
In connection with our corporate reorganization, the Series A and C shares will be exchanged for 15,088,841 shares of our common stock based upon a price of $15.00 per share, the midpoint of the range set forth on the cover of this prospectus. The number of shares of our common stock issued in connection with our corporate reorganization will not be adjusted based on the actual public offering price of our common stock. In addition, any outstanding Series B-1 and B-2 shares that have vested on or prior to the closing of this offering will be converted into shares of our common stock based upon a share price of $15.00 per share, the midpoint of the range set forth on the cover of this prospectus. The number of shares of our common stock issued in connection with our corporate reorganization will not be adjusted based on the actual initial offering price of our common stock. Holders of unvested Series B-1 and B-2 shares will not receive any consideration in connection with the corporate reorganization. Upon completion of this offering, we intend to issue 146,398 shares of restricted stock and stock options to exercise 2,036,200 shares of common stock to our directors and director nominees and certain other officers and key employees. See “— Incentive Share Purchase Agreements.” In accordance with the CT Technologies Holdings, LLC Agreement, the final allocation of shares among the classes of outstanding shares of CT Technologies Holdings, LLC will be based upon the distribution process as set forth in the CT Technologies Holdings, LLC Agreement.
133
Table of Contents
We may make distributions to our members in accordance with the terms of the CT Technologies Holdings, LLC Agreement in the sole discretion of the board of directors. We will not distribute cash in connection with our corporate reorganization. Prior to the effectiveness of this registration statement, we will exchange our common stock or senior preferred stock, as applicable, for Series A, B and C shares and senior preferred shares in accordance with the following priority:
(i) first, to senior preferred shares, pro rata based on the aggregate number of points represented by the senior preferred shares held by each holder until the entire amount of the unreturned capital value of all senior preferred shares is paid in full;
(ii) second, to the senior preferred shares, pro rata, based on the aggregate number of points represented by the senior preferred shares held by each holder until the entire amount of the unpaid yield of all senior preferred shares is paid in full;
(iii) third, to the Series A and Series C holders, pro rata to each group, based on the aggregate number of points represented by the Series A shares and Series C shares, respectively, up to the entire amount of the unreturned capital value of all outstanding Series A shares;
(iv) fourth, to the Series A and Series C holders, pro rata to each group, based on the aggregate number of points represented by the Series A shares and Series C shares, respectively, up to the entire amount of the unpaid yield on all outstanding Series A shares;
(v) fifth, to the Series A, B-1 and C shares, pro rata to each group, on the basis of the number of points represented by the Series A, B-1 and C shares owned, until the aggregate distributions given to the holders of Series A shares equals the aggregate capital value of the Series A shares plus 30% per year return on the unreturned capital value for the Series A shares; and
(vi) finally, a pro rata distribution will be made of the remaining shares to the Series A, B-1, B-2, and C shares, pro rata among each, on the basis of the number of points owned by each.
The CT Technologies Holdings, LLC Agreement includes indemnification provisions by us in favor of the directors and officers, as well as customary transfer restriction provisions.
Under the CT Technologies Holdings, LLC Agreement, our items of income, gain, loss or deduction generally will be allocated among the members for capital account purposes and for tax purposes in a manner that results in the capital account balance of each member, immediately after making the allocation, being as nearly as possible equal to the amount of the distributions that would be made to the member if we sold all of its assets for cash and distributed its net assets in liquidation.
We may be dissolved only upon sale of all or substantially of our assets, election by the majority of the members or by decree of judicial dissolution. Upon liquidation, a board-appointed liquidator will liquidate our assets and distribute the proceeds on the following order of priority, (i) repayment of debts and obligations to creditors, (ii) establishment of any reserves the board deems appropriate, and (iii) to members in accordance with distribution priorities set forth above.
A permitted transferee will succeed in the capital account associated with such transferred shares and will share and receive allocations and distributions. Any member who transfers all of his or its shares shall cease to be a member upon such transfer. A transferee of shares may be admitted as a member by executing and delivering a joinder to the CT Technologies Holdings, LLC Agreement to the secretary. No member may transfer restricted shares without first delivering to us an opinion of counsel that registration under the Securities Act is not required in connection with such transfer. We may not issue or transfer shares if it would require our
134
Table of Contents
company to register under the Investment Company Act of 1940, or would cause our company to have more than 100 partners, or would change the legal status of our company as a limited liability company or for federal income tax purposes as partnership.
Registration Rights Agreement
On December 29, 2006, we entered into a registration rights agreement, as amended and restated on September 22, 2008, which we refer to as the registration rights agreement, with all of our holders of equity securities, other than the senior preferred shares.
At any time, the holders of a majority of the registrable shares relating to Series A shares, and, after an initial public offering, holders of a majority of registrable shares relating to certain mezzanine investors, may demand that we register all or a portion of their registrable shares for sale under the Securities Act. These holders are entitled to a specified number of demands in accordance with the conditions and limitations set forth in the registration rights agreement, and provided that the aggregate value of registrable shares to be offered is at least $5.0 million.
The registration rights agreement also provides holders of registrable shares with piggyback registration rights such that if we propose to file a registration statement in connection with a public offering of common stock, with certain limited exceptions, we are required to give prompt written notice of such proposed filing to all holders of registrable shares and register such number of securities as the holders of registrable shares may request in writing within 20 days of receiving such notice. Subject to the Members Agreement, the piggyback registration rights are subject to certain specified priorities. In addition, the holders of a majority of the registrable shares relating to the Series A shares will have the right to select the investment bankers and managers to administer the offering relating to any demand registration or piggyback registration requested by such holders.
In connection with any registration effected pursuant to the terms of the registration rights agreement, we will be required to pay for all of the fees and expenses incurred in connection with such registration. However, the underwriting discounts and selling commissions payable in respect of registrable securities included in any registration will be paid by the persons including such registrable securities in any such registration. The registration rights agreement also contains customary cross-indemnification provisions.
In connection with our corporate reorganization, we will enter into a contribution agreement with each of the holders of our Series A, B, C and senior preferred shares pursuant to which each member will contribute all of its equity interests in CT Technologies Holdings, LLC to us in return for shares of our common stock and senior preferred stock, as applicable. The contribution agreement further provides that we will assume all of the obligations of our predecessor, CT Technologies Holdings, LLC, under the registration rights agreement and agree to be bound by the terms thereof. In addition, the contribution agreement provides that each holder irrevocably waives its piggyback registration rights to the extent such rights would otherwise apply to this offering.
Incentive Share Purchase Agreements
We have entered into various incentive share purchase agreements with various former and current directors, executive officers and management employees, and certain entities controlled by such individuals, which we refer to collectively as the executives, pursuant to which we granted Series B shares to the executives. Upon completion of our corporate reorganization, the incentive share purchase agreements will terminate and be of no further force or effect.
135
Table of Contents
Under the incentive share purchase agreements, an executive’s Series B shares vest incrementally over a five or six year period beginning on the effective date of such executive’s incentive share purchase agreement and in accordance with the percentages set forth in the executive’s incentive share purchase agreement.
Upon a sale of the company, as defined in such executive’s incentive share purchase agreement, all of the shares will become vested immediately, assuming the executive was employed by us at the time of the sale. The incentive share purchase agreements entered into with Waveland LLC, an entity controlled by Mr. Haynes, and Michael Labedz explicitly provide for accelerated vesting of their shares upon an initial public offering, as defined in such executive’s incentive share purchase agreement, subject to the provisions covering initial public offerings in the Members Agreement.
If an executive ceases to be employed by us prior to a sale of the company or initial public offering in the case of Messrs. Haynes and Labedz, as applicable, then vesting ceases upon such termination, and all unvested shares held by the executive as of the date of termination expire and are immediately forfeited and cancelled and are no longer deemed outstanding under the CT Technologies Holdings, LLC Agreement. Any vested shares held by the executive as of the date of termination are subject to repurchase by us at a price equal to the board of director’s determination of fair market value of the vested shares, unless the executive is terminated for cause, as defined in such executive’s incentive share purchase agreement, in which case each vested share expires and is immediately forfeited and cancelled. In addition, ABRY Partners has the option to purchase any or all vested shares held by an executive that are not repurchased by us. The repurchase provisions under the incentive share purchase agreements terminate upon sale of the company or upon a qualified public offering, which includes this offering.
Subject to certain exceptions, an executive may only transfer vested shares in accordance with the Members Agreement or the repurchase provisions of the executive’s incentive share purchase agreement, and transfers permitted by the Members Agreement or such provisions also require prior written consent of the board of directors.
Securities Purchase Agreement
We entered into an amended and restated securities purchase agreement on September 22, 2008, with affiliated funds of ABRY Partners and Ares Capital Corporation, which we refer to as the securities purchase agreement, pursuant to which we sold senior preferred shares and Series C shares to ABRY Senior Equity II, L.P. and its affiliates and Ares Capital Corporation.
The senior preferred shares may be redeemed, at our option, in whole or in part, at any time after June 15, 2009. Upon optional redemption, the redemption price per share will be the liquidation value, equal to the unreturned capital value plus the unpaid yield of each senior preferred shares, in addition to the applicable percentage of the liquidation value with respect to each senior preferred shares to be redeemed. The applicable additional redemption amounts are (i) if on or after June 15, 2009, but prior to June 15, 2010, 4% of the liquidation value, (ii) if on or after June 15, 2010, but prior to June 15, 2011, 2% of the liquidation value, and (iii) if after June 15, 2011, zero.
The senior preferred shares are subject to mandatory redemption by us in whole on September 22, 2014, at an amount equal to the liquidation value of the senior preferred shares. The holders of Series C shares may, upon written notice to us, require that we purchase all or any part of the Series C shares at fair market value on or after September 22, 2014. Upon completion of this offering, all Series C shares will be exchanged for shares of common stock.
136
Table of Contents
Holders of senior preferred shares may demand that we redeem their shares upon a change of control, as defined in the securities purchase agreement. We must provide notice of a change of control to each holder of senior preferred shares not less than 35 days prior to the occurrence of any change in control.
The redemption rights of the holders of the senior preferred shares are subordinated to the indebtedness outstanding under the senior secured credit facility and the senior subordinated notes, unless expressly permitted by the agreements governing of the senior secured credit facility or senior subordinated notes.
As a result of the corporate reorganization, the senior preferred shares will be exchanged for shares of our senior preferred stock, which will have substantially similar preferences, powers, rights, limitations and restrictions as the senior preferred shares, as will be set forth in an Investors Rights Agreement, which will terminate and be of no further force or effect upon completion of this offering, and our amended and restated charter. We intend to use a portion of the net proceeds from this offering for the redemption in whole of our senior preferred stock.
Investor Securities Purchase Agreements
In connection with our acquisition of Companion Technologies, on December 29, 2006, we issued Series A shares to certain of its affiliated funds of ABRY Partners, Mr. Labedz, Mr. Webb, Waveland, LLC, an entity controlled by Mr. Haynes and W.C.M II, LLC, an entity controlled by William C. McNitt, pursuant to an investor securities purchase agreement, which we refer to as the investor securities purchase agreement. Under the terms of this original investor securities purchase agreement, in connection with an acquisition approved by us, ABRY Partners made a commitment to make additional investments, subject to a cap of $40 million. Further, the Series A shares held by the executive officers party to the investor securities purchase agreement are subject to repurchase by us and ABRY Partners when such executive officers cease to be employed by us or any of our subsidiaries in accordance with the investor securities purchase agreement.
In connection with the acquisition of SDS, on June 15, 2007, we entered into a second investor securities purchase agreement. In accordance with the terms of the investor securities purchase agreement and the preemptive rights provisions of the Members Agreement, additional Series A shares were purchased by ABRY Partners, Waveland, LLC, Mr. Webb and Ares Capital Corporation. ABRY Partners investment in additional Series A shares reduced their $40 million purchase commitment under their investor securities purchase agreement.
In connection with our acquisition of ChartOne, on September 22, 2008, we entered into a third investor securities purchase agreement. In accordance with the terms of the investor securities purchase agreement and the preemptive rights provisions of the Members Agreement, additional Series A shares were purchased by certain new mezzanine investors that became members under the Members Agreement. ABRY Partners invested in additional Series A shares, which satisfied in full their capital commitment. ABRY Partners has no further obligation to purchase Series A shares pursuant to any agreement.
Under each of the investor securities purchase agreements, our rights and ABRY Partners’ right to repurchase Series A shares terminates upon this initial public offering in accordance with the Members Agreement.
Services Agreement
We and Thurston Group, an entity controlled by Mr. Haynes, our Chairman, will enter into a transitional services agreement whereby Thurston Group will agree to provide us with business development services and various corporate support services, including, among other things,
137
Table of Contents
office space for Messrs. Haynes, Labedz, and certain other employees at Thurston Group, as well as telephone, information technology services and support, payroll administration, accounts payable processing, travel assistance and mail services for these individuals and Mr. Webb, our Executive Vice President. Thurston Group may also may provide us with additional services that we and Thurston Group may identify from time to time in the future. The services agreement will become operative on the effective date of the registration statement and the services will continue until terminated by us or Thurston Group upon 30 days written notice.
The cost of the transitional services agreement in the aggregate will be consistent with general and administrative expenses that we have historically allocated or incurred with respect to the services. The pricing will be reviewed yearly and any changes will be mutually agreed to by us and Thurston Group.
The terms of the transitional services agreement, including the fees charged for the services, are substantially similar to those that would be agreed to by parties bargaining at arm’s length for similar services. We believe the payments we will make to Thurston Group are reasonable. However, these payments are not necessarily indicative of, and it is not practical for us to estimate, the level of expenses we might incur in procuring these services from alternative sources. A form of the transitional services agreement will be filed as an exhibit to the registration statement of which this prospectus forms a part.
Corporate Reorganization
We are a newly formed Delaware corporation that has not, to date, conducted any activities other than those incident to our formation and the preparation of this registration statement. We were formed solely for the purpose of reorganizing the organizational structure of CT Technologies Holdings, LLC in order for the registrant to be a corporation rather than a limited liability company.
As a result of the corporate reorganization, CT Technologies Holdings, LLC’s Series A and C shares will be exchanged for 15,088,841 shares of our common stock based upon a price of $15.00 per share, the midpoint of the range set forth on the cover page of this prospectus. In addition, any outstanding Series B-1 and B-2 shares that have vested on or prior to the closing of this offering will be exchanged for 1,420,445 shares of our common stock based upon a price of $15.00 per share, the midpoint of the range set forth on the cover page of this prospectus. The number of shares of our common stock issued in connection with our corporate reorganization will not be adjusted based on the actual initial public offering price of our common stock. Holders of unvested Series B-1 and B-2 shares will not receive any consideration in connection with the corporate reorganization. Upon completion of this offering, we intend to issue 146,398 shares of restricted stock and stock options to exercise 2,036,200 shares of common stock to our directors and director nominees and certain officers and key employees. Shares of CT Technologies Holdings, LLC’s senior preferred shares will be exchanged for shares of our senior preferred stock prior to effectiveness of this registration statement. The senior preferred stock will have substantially similar preferences, powers, rights, limitations and restrictions as the senior preferred shares as will be set forth in an Investor Rights Agreement and our amended and restated charter. We intend to use a portion of the net proceeds from this offering for the redemption in whole of our senior preferred stock. In addition, our amended and restated certificate of incorporation will become effective. The corporate reorganization will not affect our operations, which we will continue to be conducted through our operating subsidiaries. See “Corporate Reorganization” and “Description of Capital Stock — Senior Preferred Stock.”
Board Compensation
Upon completion of this offering, directors who are our employees or employees of our subsidiaries or affiliated with ABRY Partners will not receive any compensation for their service
138
Table of Contents
as members of either our board of directors or board committees. All non-employee members of our board of directors not affiliated with ABRY Partners will be compensated as set forth under “Management — Corporate Governance — Director Compensation.”
Employment Agreements
We have entered into employment agreements with each of our named executive officers. For more information regarding these agreements, see “Executive Compensation — Employment Agreements” and “— Potential Payments Upon Termination or Change in Control.”
Indemnification Agreements
We intend to enter into indemnification agreements with each of our current directors and executive officers. These agreements will require us to indemnify these individuals to the fullest extent permitted under Delaware law against liabilities that may arise by reason of their service to us, and to advance expenses incurred as a result of any proceeding against them as to which they could be indemnified. We also intend to enter into indemnification agreements with our future directors and executive officers.
Consulting Arrangements
We are a party to a consulting arrangement with Haynes, LLC to provide consulting services to us. Mr. Haynes, our Chairman, is the sole member, officer and manager of Haynes, LLC. We are also party to an expense-sharing arrangement with Thurston Group, an entity controlled by Mr. Haynes, whereby we reimburse Thurston Group for various corporate services including rent and certain administrative and clerical services. For the period from January 1, 2006 through December 31, 2006 and for the years ended December 31, 2007 and 2008, we paid fees to these entities totaling approximately $0, $587,000 and $808,000, respectively.
Upon completion of our corporate reorganization, we intend to enter into a consulting agreement with Mr. Haynes, our Chairman, to provide consulting services relating to strategic planning and other advisory services. As consideration for such services, Mr. Haynes is currently expected to be paid an annual fee ranging from $276,000 to $451,000 depending on the achievement of certain Measured EBITDA targets and a monthly automobile allowance of $1,250. We have also agreed to indemnify Mr. Haynes from and against any claim by any person with respect to his activities as Chairman. Mr. Haynes will be subject to restrictive covenants, including confidentiality, non-competition and non-solicitation obligations.
Loans to our Chairman
During 2008, Mr. Haynes, our Chairman, issued promissory notes in aggregate principal amount of $1,075,000 to us. In October 2008, we purchased approximately 2,178 of our Series A shares from Waveland, LLC, an entity controlled by Mr. Haynes. The consideration paid to Waveland, LLC for the Series A shares was approximately $480,000 in cash and an assignment of four promissory notes issued to us by Mr. Haynes in aggregate principal amounts of $750,000 plus approximately $20,000 in accrued interest. As of December 31, 2008, one promissory note remained outstanding in aggregate principal amount of $325,000. The promissory notes were due and payable on the earlier of (i) the termination of the employee, (ii) a sale of the company, (iii) an initial public offering or (iv) January 31, 2009. In January 2009, we agreed to extend the outside maturity date of the promissory note to January 31, 2010. Interest accrued on the outstanding principal amount of the promissory notes at a per annum rate equal to the greater of (i) the effective rate as defined below or (ii) the applicable federal rate (as defined below). The term effective rate means (i) the weighted average interest rate effectively paid on a per annum basis by us with respect to the interest rates under our senior secured credit facility plus (ii)
139
Table of Contents
0.50%. The term applicable federal fate means the applicable federal rate for short-term transactions, as published by the Internal Revenue Service from time to time, which initially shall be 0.76% until December 31, 2009. Interest on the promissory notes accrued at 9.12% for the year ended December 31, 2008.
In May 2009, Mr. Haynes, our Chairman, issued two additional promissory notes to us in aggregate principal amount of $500,000, resulting in an aggregate principal amount outstanding of $825,000 as of June 30, 2009. The terms and conditions of these promissory notes, including the interest rate, were substantially similar to the terms and conditions of the promissory notes discussed above. The effective interest rate for the six months ended June 30, 2009 was 9.16%.
On August 14, 2009, we repurchased approximately 911 of our Series A shares from Mr. Haynes for approximately $862,452 in cash. In addition, if this offering is completed by February 14, 2010, we have agreed to provide Mr. Haynes with the right to receive additional shares of our common stock in an aggregate amount equal to the difference between the purchase price per share we paid for his Series A shares on August 14, 2009, as appropriately adjusted in accordance with the corporate reorganization discussed elsewhere in this prospectus, and the price per share of this offering. See “Corporate Reorganization.” Mr. Haynes used these cash proceeds to repay all outstanding amounts due to us under the promissory notes.
140
Table of Contents
The following is a description of the material terms of our amended and restated certificate of incorporation and bylaws as they will be in effect following our corporate reorganization and upon completion of this offering. They may not contain all of the information that is important to you. To understand them fully, you should read our amended and restated certificate of incorporation and bylaws, copies of which are filed with the SEC as exhibits to the registration statement of which this prospectus is a part.
Authorized Capitalization
Our authorized capital stock consists of shares of common stock, par value $0.001 per share, and shares of preferred stock, par value $0.001 per share. Immediately following the completion of this offering, 22,509,285 shares of common stock, or 23,409,285 shares if the underwriters exercise their option to purchase additional shares in full, will be outstanding, and no shares of preferred stock will be outstanding. We intend to use a portion of the net proceeds from this offering for the redemption in whole of our senior preferred stock.
Common Stock
Voting Rights
Each share of common stock entitles the holder to one vote with respect to each matter presented to our stockholders on which the holders of common stock are entitled to vote. Our common stock votes as a single class on all matters relating to the election and removal of directors on our board of directors and as provided by law. Holders of our common stock will not have cumulative voting rights. Except in respect of matters relating to the election and removal of directors on our board of directors and as otherwise provided in our amended and restated certificate of incorporation or required by law, all matters to be voted on by our stockholders must be approved by a majority of the shares present in person or by proxy at the meeting and entitled to vote on the subject matter. In the case of election of directors, all matters to be voted on by our stockholders must be approved by a plurality of the votes entitled to be cast by all shares of common stock.
Dividend Rights
Holders of our common stock are entitled to receive ratably such dividends as may be declared by our board of directors out of funds legally available therefor. We also may not pay dividends on our capital stock if we are in default or have elected to defer payments of interest under our senior secured credit facility or our senior subordinated notes. The declaration and payment of future dividends to holders of our common stock will also depend upon our earnings and financial condition, the capital requirements of our subsidiaries and other factors as our board of directors may deem relevant. See “Dividend Policy.”
Liquidation Rights
In the event of any voluntary or involuntary liquidation, dissolution or winding up of our affairs, holders of our common stock would be entitled to share ratably in our assets that are legally available for distribution to stockholders after payment of liabilities. If we have any preferred stock outstanding at such time, holders of the preferred stock may be entitled to distribution and/or liquidation preferences. In either such case, we must pay the applicable distribution to the holders of our preferred stock before we may pay distributions to the holders of our common stock.
141
Table of Contents
Board Rights
Our amended and restated certificate of incorporation provides that, following the completion of this offering, ABRY Partners will be entitled to appoint a majority of the members of our board of directors. Holders of our common stock will be entitled to vote on all nominees for election as directors.
Other Rights
Our stockholders have no preemptive or other rights to subscribe for additional shares. All outstanding shares are, and all shares offered by this prospectus will be, when sold, validly issued, fully paid and nonassessable.
Registration Rights
Certain stockholders will have registration rights with respect to our common stock, including our largest stockholder, ABRY Partners. For further information regarding these registration rights, please see “Certain Relationships and Related Party Transactions — Registration Rights Agreement.”
Listing
We have applied to have our common stock approved for listing on The NASDAQ Global Market under the symbol “HPRT.”
Transfer Agent and Registrar
The transfer agent and registrar for our common stock will be American Stock Transfer & Trust Company.
Preferred Stock
Our board of directors is authorized to provide for the issuance of shares of preferred stock in one or more series and to fix the preferences, powers and relative, participating, optional or other special rights, and qualifications, limitations or restrictions thereof, including the dividend rate, conversion rights, voting rights, redemption rights and liquidation preference and to fix the number of shares to be included in any such series without any further vote or action by our stockholders. Any preferred stock so issued may rank senior to our common stock with respect to the payment of dividends or amounts upon liquidation, dissolution or winding up, or both. In addition, any such shares of preferred stock may have class or series voting rights. Following completion of this offering and the redemption in whole of our senior preferred stock, we will not have any shares of preferred stock outstanding.
Senior Preferred Stock
General
In June 2007, in connection with our acquisition of SDS and pursuant to a securities purchase agreement, we issued to ABRY Partners and its affiliated funds and Ares Capital Corporation 30,000 shares of senior preferred shares and 7,730 shares of Series C shares for a total offering price of $30 million. The securities purchase agreement was amended and restated in September 2008 in connection with our acquisition of ChartOne. As a result of the corporate reorganization, the Series C shares will be exchanged for shares of our common stock immediately prior to effectiveness of this
142
Table of Contents
registration statement. In addition, the senior preferred shares will be exchanged for shares of our senior preferred stock immediately prior to effectiveness of this registration statement. The senior preferred stock will have substantially similar preferences, powers, rights, limitations and restrictions as the senior preferred shares as will be set forth in an Investors Rights Agreement and our amended and restated charter. These preferences, powers, rights, limitations and restrictions of the senior preferred stock are discussed below. We intend to use a portion of the net proceeds from this offering for the redemption in whole of our senior preferred stock.
Voting Rights
The holders of our senior preferred stock are not entitled to vote with respect to matters presented to our stockholders on which the holders of common stock are entitled to vote.
Dividend Rights
Our senior preferred stock will accrue dividends at a rate of 14% per year and, in the case of an event of default, at a rate of 17% per year until such event of default is cured or waived. The holders of the senior preferred stock will have priority for distributions of cash or other assets over holders of common stock. No dividends will be made to holders of common stock until the entire amount paid for the senior preferred stock plus any accrued but unpaid dividends has been repaid in full. The holders of senior preferred stock will share equally in any dividend declared or paid.
Events of Default
Events of default for the senior preferred stock include our failure to (1) pay any amount due to the holders of the senior preferred stock if such failure continues for two days, (2) make any payment of principal due under our senior secured credit facility or our senior subordinated notes, (3) redeem the senior preferred stock on September 19, 2014, and (4) provide the holders of our senior preferred stock the right to redeem their shares upon the change of control of our company.
Conversion
Our senior preferred stock is not convertible into shares of our common stock.
Redemption Rights
The holders of senior preferred stock will be subject to an optional redemption at our option, in whole, but not in part, in connection with (i) the sale of all or substantially all of our equity securities, (ii) an asset sale or (iii) an initial public offering, at a redemption price per share equal to the liquidation value, as described below, plus the applicable redemption amount, as described below. In addition, at any time from June 15, 2009 through June 14, 2011, holders of the senior preferred stock will be subject to an optional redemption at our option, in whole or in part, at a redemption price per share equal to the liquidation value, as described below, plus the applicable redemption amount, as described below. On or after June 15, 2011, the senior preferred stock may be redeemed at our option, in whole or in part, from time to time, at a redemption price per share equal to the liquidation value, as described below.
For purposes of an optional redemption, the liquidation value is defined as the sum of the unreturned capital value of such share and any accrued but unpaid interest of such share. The term redemption amount is defined as an amount equal to (i) if prior to June 14, 2009, 8% of the liquidation value, (ii) if on or after June 15, 2009 but prior to June 15, 2010, 4% of the liquidation value, (iii) if on or after June 15, 2010 but prior to June 15, 2011, 2% of the liquidation value and (iv) from and after June 15, 2011, zero.
143
Table of Contents
Our senior preferred stock is required to be redeemed by us in whole on or before September 19, 2014 at a redemption price per share equal to the liquidation value, as described above.
The redemption rights of holders of our senior preferred stock are subordinated to the indebtedness outstanding under our senior secured credit facility and our senior subordinated notes, unless expressly permitted under the terms of the senior secured credit facility or our senior subordinated notes.
Put Rights
The holders of senior preferred stock will have put rights, under which we are obligated to redeem the senior preferred stock at the election of the holder of the senior preferred stock upon a change of control of our company, at a redemption price equal to the liquidation value, as described above, plus the applicable redemption amount. We are required to provide written notice to each holder not less than 35 days prior to the occurrence of a change of control. The senior preferred stock’s put rights are subordinated to the indebtedness outstanding under our senior secured credit facility and our senior subordinated notes, unless expressly permitted under the terms of the senior secured credit facility or our senior subordinated notes.
Liquidation Rights
In the event of any voluntary or involuntary liquidation, dissolution or winding up of our affairs, holders of senior preferred stock will have priority over our common stock and will be entitled to share ratably in our assets that are legally available for distribution to stockholders after payment of liabilities. Holders of senior preferred stock will share equally in any distribution, subject to the rights of holders of our indebtedness.
Covenants
The senior preferred stock contains certain covenants restricting our and our subsidiaries’ ability to, among other things and subject to various exceptions, (1) declare or pay dividends or make any other distributions on any capital stock or to holders of capital stock, (2) purchase, redeem, retire or otherwise acquire any capital stock, (3) make investments or other restricted payments, (4) prepay, redeem, retire or repurchase subordinated indebtedness owed, directly or indirectly, to ABRY Partners, (5) enter into transactions with affiliates, (6) effect a consolidation, merger or purchase of all or substantially all the assets of another person, (7) engage in certain lines of business, (8) sell or otherwise dispose of assets, or (9) issue or create any capital stock that is pari passu with or senior to the senior preferred stock. We and our subsidiaries are also required to comply with specified financial covenants, consisting of a total leverage ratio and a fixed charge coverage ratio, and various affirmative covenants.
The total leverage ratio under the senior preferred stock, as of the last day of each of any four consecutive fiscal quarters, must be greater than 6.85 to 1.0 for the fiscal quarters ending after January 1, 2009 through December 31, 2009, 6.50 to 1.0 for the fiscal quarters ending after January 1, 2010 through June 30, 2010, 6.15 to 1.0 for the fiscal quarters ending after July 1, 2010 through September 30, 2010, 6.00 to 1.0 for the fiscal quarters ending after October 1, 2010 through December 31, 2010, 5.75 to 1.0 for the fiscal quarters ending after January 1, 2011 through March 31, 2011 and 5.50 to 1.0 thereafter to maturity. The fixed charge coverage ratio may not be less than 1.0 to 1.0 as of the last day of any four consecutive fiscal quarters.
144
Table of Contents
Corporate Opportunity
Our amended and restated certificate of incorporation will provide that the doctrine of corporate opportunity will not apply against ABRY Partners, or any of our directors who are employees of, of affiliated with, ABRY Partners, in a manner that would prohibit them from investing in competing businesses or doing business with our customers. ABRY Partners has informed us that it has no current plans to invest in directly competitive businesses or conduct business with our customers in a manner that could be harmful to us. See “Risk Factors — An entity controlled by ABRY Partners will own a substantial portion of our common stock after the completion of this offering and will have a substantial influence in our affairs, which will limit your ability to influence corporate activities and may adversely affect the market price of our common stock.”
Antitakeover Effects of Delaware Law and Our Certificate of Incorporation and By-laws
Our amended and restated certificate of incorporation and bylaws contain provisions that may delay, defer or discourage another party from acquiring control of us. We expect that these provisions, which are summarized below, will discourage coercive takeover practices or inadequate takeover bids. These provisions are also designed to encourage persons seeking to acquire control of us to first negotiate with our board of directors, which we believe may result in an improvement of the terms of any such acquisition in favor of our stockholders. However, they also give our board of directors the power to discourage acquisitions that some stockholders may favor.
Undesignated Preferred Stock
The ability to authorize undesignated preferred stock will make it possible for our board of directors to issue preferred stock with super voting, special approval, dividend or other rights or preferences on a discriminatory basis that could impede the success of any attempt to acquire us. These and other provisions may have the effect of deferring, delaying or discouraging hostile takeovers, or changes in control or management of our company.
Requirements for Advance Notification of Stockholder Meetings, Nominations and Proposals
Our bylaws will provide that special meetings of the stockholders may be called only upon the request of not less than a majority of the combined voting power of the voting stock, upon the request of a majority of the board, or upon the request of the chief executive officer. Our bylaws will prohibit the conduct of any business at a special meeting other than as specified in the notice for such meeting. These provisions may have the effect of deferring, delaying or discouraging hostile takeovers, or changes in control or management of our company.
Our bylaws will establish advance notice procedures with respect to stockholder proposals and the nomination of candidates for election as directors, other than nominations made by or at the direction of the board of directors or a committee of the board of directors. In order for any matter to be “properly brought” before a meeting, a stockholder will have to comply with advance notice requirements and provide us with certain information. Additionally, vacancies and newly created directorships may be filled only by a vote of a majority of the directors then in office, even though less than a quorum, and not by the stockholders. Our bylaws will allow the presiding officer at a meeting of the stockholders to adopt rules and regulations for the conduct of meetings which may have the effect of precluding the conduct of certain business at a meeting if the rules and regulations are not followed. These provisions may also defer, delay or discourage a potential acquiror from conducting a solicitation of proxies to elect the acquiror’s own slate of directors or otherwise attempting to obtain control of our company.
145
Table of Contents
Stockholder Action by Written Consent
Pursuant to Section 228 of the Delaware General Corporation Law, any action required to be taken at any annual or special meeting of the stockholders may be taken without a meeting, without prior notice and without a vote if a consent or consents in writing, setting forth the action so taken, is signed by the holders of outstanding stock having not less than the minimum number of votes that would be necessary to authorize or take such action at a meeting at which all shares of our stock entitled to vote thereon were present and voted, unless our amended and restated certificate of incorporation provides otherwise. Our amended and restated certificate of incorporation provides that any action required or permitted to be taken by our stockholders may be effected at a duly called annual or special meeting of our stockholders and may not be effected by consent in writing by such stockholders, unless such action is recommended by all directors then in office.
146
Table of Contents
DESCRIPTION OF CERTAIN INDEBTEDNESS
Senior Secured Credit Facility
The senior secured credit facility was entered into by and between CT Intermediate, as borrower, CT Topco, as guarantor, and various lender parties, including GE Capital Corporation and Newstar Financial, Inc. The senior secured credit facility consists of a five-year revolving and term senior secured credit facility including a sub-facility available for the issuance of letters of credit of up to $150.0 million. The credit agreement requires CT Intermediate to make quarterly amortization payments of the term loan facility in the respective amounts set forth for the following periods: (1) $2,437,500 for the period of March 31, 2009 through and including December 31, 2009; (2) $3,250,000 for the period of March 31, 2010 through and including December 31, 2010; (3) $4,062,500 for the period of March 31, 2011 through and including December 31, 2011; (4) $4,875,000 for the period of March 31, 2012 through, but not including September 22, 2013, and (5) the remaining principal balance payable on September 22, 2013.
The term loan facility is required to be prepaid in an amount equal to (1) 100% of the net cash proceeds of all asset sales and dispositions in excess of $1.0 million by CT Topco and its subsidiaries, subject to certain exceptions, (2) 100% of the net cash proceeds of issuances of certain debt obligations by us and our subsidiaries, subject to certain exceptions, (3) 50% of the net cash proceeds from equity issuances by us and our subsidiaries, subject to certain exceptions, and (4) 75% of CT Intermediate and its subsidiaries’ annual excess cash flow as defined in the credit agreement in any fiscal year in which CT Intermediate’s total leverage ratio is greater than or equal to 3.5 to 1, or 50%, with respect to any fiscal year to the extent the total leverage ratio with respect to such year is less than 3.5 to 1.
Voluntary prepayments and commitment reductions are permitted in whole or in part, without premium or penalty, subject to minimum prepayment or reduction requirements.
All of CT Intermediate’s obligations under the senior secured credit facility are unconditionally guaranteed by the guarantor and each existing and subsequently acquired or organized domestic subsidiary. The obligations under the senior secured credit facility, including the guarantees, are secured by substantially all of CT Intermediate’s present and future assets and all present and future assets of each guarantor, including, but not limited to (1) a first-priority pledge of all of CT Intermediate’s capital stock and all of the outstanding capital stock owned by CT Intermediate or any guarantor in any domestic subsidiary, and (2) perfected first-priority security interests in all of CT Intermediate’s present and future assets and the present and future assets of each guarantor, subject to certain limited exceptions.
The senior secured credit facility provides for interest based upon a fixed spread above the banks’ prime lending rate or the LIBOR lending rate. The borrowings under the term loan facility bear interest at June 30, 2009 at 8.7%. The amount outstanding on the term loan as of June 30, 2009 was $125.1 million.
The amount outstanding on the revolving credit facility as of June 30, 2009 was $7.4 million. CT Intermediate has issued approximately $3.5 million of letters of credit under the sub-facility as of June 30, 2009. In addition, the lenders under the revolving credit facility are paid a fee on unused commitments under that facility at a rate equal to 0.50% per annum. During the existence of any payment or bankruptcy-related default under the credit agreement or during the existence of any other specified event of default after receiving certain notices, the margin on all obligations under the senior secured credit facility shall increase by 2% per annum.
147
Table of Contents
The credit agreement documentation contains customary representations and warranties, subject to limitations and exceptions, and customary covenants restricting our subsidiaries’ ability to, among other things and subject to various exceptions, (1) declare dividends, make distributions or redeem or repurchase capital stock, (2) prepay, redeem or repurchase other debt, (3) incur liens or grant negative pledges, (4) make loans and investments and enter into acquisitions and joint ventures, (5) incur additional indebtedness, (6) amend or otherwise alter the acquisition documents or any debt agreements, (7) make capital expenditures, (8) engage in mergers, acquisitions and asset sales, (9) conduct transactions with affiliates, (10) alter the nature of the guarantor’s or CT Intermediate’s businesses, or (11) change the guarantor or its subsidiaries’ fiscal year. The guarantor and its subsidiaries are also required to comply with specified financial covenants consisting of a maximum total leverage ratio, a senior leverage ratio, a minimum consolidated EBITDA and a minimum fixed charge coverage ratio and various affirmative covenants.
Events of default under the credit agreement include, but are not limited to, (1) CT Intermediate’s failure to pay principal, interest, fees or other amounts under the credit agreement when due taking into account any applicable grace period, (2) any representation or warranty proving to have been materially incorrect when made, (3) with respect to certain covenants, covenant defaults subject to a grace period, (4) bankruptcy events, (5) a cross-default to certain other debt, (6) unsatisfied final judgments over a threshold, (7) a change of control, (8) certain defaults under Employee Retirement Income Security Act of 1974, or ERISA, and (9) the invalidity or impairment of any loan document or any security interest.
In addition, the credit agreement includes customary provisions regarding breakage costs incurred in connection with prepayments, changes in capital adequacy and capital requirements or their interpretation, illegality, unavailability and payments free and clear of withholding.
Borrowings under the senior secured credit facility are subject to the accuracy of representations and warranties, including the absence of any material adverse change in CT Intermediate’s condition, and the absence of any events of default. As of the date of this prospectus, CT Technologies is in compliance with the covenant requirements of the senior secured credit facility.
Senior Subordinated Notes
On September 22, 2008, CT Intermediate issued $75.0 million aggregate principal amount of senior subordinated notes due March 2014. CT Intermediate issued the senior subordinated notes in transactions exempt from the registration provisions of Securities Act of 1933, as amended, or the Securities Act.
Interest
Interest on the senior subordinated notes accrues at the rate of 14% per year and is payable quarterly on the first business day of January, April, July and October by making a cash payment in an amount equal to 12% per annum with the remaining 2% being paid in-kind. Interest on overdue principal and interest accrues at a maximum rate that is 2% higher than the then applicable interest rate on the senior subordinated notes.
Subsidiary Guarantees
CT Intermediate’s obligations under the senior subordinated notes are fully, unconditionally, jointly and severally guaranteed on a senior subordinated unsecured basis by all of the guarantor’s existing and future domestic restricted subsidiaries.
148
Table of Contents
Optional Redemption
CT Intermediate may redeem any of the senior subordinated notes at any time on or after September 22, 2009, in whole or in part, in cash at a redemption price equal to 100% of the principal amount of such note, plus accrued and unpaid interest to the applicable redemption date, plus the following applicable prepayment premium calculated as a percentage of the principal amount of the senior subordinated notes to be redeemed: (1) 4.00% after September 22, 2009 and on or prior to September 22, 2010; (2) 3.00% after September 22, 2010 and on or prior to September 22, 2011; (3) 2.00% after September 22, 2011 and on or prior to September 22, 2012; and (4) no prepayment premium after September 22, 2012.
Certain Covenants
The note purchase agreement governing the senior subordinated notes contains covenants that, among other things, limit our subsidiaries’ ability to:
| • | pay dividends on, redeem or repurchase our subsidiaries’ capital stock; |
| • | make investments and other restricted payments; |
| • | incur additional indebtedness or issue preferred stock; |
| • | create liens; |
| • | permit dividend or other payment restrictions on our subsidiaries; |
| • | sell all or substantially all of our subsidiaries’ assets or consolidate or merge with or into other companies; and |
| • | engage in transactions with affiliates. |
These limitations are subject to a number of important qualifications and exceptions as described in the indenture governing the senior subordinated notes.
149
Table of Contents
SHARES ELIGIBLE FOR FUTURE SALE
Prior to this offering, there has been no public market for our common stock. Future sales of substantial amounts of our common stock in the public market, or the perception that such sales may occur, could adversely affect the prevailing market price of our common stock. No prediction can be made as to the effect, if any, future sales of shares, or the availability of shares for future sales, will have on the market price of our common stock prevailing from time to time. As described below, only a limited number of shares currently outstanding will be available for sale immediately after this offering due to contractual and legal restrictions on resale. The sale of substantial amounts of our common stock in the public market, or the perception that such sales could occur, could harm the prevailing market price of our common stock.
Sale of Restricted Shares
Upon completion of this offering, we will have 22,509,285 shares of common stock outstanding. Of these shares of common stock, the 6,000,000 shares of common stock being sold in this offering, plus any shares issued upon exercise of the underwriters’ option to purchase additional shares, will be freely tradable without restriction under the Securities Act, except for any such shares which may be held or acquired by an “affiliate” of ours, as that term is defined in Rule 144 promulgated under the Securities Act, which shares will be subject to the volume limitations and other restrictions of Rule 144 described below. The remaining 16,509,285 shares of common stock held by our existing stockholders upon completion of this offering will be “restricted securities,” as that phrase is defined in Rule 144, and may be resold only after registration under the Securities Act or pursuant to an exemption from such registration, including, among others, the exemptions provided by Rule 144 and 701 under the Securities Act, which rules are summarized below. These remaining shares of common stock held by our existing stockholders upon completion of this offering will be available for sale in the public market after the expiration of the lock-up agreements described in “Underwriting,” taking into account the provisions of Rules 144 and 701 under the Securities Act.
Lock-Up Agreements
We, our directors and officers, ABRY Partners, funds affiliated with ABRY Partners and our other stockholders have entered into lock-up agreements with the underwriters. Under these agreements, subject to exceptions, we may not issue any new shares of common stock, and those persons may not, directly or indirectly, offer, sell, contract to sell, pledge or otherwise dispose of or hedge any common securities convertible into or exchangeable for shares of our common stock, or publicly announce the intention to do any of the foregoing, without the prior written consent of Deutsche Bank Securities Inc. and William Blair & Company, L.L.C., until the expiration of the lock-up agreements. Deutsche Bank Securities Inc. and Williams Blair & Company, L.L.C. may, in their sole discretion, at any time and without prior notice, release all or any portion of the shares from the restrictions contained in such lock-up agreements. Deutsche Bank Securities Inc. and William Blair & Company, L.L.C. have advised us that there is no specific criteria for the waiver of lock-up restrictions.
Rule 144
In general, under Rule 144, beginning 90 days after the date of this prospectus, a person who is not our affiliate and has not been our affiliate at any time during the preceding three months will be entitled to sell any shares of our common stock that such person has beneficially owned for at least six months, including the holding period of any prior owner other than one of our affiliates, without regard to volume limitations. Sales of our common stock by any such person would be subject to the availability of current public information about us if the shares to be sold were beneficially owned by such person for less than one year.
150
Table of Contents
In addition, under Rule 144, a person may sell shares of our common stock acquired from us immediately upon the closing of this offering, without regard to volume limitations or the availability of public information about us, if:
| • | the person is not our affiliate and has not been our affiliate at any time during the preceding three months; and |
| • | the person has beneficially owned the shares to be sold for at least one year, including the holding period of any prior owner other than one of our affiliates. |
Beginning 90 days after the date of this prospectus, our affiliates who have beneficially owned shares of our common stock for at least six months, including the holding period of any prior owner other than one of our affiliates, would be entitled to sell within any three-month period a number of shares that does not exceed the greater of:
| • | 1% of the number of shares of our common stock then outstanding, which will equal approximately 225,093 shares immediately after this offering; and |
| • | the average weekly trading volume in our common stock on The NASDAQ Global Market during the four calendar weeks preceding the date of filing of a Notice of Proposed Sale of Securities Pursuant to Rule 144 with respect to the sale. |
Sales under Rule 144 by our affiliates are also subject to manner of sale provisions and notice requirements and to the availability of current public information about us.
Rule 701
In general, under Rule 701, any of our employees, directors, officers, consultants or advisors who purchased shares from us in connection with a compensatory stock or option plan or other written agreement before the effective date of this offering, or who purchased shares from us after that date upon the exercise of options granted before that date, may, to the extent not subject to a lock-up agreement, be eligible to resell such shares in reliance upon Rule 144 beginning 90 days after the date of this prospectus. If such person is not an affiliate, the sale may be made subject only to the manner-of-sale restrictions of Rule 144. If such a person is an affiliate, the sale may be made under Rule 144 without compliance with its one-year minimum holding period, but subject to the other Rule 144 restrictions.
Registration Rights
As described above in “Certain Relationships and Related Party Transactions — Registration Rights Agreement,” following the completion of this offering, subject to the lock-up period described above, certain parties to our registration rights agreement will be entitled, subject to certain exceptions, to demand the filing of, and the inclusion of their shares in, registration statements relating to our securities. If this right is exercised, holders of up to shares will be entitled to participate in such a registration. By exercising their registration rights and causing a large number of shares to be registered and sold in the public market, these holders could cause the price of our common stock to fall. In addition, any demand to include such shares in our registration statements could reduce our ability to raise needed capital through a public offering of common stock.
151
Table of Contents
CERTAIN MATERIAL UNITED STATES FEDERAL INCOME TAX CONSEQUENCES
The following is a general discussion of certain material U.S. federal income tax consequences to holders of our common stock. This discussion is a summary for general information purposes only and does not consider all aspects of U.S. federal income taxation that may be relevant to holders in light of their particular investment circumstances or to certain types of holders subject to special tax rules, including partnerships, banks, financial institutions or other financial services entities, broker-dealers, insurance companies, tax-exempt organizations, regulated investment companies, real estate investment trusts, retirement plans, individual retirement accounts or other tax-deferred accounts, persons who use or are required to use “mark to market” accounting, persons that hold shares of our common stock as part of a straddle, a hedge or a conversion transaction, investors in partnerships and other pass-through entities, persons with a functional currency other than the U.S. dollar and persons subject to the alternative minimum tax. This discussion also does not address any non-U.S. tax considerations or any U.S. federal non-income, state or local tax considerations. This discussion assumes that holders hold their shares as “capital assets” within the meaning of Section 1221 of the Internal Revenue Code of 1986, as amended, or the Code. This discussion is based on the Code and applicable U.S. Treasury Regulations, rulings, administrative pronouncements and decisions as of the date hereof, all of which are subject to change or differing interpretation at any time with possible retroactive effect. The authorities on which this discussion is based are subject to various interpretations, and any views expressed within this discussion are not binding on the U.S. Internal Revenue Service, or the IRS, or the courts. No assurance can be given that the IRS or the courts will agree with the tax consequences described herein.
For purposes of this discussion, a U.S. Holder is a beneficial owner of shares of our common stock that is:
| • | a citizen or individual resident of the United States; |
| • | a corporation (or other entity treated as a corporation for U.S. federal income tax purposes) created or organized, or treated as created or organized, in or under the laws of the U.S. or any political subdivision of the U.S.; |
| • | an estate, the income of which is subject to U.S. federal income taxation regardless of its source; |
| • | a trust (1) if a court within the U.S. is able to exercise primary supervision over the trust’s administration and one or more U.S. persons have authority to control all substantial decisions of the trust or (2) that has a valid election in effect under applicable Treasury Regulations to be treated as a U.S. person; or |
| • | an entity that is disregarded as separate from its owner if all of its interests are owned by a single person described above. |
For purposes of this discussion, a Non-U.S. Holder means a beneficial owner of our common stock that is neither a U.S. Holder nor a partnership (or other entity or arrangement that is taxable as a partnership for U.S. federal income tax purposes).
If a partnership (or other entity or arrangement treated as a partnership for U.S. federal income tax purposes) holds our common stock, the tax treatment of a partner in the partnership generally will depend upon the status of the partner and the activities of the partnership.
Accordingly, partnerships that hold our common stock and partners in such partnerships are urged to consult their own tax advisors regarding the specific U.S. federal income tax consequences to them.
152
Table of Contents
EACH PROSPECTIVE PURCHASER OF OUR STOCK IS URGED TO CONSULT ITS OWN TAX ADVISOR REGARDING THE SPECIFIC FEDERAL, STATE, LOCAL, FOREIGN AND OTHER TAX CONSIDERATIONS OF PURCHASING, OWNING AND DISPOSING OF OUR COMMON STOCK. THIS SUMMARY OF TAX CONSEQUENCES IS FOR GENERAL INFORMATION PURPOSES ONLY AND IS NOT TAX ADVICE.
Consequences to U.S. Holders
Dividends
As discussed under the section entitled “Dividend Policy” above, we do not currently anticipate paying dividends. In the event that we do make a distribution of cash or property with respect to our common stock, any such distributions will be taxable as a dividend for U.S. federal income tax purposes to the extent paid from our current or accumulated earnings and profits (as determined under U.S. federal income tax principles).
A U.S. Holder generally will be subject to U.S. federal income tax on any dividends received in respect of our common stock at a maximum federal income tax rate of 15% if the U.S. Holder is a non-corporate taxpayer and certain holding period and other requirements are satisfied, and a maximum federal income tax rate of 35% otherwise. If the amount of a distribution exceeds our current and accumulated earnings and profits, such excess will be allocated ratably among each share of common stock with respect to which the distribution is paid and treated first as a tax-free return of capital to the extent of the U.S. Holder’s adjusted tax basis in each such share, and thereafter as capital gain from a sale or other disposition of each such share of common stock that is taxed to the U.S. Holders as described below.
Under current law, the 15% maximum federal income tax rate on dividends is scheduled to expire effective for taxable years beginning after December 31, 2010, and dividends received in subsequent taxable years are scheduled to be taxed at a maximum federal income tax rate of 39.6%.
Gain on Disposition of Common Stock
A U.S. Holder that sells or otherwise disposes of our common stock in a taxable transaction will recognize capital gain or loss equal to the amount of cash plus the fair market value of property received in exchange for the common stock minus the U.S. Holder’s adjusted tax basis in the common stock. Any capital gain or loss recognized by the U.S. Holder will be long-term capital gain or loss if the U.S. Holder has held our common stock for more than one year at the time of the sale or other disposition and short-term capital gain or loss otherwise. Long-term capital gains recognized by non-corporate taxpayers are taxable under current law at a maximum federal income tax rate of 15%. Long-term capital gains recognized by corporations and short-term capital gains recognized by corporate and non-corporate taxpayers are taxable under current law at a maximum federal income tax rate of 35%. A U.S. Holder’s ability to use any capital loss to offset other income or gain is subject to certain limitations.
Under current law, the maximum federal income tax rate applicable to long-term capital gains is scheduled to increase to 20% for non-corporate taxpayers for taxable years beginning after December 31, 2010.
Consequences to Non-U.S. Holders
Dividends
As with distributions to U.S. Holders, in the event that we do make a distribution of cash or property with respect to our common stock to any Non-U.S. Holder, any such distributions will
153
Table of Contents
be taxable as a dividend for U.S. federal income tax purposes to the extent paid from our current or accumulated earnings and profits (as determined under U.S. federal income tax principles). A Non-U.S. Holder generally will be subject to U.S. federal income tax on any dividends received in respect of our common stock at a 30% rate (or such lower rate as prescribed by an applicable income tax treaty as discussed below) unless the dividend is effectively connected with the conduct of a U.S. trade or business. As discussed below, this tax is generally collected through withholding on the dividend payment to the Non-U.S. Holder.
If a Non-U.S. Holder receives a dividend that is effectively connected with the conduct of a U.S. trade or business, the dividend payment will not be subject to withholding (provided that the certification requirements described below are satisfied). However, the dividends received by the Non-U.S. Holder that are effectively connected with the conduct of a U.S. trade or business will be subject to tax under current law at a maximum federal income tax rate of 15% if the Non-U.S. Holder is a non-corporate taxpayer and certain holding period and other requirements are satisfied, and a maximum federal income tax rate of 35% otherwise. A Non-U.S. Holder that is a corporation may also be subject to a 30% federal branch profits tax on earnings and profits effectively connected with a U.S. trade or business to the extent that such earnings and profits are not reinvested and maintained in a U.S. business according to the federal branch profits tax rules.
If the amount of a distribution exceeds our current and accumulated earnings and profits, such excess will be allocated ratably among each share of common stock with respect to which the distribution is paid and treated first as a tax-free return of capital to the extent of the Non-U.S. Holder’s adjusted tax basis in each such share, and thereafter as capital gain from a sale or other disposition of each such share of common stock that is taxed to the Non-U.S. Holders as described below.
Under current law, the 15% maximum federal income tax rate on dividends effectively connected with the conduct of a U.S. trade or business by a non-corporate taxpayer is scheduled to expire effective for taxable years beginning after December 31, 2010, and dividends received in subsequent taxable years that are effectively connected with the conduct of a U.S. trade or business by a non-corporate taxpayer are scheduled to be taxed at a maximum federal income tax rate of 39.6%.
Gain on Disposition of Common Stock
A Non-U.S. Holder that sells or otherwise disposes of our common stock in a taxable transaction generally will not be subject to U.S. federal income taxation unless:
| • | gain resulting from the disposition is effectively connected with the conduct of a U.S. trade or business or, where a relevant tax treaty applies, is attributable to a U.S. permanent establishment; or |
| • | we are or have been a U.S. real property holding corporation, or USRPHC, as defined in Section 897 of the Code at any time within the five-year period preceding the disposition or, if shorter, the Non-U.S. Holder’s holding period for the common stock. |
In general, a corporation is a USRPHC if the fair market value of its “U.S. real property interests” equals or exceeds 50% of the sum of the fair market value of its worldwide (domestic and foreign) real property interests and its other assets used or held for use in a trade or business. We believe that we are not a USRPHC on the date hereof and currently do not anticipate becoming a USRPHC. Even if we become a USRPHC, gain on the sale or other disposition of our common stock by a Non-U.S. Holder generally would not be subject to United
154
Table of Contents
States federal income tax provided the common stock was “regularly traded on an established securities market” and such holder did not actually or constructively own more than 5% of such class of common stock during the shorter of (1) the five-year period preceding the disposition or (2) such holder’s holding period.
If a Non-U.S. Holder is subject to U.S. federal income taxation upon the disposition of our common stock, the Non-U.S. Holder generally will be taxable in the same manner as a U.S. Holder, although a Non-U.S. Holder that is a corporation may also be subject to a 30% branch profits tax on earnings and profits effectively connected with a U.S. trade or business to the extent that such earnings and profits are not reinvested and maintained in a U.S. business according to the federal branch profits tax rules. A Non-U.S. Holder’s ability to use any capital loss to offset other income or gain subject to U.S. federal income taxation is subject to certain limitations.
Under certain circumstances, a Non-U.S. Holder who is present in the U.S. for 183 days or more in the individual’s taxable year in which the sale or other disposition of our common stock occurs may be subject to a 30 percent tax on the gross amount of the gain on such sale or disposition unless such gain is already subject to tax as effectively connected with the conduct of a U.S. trade or business. In this case, the Non-U.S. Holder’s ability to use other losses to offset the gain on our common stock will be limited.
Income Tax Treaties
If a Non-U.S. Holder is eligible for treaty benefits under an income tax treaty entered into by the U.S., the Non-U.S. Holder may be able to reduce or eliminate certain of the U.S. federal income taxes discussed above, such as the tax on dividends and the branch profits tax, and the Non-U.S. Holder may be able to treat gain, even if effectively connected with a U.S. trade or business, as not subject to U.S. federal income taxation unless the U.S. trade or business is conducted through a permanent establishment located in the U.S. Non-U.S. Holders are urged to consult their tax advisors regarding possible relief under an applicable income tax treaty.
Withholding and Information Reporting
We generally must report annually to the IRS and to you the amount of dividends paid to you and the tax withheld with respect to those dividends, regardless of whether withholding was required, together with other information. We may also be required to comply with information reporting requirements under the Code with respect to proceeds from a sale or other taxable disposition of our common stock. Copies of the information returns reporting such information may also be made available to the tax authorities in the country in which a Non-U.S. Holder resides under the provisions of an applicable income tax treaty or other applicable agreements.
A U.S. Holder may be subject to backup withholding (currently at a rate of 28%) on the gross amount of any dividend or other distribution on our common stock and on the proceeds from a sale or other taxable disposition of our common stock, unless the U.S. Holder is exempt from backup withholding and, when required, demonstrates that status, or provides a correct taxpayer identification number on a form acceptable under U.S. Treasury Regulations (generally an IRS Form W-9) and otherwise complies with the applicable requirements of the backup withholding rules.
A Non-U.S. Holder generally will be subject to withholding at a rate of 30% of the gross amount of any dividend or other distribution on our common stock unless the Non-U.S. Holder
155
Table of Contents
qualifies for a reduced rate of withholding or an exemption from withholding under an applicable tax treaty or the dividend or other distribution is effectively connected with a U.S. trade or business (in which case the dividend or other distribution will be exempt from withholding but the Non-U.S. Holder will nonetheless be liable for any applicable U.S. federal income tax as described above). The Non-U.S. Holder may be required to demonstrate its qualification for a reduced rate of withholding or an exemption from withholding on a form acceptable under applicable U.S. Treasury Regulations (generally an IRS Form W-8BEN or W-8ECI) and otherwise comply with the applicable requirements of the backup withholding rules.
In addition, a Non-U.S. Holder may be subject to backup withholding on the proceeds from a sale or other taxable disposition of our common stock effected by or through a broker, unless the Non-U.S. Holder provides certification as described in the Treasury Regulations, that it is not a United States person or otherwise establishes an exemption from withholding on a form acceptable under U.S. Treasury Regulations (generally an IRS Form W-8BEN or W-8ECI) or unless the transaction is through a foreign office of a broker who is itself not subject to U.S. information reporting requirements.
The backup withholding tax is not an additional tax. Any amounts withheld under the backup withholding rules generally will be allowed as a refund or credit against a holder’s United States federal income tax liability provided the required information is furnished in a timely manner to the IRS. Holders are advised to consult their tax advisers to ensure compliance with the procedural requirements to reduce or avoid withholding (including backup withholding) or, if applicable, to file a claim for a refund of withheld amounts in excess of the holder’s U.S. federal income tax liability.
THE U.S. FEDERAL INCOME TAX DISCUSSION SET FORTH ABOVE IS INCLUDED FOR GENERAL INFORMATION PURPOSES ONLY. POTENTIAL PURCHASERS ARE URGED TO CONSULT THEIR OWN TAX ADVISORS TO DETERMINE THE FEDERAL, STATE, LOCAL, FOREIGN AND OTHER TAX CONSIDERATIONS OF PURCHASING, OWNING AND DISPOSING OF OUR COMMON STOCK.
156
Table of Contents
Subject to the terms and conditions of the underwriting agreement, the underwriters named below, through their representatives Deutsche Bank Securities Inc. and William Blair & Company, L.L.C., have severally agreed to purchase from us the following respective number of shares of common stock at a public offering price less the underwriting discounts and commissions set forth on the cover page of this prospectus:
| Underwriters |
Number of Shares | |
| Deutsche Bank Securities Inc. |
||
| William Blair & Company, L.L.C. |
||
| Raymond James & Associates, Inc. |
||
| Needham & Company, LLC |
||
| Total |
6,000,000 | |
The underwriting agreement provides that the obligations of the several underwriters to purchase the shares of common stock offered by this prospectus are subject to certain conditions precedent and that the underwriters will purchase all of the shares of common stock offered by this prospectus, other than those covered by the over-allotment option described below, if any of these shares are purchased.
We have been advised by the representatives of the underwriters that the underwriters propose to offer the shares of common stock to the public at the public offering price set forth on the cover page of this prospectus and to dealers at a price that represents a concession not in excess of $ per share under the public offering price. The underwriters may allow, and these dealers may re-allow, a concession of not more than $ per share to other dealers. After the initial public offering, representatives of the underwriters may change the offering price and other selling terms.
We have granted to the underwriters an option, exercisable not later than 30 days after the date of this prospectus, to purchase up to 900,000 additional shares of common stock at the public offering price less the underwriting discounts and commissions set forth on the cover page of this prospectus. The underwriters may exercise this option only to cover over-allotments made in connection with the sale of the common stock offered by this prospectus. To the extent that the underwriters exercise this option, each of the underwriters will become obligated, subject to customary conditions, to purchase approximately the same percentage of these additional shares of common stock as the number of shares of common stock to be purchased by it in the above table bears to the total number of shares of common stock offered by this prospectus. We will be obligated, pursuant to this option, to sell these additional shares of common stock to the underwriters to the extent the option is exercised. If any additional shares of common stock are purchased, the underwriters will offer the additional shares on the same terms as those on which the shares are being offered.
157
Table of Contents
The underwriting discounts and commissions per share are equal to the public offering price per share of common stock less the amount paid by the underwriters to us per share of common stock. The underwriting discounts and commissions are % of the initial public offering price. We have agreed to pay the underwriters the following discounts and commissions, assuming either no exercise or full exercise by the underwriters of the underwriters’ over-allotment option:
| Total Fees | |||||||||
| Fee per share | Without Exercise of Over-Allotment Option |
With Full Exercise of Over-Allotment Option | |||||||
| Discounts and Commissions paid by us |
$ | $ | $ | ||||||
| Expenses payable by us |
|||||||||
| Underwriting Discounts and Commissions paid by selling stockholders |
|||||||||
In addition, we estimate that our share of the total expenses of this offering, excluding underwriting discounts and commissions, will be approximately $ .
We have agreed to indemnify the underwriters against some specified types of liabilities, including liabilities under the Securities Act, and to contribute to payments the underwriters may be required to make in respect of any of these liabilities.
Each of our directors and officers, ABRY Partners, funds affiliated with ABRY Partners, and our other stockholders have agreed not to offer, sell, contract to sell or otherwise dispose of, or enter into any transaction that is designed to, or could be expected to, result in the disposition of any shares of our common stock or other securities convertible into or exchangeable or exercisable for shares of our common stock or derivatives of our common stock owned by these persons prior to this offering or common stock issuable upon exercise of options or warrants held by these persons for a period of 180 days after the effective date of the registration statement of which this prospectus is a part without the prior written consent of Deutsche Bank Securities Inc. and William Blair & Company, L.L.C. This consent may be given at any time without public notice. Transfers or dispositions can be made during the lock-up period in the case of gifts or for estate planning purposes where the donee signs a lock-up agreement. We have entered into a similar agreement with the representatives of the underwriters. There are no agreements between the representatives and any of our officers, directors or stockholders releasing them from these lock-up agreements prior to the expiration of the 180-day period.
The representatives of the underwriters have advised us that the underwriters do not intend to confirm sales, without client authorizations, to any account over which they exercise discretionary authority. The representatives of the underwriters have also informed us that the underwriters intend to deliver all copies of this prospectus via electronic means, via hand delivery or through mail or courier service.
In connection with the offering, the underwriters may purchase and sell shares of our common stock in the open market. These transactions may include short sales, purchases to cover positions created by short sales and stabilizing transactions. Short sales involve the sale by the underwriters of a greater number of shares than they are required to purchase in the offering. “Covered” short sales are sales made in an amount not greater than the underwriters’ option to purchase additional shares of common stock from us in the offering. The underwriters may close out any covered short position by either exercising their option to purchase additional shares or purchasing shares in the open market. In determining the source of shares to close out the covered short position, the underwriters will consider, among other things, the price of shares available for purchase in the open market as compared to the price at which they may purchase shares through the over-allotment option.
158
Table of Contents
“Naked” short sales are any sales in excess of the over-allotment option. The underwriters must close out any naked short position by purchasing shares in the open market. A naked short position is more likely to be created if underwriters are concerned that there may be downward pressure on the price of the shares in the open market prior to the completion of the offering. Stabilizing transactions consist of various bids for or purchases of our common stock made by the underwriters in the open market prior to the completion of the offering.
The underwriters may impose a penalty bid. This occurs when a particular underwriter repays to the other underwriters a portion of the underwriting discount received by it because the representatives of the underwriters have repurchased shares sold by or for the account of that underwriter in stabilizing or short covering transactions.
Purchases to cover a short position and stabilizing transactions may have the effect of preventing or slowing a decline in the market price of our common stock. In addition, these purchases, along with the imposition of the penalty bid, may stabilize, maintain or otherwise affect the market price of our common stock. As a result, the price of our common stock may be higher than the price that might otherwise exist in the open market. These transactions may be effected on The NASDAQ Global Market, in the over-the-counter market or otherwise.
At our request, the underwriters have reserved for sale at the initial public offering price up to shares of our common stock being sold in this offering for our vendors, employees, family members of employees, customers and other third parties. The number of shares of our common stock available for the sale to the general public will be reduced to the extent these reserved shares are purchased. Any reserved shares not purchased by these persons will be offered by the underwriters to the general public on the same basis as the other shares in this offering.
A prospectus in electronic format is being made available on Internet websites maintained by one or more of the lead underwriters of this offering and may be made available on websites maintained by other underwriters. Other than the prospectus in electronic format, the information on any underwriter’s website and any information contained in any other website maintained by an underwriter is not part of the prospectus or the registration statement of which the prospectus forms a part.
We have applied to have our common stock approved for listing on The NASDAQ Global Market under the symbol “HPRT.”
Pricing of this Offering
Prior to this offering, there has been no public market for our common stock. Consequently, the initial public offering price of our common stock will be determined by negotiation among us and the representatives of the underwriters. Among the primary factors that will be considered in determining the public offering price are:
| • | prevailing market conditions; |
| • | our results of operations in recent periods; |
| • | the present stage of our development; |
| • | the market capitalizations and stages of development of other companies that we and the representatives of the underwriters believe to be comparable to our business; and |
| • | estimates of our business potential. |
Each underwriter intends to comply with all applicable laws and regulations in each jurisdiction in which it acquires, offers, sells or delivers shares of common stock or has in its possession or distributes the prospectus.
159
Table of Contents
In relation to each member state of the European Economic Area that has implemented the Prospectus Directive, each, a relevant member state, with effect from and including the date on which the Prospectus Directive is implemented in that relevant member state, the relevant implementation date, an offer of securities described in this prospectus may not be made to the public in that relevant member state other than:
| • | to any legal entity that is authorized or regulated to operate in the financial markets or, if not so authorized or regulated, whose corporate purpose is solely to invest in securities; |
| • | to any legal entity that has two or more of (1) an average of at least 250 employees during the last financial year; (2) a total balance sheet of more than €43,000,000 and (3) an annual net turnover of more than € 50,000,000, as shown in its last annual or consolidated accounts; |
| • | to fewer than 100 natural or legal persons (other than qualified investors as defined in the Prospectus Directive) subject to obtaining the prior consent of the representatives; or |
| • | in any other circumstances that do not require the publication of a prospectus pursuant to Article 3 of the Prospectus Directive, |
provided that no such offer of securities shall require us or any underwriters to publish a prospectus pursuant to Article 3 of the Prospectus Directive.
For purposes of this provision, the expression an “offer of securities to the public” in any relevant member state means the communication in any form and by any means of sufficient information on the terms of the offer and the securities to be offered so as to enable an investor to decide to purchase or subscribe the securities, as the expression may be varied in that member state by any measure implementing the Prospectus Directive in that member state, and the expression “Prospectus Directive” means Directive 2003/71/EC and includes any relevant implementing measure in each relevant member state.
We have not authorized and do not authorize the making of any offer of securities through any financial intermediary on their behalf, other than offers made by the underwriters with a view to the final placement of the securities as contemplated in this prospectus. Accordingly, no purchaser of the securities, other than the underwriters, is authorized to make any further offer of the securities on behalf of us or the underwriters. Each underwriter has represented and agreed that (i) it has not offered or sold and, prior to the expiration of the period of six months from the closing date of this offering, will not offer or sell any shares of our common stock to persons in the United Kingdom except to persons whose ordinary activities involve them in acquiring, holding, managing or disposing of investments, as principal or agent, for the purposes of their businesses or otherwise in circumstances which have not resulted and will not result in an offer to the public in the United Kingdom within the meaning of the Public Offers of Securities Regulations 1995; (ii) it has complied with and will comply with all applicable provisions of the Financial Services Act 1986 with respect to anything done by it in relation to the shares of our common stock in, from or otherwise involving the United Kingdom; and (iii) it has only issued or passed on and will only issue or pass on in the United Kingdom, any document received by it in connection with the issue of the shares of our common stock to a person who is of a kind described in Article 11 (3) of the Financial Services Act 1986 (Investment Advertisements) (Exemptions) Order 1996 or is a person to whom such document may otherwise lawfully be issued or passed on.
From time to time, the underwriters and/or their respective affiliates have directly and indirectly engaged, or may engage, in various financial advisory, investment banking and commercial banking services for us and our affiliates, for which they received, or may receive, customary compensation, fees and expense reimbursement.
160
Table of Contents
The validity of the common stock offered hereby will be passed upon for us by Kirkland & Ellis LLP, New York, New York. Certain partners of Kirkland & Ellis LLP are members of a limited partnership that is an investor in one or more investment funds affiliated with ABRY Partners. Kirkland & Ellis LLP represents entities affiliated with ABRY Partners and its affiliates in connection with legal matters. Legal matters in connection with this offering will be passed upon for the underwriters by Winston & Strawn LLP, Chicago, Illinois.
The consolidated financial statements of HealthPort, Inc. (Successor) as of December 31, 2007 and 2008 and for each of the two years in the period ended December 31, 2008 appearing in this Prospectus and Registration Statement have been audited by Ernst & Young LLP, independent registered public accounting firm, as set forth in their report thereon appearing elsewhere herein, and are included in reliance upon such report given on the authority of such firm as experts in accounting and auditing.
The consolidated financial statements of Companion Technologies Corporation (Predecessor) for the period from January 1, 2006 through December 30, 2006 included in this prospectus and registration statement have been audited by Derrick, Stubbs & Stith, L.L.P., independent registered public accounting firm, as set forth in their report thereon appearing elsewhere herein, and are included in reliance on their report given on their authority as experts in accounting and auditing.
The consolidated financial statements of Smart Holdings Corporation as of September 30, 2004, 2005 and 2006, and for each of the three years in the period ended September 30, 2006 appearing in this Prospectus and Registration Statement have been audited by Ernst & Young LLP, independent registered public accounting firm, as set forth in their report thereon appearing elsewhere herein, and are included in reliance upon such report given on the authority of such firm as experts in accounting and auditing.
The financial statements of ChartOne, Inc. and its Subsidiaries as of December 31, 2007 and for the year then ended included in this Prospectus have been so included in reliance on the report of PricewaterhouseCoopers LLP, independent accountants, given on the authority of said firm as experts in auditing and accounting.
WHERE YOU CAN FIND MORE INFORMATION
We have filed with the SEC a registration statement on Form S-1 under the Securities Act that registers the shares of our common stock to be sold in this offering. The registration statement, including the attached exhibits, contains additional relevant information about us and our common stock. The rules and regulations of the SEC allow us to omit from this document certain information included in the registration statement.
You may read and copy the reports and other information we file with the SEC at the SEC’s Public Reference Room at 100 F Street, N.E., Room 1580, Washington, D.C. 20549. You may also obtain copies of this information by mail from the public reference section of the SEC, 100 F Street, N.E., Washington, D.C. 20549, at prescribed rates. You may obtain information regarding the operation of the public reference room by calling 1-800-SEC-0330. The SEC also maintains a website that contains reports, proxy statements and other information about issuers, like us, who file electronically with the SEC. The address of that website is http://www.sec.gov. This reference to the SEC’s website is an inactive textual reference only and is not a hyperlink.
161
Table of Contents
Upon completion of this offering, we will become subject to the reporting, proxy and information requirements of the Exchange Act, and as a result will be required to file periodic reports, proxy statements and other information with the SEC. These periodic reports, proxy statements and other information will be available for inspection and copying at the SEC’s public reference room and the website of the SEC referred to above, as well as on our website, www.healthport.com. This reference to our website is an inactive textual reference only and is not a hyperlink. The contents of our website are not part of this prospectus, and you should not consider the contents of our website in making an investment decision with respect to our common stock.
We intend to furnish our stockholders with annual reports containing audited financial statements and make available to our stockholders quarterly reports for the first three quarters of each fiscal year containing unaudited interim financial information.
162
Table of Contents
INDEX TO FINANCIAL INFORMATION
F-1
Table of Contents
Report of Independent Registered Public Accounting Firm
The Board of Directors and Shareholders of HealthPort, Inc.
We have audited the accompanying consolidated balance sheets of HealthPort, Inc. as of December 31, 2007 and 2008, and the related consolidated statements of operations, members’ equity, and cash flows for each of the two years in the period ended December 31, 2008. These financial statements are the responsibility of the Company’s management. Our responsibility is to express an opinion on these financial statements based on our audits.
We conducted our audits in accordance with the standards of the Public Company Accounting Oversight Board (United States). Those standards require that we plan and perform the audit to obtain reasonable assurance about whether the financial statements are free of material misstatement. We were not engaged to perform an audit of the Company’s internal control over financial reporting. Our audits included consideration of internal control over financial reporting as a basis for designing audit procedures that are appropriate in the circumstances, but not for the purpose of expressing an opinion on the effectiveness of the Company’s internal control over financial reporting. Accordingly, we express no such opinion. An audit also includes examining, on a test basis, evidence supporting the amounts and disclosures in the financial statements, assessing the accounting principles used and significant estimates made by management, and evaluating the overall financial statement presentation. We believe that our audits provide a reasonable basis for our opinion.
In our opinion, the financial statements referred to above present fairly, in all material respects, the consolidated financial position of HealthPort, Inc. at December 31, 2007 and 2008, and the consolidated results of its operations and its cash flows for each of the two years in the period ended December 31, 2008, in conformity with U.S. generally accepted accounting principles.
Atlanta, Georgia
, 2009
The foregoing report is in the form that will be signed upon the completion of the reorganization described in Note 1 to the consolidated financial statements.
/s/ Ernst & Young LLP
Atlanta, Georgia
October 20, 2009
F-2
Table of Contents
Reports of Independent Auditors
Report of Independent Registered Public Accounting Firm
To the Board of Directors and Stockholder
Companion Technologies Corporation (a wholly-owned subsidiary of HealthPort, Inc.)
We have audited the accompanying consolidated statements of operations, stockholder’s equity, and cash flows for the period from January 1, 2006 through December 30, 2006, of Companion Technologies Corporation (a wholly-owned subsidiary of HealthPort, Inc.). These financial statements are the responsibility of the Company’s management. Our responsibility is to express an opinion on these financial statements based on our audit.
We conducted our audit in accordance with standards of the Public Company Accounting Oversight Board (United States). Those standards require that we plan and perform the audit to obtain reasonable assurance about whether the financial statements are free of material misstatement. An audit includes examining, on a test basis, evidence supporting the amounts and disclosures in the financial statements. An audit also includes assessing the accounting principles used and significant estimates made by management, as well as evaluating the overall financial statement presentation. We believe that our audit provides a reasonable basis for our opinion.
In our opinion, the consolidated financial statements referred to above present fairly, in all material respects, the results of operations of Companion Technologies Corporation (a wholly-owned subsidiary of HealthPort, Inc.) and its cash flows for the period from January 1, 2006 through December 30, 2006, in conformity with U.S. generally accepted accounting principles.
/s/ Derrick, Stubbs & Stith, L.L.P.
Columbia, South Carolina
February 28, 2007
F-3
Table of Contents
Consolidated Balance Sheets
(In Thousands Except Share Amounts)
| Successor | ||||||||||||
| December 31, 2007 |
December 31, 2008 |
June 30, 2009 |
Pro forma as of June 30, 2009 | |||||||||
| (Unaudited) | (Unaudited) | |||||||||||
| Assets |
||||||||||||
| Current assets: |
||||||||||||
| Cash and cash equivalents |
$ | 7,220 | $ | 5,760 | $ | 637 | $ | 637 | ||||
| Trade accounts receivable, net of allowances of approximately $9,909, $14,454 and $15,076 as of December 31, 2007, 2008 and June 30, 2009, respectively |
21,894 | 34,025 | 39,491 | 39,491 | ||||||||
| Other accounts receivable |
579 | 1,814 | 2,034 | 2,034 | ||||||||
| Inventory |
2,741 | 2,693 | 3,505 | 3,505 | ||||||||
| Deferred tax asset |
16,780 | — | — | — | ||||||||
| Prepaid expenses and other current assets |
1,573 | 2,148 | 2,379 | 2,379 | ||||||||
| Total current assets |
50,787 | 46,440 | 48,046 | 48,046 | ||||||||
| Property and equipment, net |
24,345 | 18,259 | 18,231 | 18,231 | ||||||||
| Deferred loan issuance costs |
— | 9,834 | 8,816 | 8,816 | ||||||||
| Other assets |
2,122 | 1,234 | 1,434 | 1,434 | ||||||||
| Goodwill |
128,644 | 177,739 | 177,827 | 177,827 | ||||||||
| Customer base, net of amortization of approximately $4,415, $9,733 and $14,271 as of December 31, 2007, 2008 and June 30, 2009, respectively |
68,361 | 80,244 | 75,706 | 75,706 | ||||||||
| Total assets |
$ | 274,259 | $ | 333,750 | $ | 330,060 | $ | 330,060 | ||||
See accompanying notes.
F-4
Table of Contents
HealthPort, Inc.
Consolidated Balance Sheets
(In Thousands, Except Share Amounts)—(Continued)
| Successor | ||||||||||||||||
| December 31, 2007 |
December 31, 2008 |
June 30, 2009 |
Pro forma as of June 30, 2009 |
|||||||||||||
| (Unaudited) | (Unaudited) | |||||||||||||||
| Liabilities and members’ equity |
||||||||||||||||
| Current liabilities: |
||||||||||||||||
| Accounts payable |
$ | 3,313 | $ | 6,223 | $ | 3,407 | $ | 3,407 | ||||||||
| Accrued expenses |
5,970 | 12,756 | 10,441 | 10,441 | ||||||||||||
| Accrued salaries and bonuses |
5,329 | 7,979 | 9,004 | 9,004 | ||||||||||||
| Current portion of long-term obligations |
3,000 | 9,750 | 11,375 | 11,375 | ||||||||||||
| Current portion of capital leases |
50 | 246 | 838 | 838 | ||||||||||||
| Deferred tax liability |
— | 692 | 692 | 692 | ||||||||||||
| Deferred revenue |
6,982 | 6,888 | 8,832 | 8,832 | ||||||||||||
| Total current liabilities |
24,644 | 44,534 | 44,589 | 44,589 | ||||||||||||
| Long-term obligations, net of current portion |
119,700 | 199,663 | 197,319 | 197,319 | ||||||||||||
| Convertible promissory notes |
7,964 | — | — | — | ||||||||||||
| Capital leases, net of current portion |
241 | 607 | 1,336 | 1,336 | ||||||||||||
| Deferred tax liability |
22,820 | 2,059 | 3,109 | 3,109 | ||||||||||||
| Other liabilities |
1,159 | 2,614 | 3,063 | 3,063 | ||||||||||||
| Senior Preferred shares, unlimited amount authorized, 30,000 shares issued and outstanding, redemption value of $37,200 |
29,007 | 34,196 | 37,072 | 37,072 | ||||||||||||
| Total liabilities |
205,535 | 283,673 | 286,488 | 286,488 | ||||||||||||
| Series C shares, 7,730 shares authorized, issued and outstanding redemption value of $3,698, $2,628, $7,785 as of December 31, 2007 and 2008, and June 30, 2009, respectively |
3,698 | 2,628 | 7,785 | — | ||||||||||||
| Members’ equity: |
||||||||||||||||
| Series A shares, unlimited number authorized, 164,050 shares issued and outstanding as of December 31, 2007 and 218,874 shares issued and outstanding as of December 31, 2008 and June 30, 2009 |
76,187 | 120,468 | 129,362 | — | ||||||||||||
| Series B-1 shares, 10,000,000 authorized, 8,000,000 and 10,000,000 shares issued and outstanding as of December 31, 2007 and 2008, respectively and 9,897,300 shares issued and outstanding as of June 30, 2009 |
197 | 439 | 600 | — | ||||||||||||
| Series B-2 shares, 25,000,000 shares authorized, 20,000,000 and 25,000,000 shares issued and outstanding as of December 31, 2007 and 2008, respectively and 24,742,700 issued and outstanding as of June 30, 2009 |
223 | 524 | 733 | — | ||||||||||||
| Common stock, shares authorized and 16,509,285 shares issued and outstanding at June 30, 2009 |
— | — | — | 17 | ||||||||||||
| Additional paid-in capital |
4,244 | 4,244 | 4,244 | 141,732 | ||||||||||||
| Accumulated deficit |
(15,825 | ) | (77,251 | ) | (98,177 | ) | (98,177 | ) | ||||||||
| Treasury stock, at cost 2,178 shares as of |
— | (975 | ) | (975 | ) | — | ||||||||||
| Total members’ equity |
65,026 | 47,449 | 35,787 | 43,572 | ||||||||||||
| Total liabilities and members’ equity |
$ | 274,259 | $ | 333,750 | $ | 330,060 | $ | 330,060 | ||||||||
See accompanying notes.
F-5
Table of Contents
Consolidated Statements of Operations
(In Thousands, Except Per Share Amounts)
| Predecessor | Successor | |||||||||||||||||||||
| Period From January 1, 2006 Through December 30, 2006 |
Year Ended | Six Months Ended |
||||||||||||||||||||
| December 31, 2007 |
December 31, 2008 |
June 30, 2008 |
June 30, 2009 |
|||||||||||||||||||
| (Unaudited) | ||||||||||||||||||||||
| Net revenues |
$ | 38,267 | $ | 102,369 | $ | 188,169 | $ | 83,822 | $ | 126,806 | ||||||||||||
| Costs of services and products (exclusive of items shown separately below) |
12,663 | 54,318 | 109,973 | 46,829 | 73,934 | |||||||||||||||||
| Bad debt expense (recovery) |
(185 | ) | 3,216 | 9,088 | 4,414 | 5,260 | ||||||||||||||||
| Selling, general and administrative |
31,744 | 40,287 | 56,575 | 25,679 | 30,789 | |||||||||||||||||
| Depreciation and amortization expense |
676 | 6,099 | 12,183 | 5,726 | 7,274 | |||||||||||||||||
| Impairment of goodwill and intangible assets |
— | — | 25,966 | — | — | |||||||||||||||||
| Total operating costs and expenses |
44,898 | 103,920 | 213,785 | 82,648 | 117,257 | |||||||||||||||||
| Income (loss) from operations |
(6,631 | ) | (1,551 | ) | (25,616 | ) | 1,174 | 9,549 | ||||||||||||||
| Interest income (expense), net |
60 | (10,333 | ) | (20,906 | ) | (8,781 | ) | (14,956 | ) | |||||||||||||
| Change in fair value of interest rate swaps |
— | 7 | (1,945 | ) | — | (416 | ) | |||||||||||||||
| Equity in net gains of affiliates |
1,426 | — | — | — | — | |||||||||||||||||
| Loss on transfer of investment in affiliate |
(223 | ) | — | — | — | — | ||||||||||||||||
| Loss from continuing operations before income taxes |
(5,368 | ) | (11,877 | ) | (48,467 | ) | (7,607 | ) | (5,823 | ) | ||||||||||||
| Income tax benefit (expense) |
853 | 5,258 | 1,409 | 1,501 | (1,050 | ) | ||||||||||||||||
| Loss from continuing operations |
(4,515 | ) | (6,619 | ) | (47,058 | ) | (6,106 | ) | (6,873 | ) | ||||||||||||
| Loss from discontinued operations, net of tax |
— | (732 | ) | (1,426 | ) | (936 | ) | — | ||||||||||||||
| Loss on sale of discontinued operations, net of tax |
— | — | (1,306 | ) | — | — | ||||||||||||||||
| Net loss |
$ | (4,515 | ) | $ | (7,351 | ) | $ | (49,790 | ) | $ | (7,042 | ) | $ | (6,873 | ) | |||||||
| Unaudited pro forma net loss per share common stock |
||||||||||||||||||||||
| Basic and diluted |
$ | (0.74 | ) | $ | (3.72 | ) | $ | (0.57 | ) | $ | (0.42 | ) | ||||||||||
| Unaudited pro forma weighted average common shares outstanding |
||||||||||||||||||||||
| Basic and diluted |
9,840 | 13,401 | 12,372 | 16,492 | ||||||||||||||||||
See accompanying notes.
F-6
Table of Contents
Consolidated Statements of Changes in Members’ Equity
(In Thousands Except Share Amounts)
| Common Stock | Series A Shares | Series B-1 Shares | Series B-2 Shares | Additional Paid-In Capital |
Accumulated Deficit |
Treasury Stock | Total Members’ Equity |
||||||||||||||||||||||||||||||||||
| Shares | Amount | Shares | Amount | Shares | Amount | Shares | Amount | Shares | Amount | ||||||||||||||||||||||||||||||||
| Predecessor balance at |
1,000 | $ | 100 | — | $ | — | — | $ | — | — | $ | — | $ | 45,700 | $ | (40,436 | ) | — | $ | — | $ | 5,364 | |||||||||||||||||||
| Capital contributions |
— | — | — | — | — | — | — | — | 5,000 | — | — | — | 5,000 | ||||||||||||||||||||||||||||
| Net loss |
— | — | — | — | — | — | — | — | — | (4,515 | ) | — | — | (4,515 | ) | ||||||||||||||||||||||||||
| Predecessor balance at |
1,000 | $ | 100 | — | $ | — | — | $ | — | — | $ | — | $ | 50,700 | $ | (44,951 | ) | — | $ | — | $ | 5,849 | |||||||||||||||||||
| Successor balance at |
— | $ | — | — | $ | — | — | $ | — | — | $ | — | $ | — | $ | — | — | $ | — | $ | — | ||||||||||||||||||||
| Issuance of Series A shares on December 29, 2006 |
— | — | 90,000 | 37,194 | 4,875,000 | — | 12,187,500 | — | 241 | — | — | — | 37,435 | ||||||||||||||||||||||||||||
| Issuance of Series A shares on |
— | — | 74,050 | 30,602 | — | — | — | — | — | — | — | — | 30,602 | ||||||||||||||||||||||||||||
| Issuance of incentive shares |
— | — | — | — | 3,125,000 | — | 7,812,500 | — | — | — | — | — | — | ||||||||||||||||||||||||||||
| Capital contribution |
— | — | — | — | — | — | — | — | 4,003 | — | — | — | 4,003 | ||||||||||||||||||||||||||||
| Equity-based compensation |
— | — | — | — | — | 197 | — | 223 | — | — | — | — | 420 | ||||||||||||||||||||||||||||
| Yield on Series A shares |
— | — | — | 8,391 | — | — | — | — | — | (8,391 | ) | — | — | — | |||||||||||||||||||||||||||
| Series C appreciation |
— | — | — | — | — | — | — | — | — | (83 | ) | — | — | (83 | ) | ||||||||||||||||||||||||||
| Net loss |
— | — | — | — | — | — | — | — | — | (7,351 | ) | — | — | (7,351 | ) | ||||||||||||||||||||||||||
| Successor balance at December 31, 2007 |
— | — | 164,050 | 76,187 | 8,000,000 | 197 | 20,000,000 | 223 | 4,244 | (15,825 | ) | — | — | 65,026 | |||||||||||||||||||||||||||
| Issuance of Series A shares |
— | — | 54,824 | 31,575 | — | — | — | — | — | — | — | — | 31,575 | ||||||||||||||||||||||||||||
| Issuance of incentive shares |
— | — | — | — | 5,000,000 | — | 12,500,000 | — | — | — | — | — | — | ||||||||||||||||||||||||||||
| Forfeiture of incentive shares |
— | — | — | — | (3,000,000 | ) | — | (7,500,000 | ) | — | — | — | — | — | — | ||||||||||||||||||||||||||
| Repurchase of Series A shares |
— | — | — | — | — | — | — | — | — | — | (2,178 | ) | (975 | ) | (975 | ) | |||||||||||||||||||||||||
| Equity-based compensation |
— | — | — | — | — | 242 | — | 301 | — | — | — | — | 543 | ||||||||||||||||||||||||||||
| Yield on Series A shares |
— | — | — | 12,706 | — | — | — | — | — | (12,706 | ) | — | — | — | |||||||||||||||||||||||||||
| Series C depreciation |
— | — | — | — | — | — | — | — | — | 1,070 | — | — | 1,070 | ||||||||||||||||||||||||||||
| Net loss |
— | — | — | — | — | — | — | — | — | (49,790 | ) | — | — | (49,790 | ) | ||||||||||||||||||||||||||
| Successor balance at December 31, 2008 |
— | — | 218,874 | 120,468 | 10,000,000 | 439 | 25,000,000 | 524 | 4,244 | (77,251 | ) | (2,178 | ) | (975 | ) | 47,449 | |||||||||||||||||||||||||
| Forfeiture of incentive shares |
— | — | — | — | (102,700 | ) | — | (257,300 | ) | — | — | — | — | — | — | ||||||||||||||||||||||||||
| Equity-based compensation |
— | — | — | — | — | 161 | — | 209 | — | — | — | — | 370 | ||||||||||||||||||||||||||||
| Yield on Series A shares |
— | — | — | 8,894 | — | — | — | — | — | (8,894 | ) | — | — | — | |||||||||||||||||||||||||||
| Series C appreciation |
— | — | — | — | — | — | — | — | — | (5,159 | ) | — | — | (5,159 | ) | ||||||||||||||||||||||||||
| Net loss |
— | — | — | — | — | — | — | — | — | (6,873 | ) | — | — | (6,873 | ) | ||||||||||||||||||||||||||
| Successor balance at June 30, 2009 (unaudited) |
— | $ | — | 218,874 | $ | 129,362 | 9,897,300 | $ | 600 | 24,742,700 | $ | 733 | $ | 4,244 | $ | (98,177 | ) | $ | (2,178 | ) | $ | (975 | ) | $ | 35,787 | ||||||||||||||||
See accompanying notes.
F-7
Table of Contents
Consolidated Statements of Cash Flows
(In Thousands)
| Predecessor | Successor | |||||||||||||||||||||
| Period From January 1, 2006 Through December 30, 2006 |
Year Ended | Six Months Ended |
||||||||||||||||||||
| December 31, 2007 |
December 31, 2008 |
June 30, 2008 |
June 30, 2009 |
|||||||||||||||||||
| (Unaudited) | ||||||||||||||||||||||
| Operating activities |
||||||||||||||||||||||
| Net loss |
$ | (4,515 | ) | $ | (7,351 | ) | $ | (49,790 | ) | $ | (7,042 | ) | $ | (6,873 | ) | |||||||
| Less loss from discontinued operations |
— | (732 | ) | (1,426 | ) | (936 | ) | — | ||||||||||||||
| Less loss on sale of discontinued operations |
— | — | (1,306 | ) | — | — | ||||||||||||||||
| Loss from continuing operations |
(4,515 | ) | (6,619 | ) | (47,058 | ) | (6,106 | ) | (6,873 | ) | ||||||||||||
| Adjustments to reconcile net loss to net cash (used in) provided by operating activities: |
||||||||||||||||||||||
| Depreciation and amortization |
676 | 9,625 | 15,112 | 7,671 | 7,872 | |||||||||||||||||
| Equity in net gains of affiliates |
(1,426 | ) | — | — | — | — | ||||||||||||||||
| Impairment of goodwill and intangible assets |
— | — | 25,966 | — | — | |||||||||||||||||
| Provision for doubtful accounts |
(185 | ) | 3,216 | 9,088 | 4,414 | 5,260 | ||||||||||||||||
| Deferred taxes |
767 | (5,702 | ) | (4,754 | ) | (2,097 | ) | 1,050 | ||||||||||||||
| Equity-based compensation |
— | 420 | 543 | (5 | ) | 370 | ||||||||||||||||
| Non cash interest expense |
— | 3,086 | 4,312 | 2,927 | 3,632 | |||||||||||||||||
| Amortization of deferred finance costs |
— | — | 554 | — | 1,018 | |||||||||||||||||
| Changes in operating assets and liabilities (net of effects from business acquisitions): |
||||||||||||||||||||||
| Trade accounts receivable |
184 | (6,642 | ) | (5,853 | ) | (5,241 | ) | (10,726 | ) | |||||||||||||
| Other accounts receivable |
— | 2,559 | (1,153 | ) | (94 | ) | 633 | |||||||||||||||
| Inventory |
— | (2,210 | ) | 48 | 311 | (812 | ) | |||||||||||||||
| Prepaid expenses and other assets |
412 | 2,159 | 268 | 378 | (784 | ) | ||||||||||||||||
| Accounts payable |
760 | (659 | ) | 2,353 | (1,230 | ) | (2,816 | ) | ||||||||||||||
| Accrued salaries and bonuses |
— | 863 | 278 | 953 | 1,025 | |||||||||||||||||
| Accrued expenses |
— | 2,983 | 1,098 | (842 | ) | (1,866 | ) | |||||||||||||||
| Deferred revenue |
214 | 6,982 | (103 | ) | (39 | ) | 1,944 | |||||||||||||||
| Due to Parent |
(4,693 | ) | — | — | — | — | ||||||||||||||||
| Net cash (used in) provided by operating activities of continuing operations |
(7,806 | ) | 10,061 | 699 | 1,000 | (1,073 | ) | |||||||||||||||
| Net cash used in operating activities of discontinued operations |
— | (732 | ) | (1,426 | ) | (936 | ) | — | ||||||||||||||
| Net cash (used in) provided by operating activities |
(7,806 | ) | 9,329 | (727 | ) | 64 | (1,073 | ) | ||||||||||||||
| Investing activities |
||||||||||||||||||||||
| Purchase of property and equipment |
(1,336 | ) | (1,512 | ) | (1,290 | ) | (1,339 | ) | (1,586 | ) | ||||||||||||
| Disposal of fixed assets |
699 | — | — | — | — | |||||||||||||||||
| Issuance of notes receivable |
— | — | (1,075 | ) | (250 | ) | (500 | ) | ||||||||||||||
| Acquisition of a business, net of cash acquired |
— | (195,402 | ) | (96,495 | ) | (610 | ) | (88 | ) | |||||||||||||
| Transfer of investment in affiliate |
3,619 | — | — | — | — | |||||||||||||||||
| Loss on transfer of investment in affiliate |
223 | — | — | — | — | |||||||||||||||||
| Distributions from investees |
1,580 | — | — | — | — | |||||||||||||||||
| Net cash provided by (used in) investing activities of continuing operations |
4,785 | (196,914 | ) | (98,860 | ) | (2,199 | ) | (2,174 | ) | |||||||||||||
| Net cash used in investing activities of discontinued operations |
— | — | (1,306 | ) | — | — | ||||||||||||||||
| Net cash provided by (used in) investing activities |
4,785 | (196,914 | ) | (100,166 | ) | (2,199 | ) | (2,174 | ) | |||||||||||||
| Financing activities |
||||||||||||||||||||||
| Borrowings under term loan |
— | 120,000 | 130,000 | — | — | |||||||||||||||||
| Repayments of term loan |
— | — | (120,000 | ) | (1,500 | ) | (4,875 | ) | ||||||||||||||
| Net borrowings under revolving line of credit |
— | 2,700 | 1,300 | 1,000 | 3,400 | |||||||||||||||||
| Borrowings under convertible notes payable |
— | 7,500 | — | — | — | |||||||||||||||||
| Repayments of convertible notes payable |
— | — | (7,500 | ) | — | — | ||||||||||||||||
| Borrowings under subordinated debt |
— | — | 75,000 | — | — | |||||||||||||||||
| Payments under capital leases |
— | — | (70 | ) | (38 | ) | (401 | ) | ||||||||||||||
| Deferred loan costs incurred |
— | — | (10,388 | ) | — | — | ||||||||||||||||
| Issuance of Senior Preferred shares |
— | 26,385 | — | — | — | |||||||||||||||||
| Issuance of Common Stock |
— | 34,217 | 31,575 | — | — | |||||||||||||||||
| Repurchase of Common Stock |
— | — | (484 | ) | — | — | ||||||||||||||||
| Capital contributions |
5,000 | 4,003 | — | — | — | |||||||||||||||||
| Net cash provided by (used in) financing activities |
5,000 | 194,805 | 99,433 | (538 | ) | (1,876 | ) | |||||||||||||||
| Net change in cash and cash equivalents |
1,979 | 7,220 | (1,460 | ) | (2,673 | ) | (5,123 | ) | ||||||||||||||
| Cash and cash equivalents, beginning of year |
2,822 | — | 7,220 | 7,220 | 5,760 | |||||||||||||||||
| Cash and cash equivalents, end of year |
$ | 4,801 | $ | 7,220 | $ | 5,760 | $ | 4,547 | $ | 637 | ||||||||||||
| Supplemental disclosures of cash flow information |
||||||||||||||||||||||
| Cash paid for interest |
$ | — | $ | 10,479 | $ | 16,813 | $ | 5,806 | $ | 9,561 | ||||||||||||
| Assets acquired under capital leases |
$ | — | $ | 291 | $ | 726 | $ | 317 | $ | 1,722 | ||||||||||||
See accompanying notes.
F-8
Table of Contents
Notes to Consolidated Financial Statements
1. Summary of Significant Accounting Policies
Organization and Business
We provide healthcare information services and technology solutions to hospitals, health systems, physician practices and authorized recipients of protected health records. We offer release of information services (ROI) of health records using our expertise and technology to efficiently manage the fulfillment of requests for medial records in an accurate, regulatory-compliant and timely manner. We also offer software and other services to our customers that complement our ROI solutions. Our ROI solutions enable our customers to reduce staffing levels for non-critical, time consuming and labor intensive healthcare information functions, allowing them to increase their focus on patient care. In addition, we provide proprietary software to physicians’ offices and hospitals, which enables the electronic submission of claims to third-party payers. For financial reporting purposes, our business is aggregated into two reportable segments in accordance with the Statement of Financial Accounting Standards No. 131 Disclosures about Segments of an Enterprise and Related Information (“SFAS No. 131”) (See Note 18).
CT Technologies, LLC was formed December 19, 2006. On December 31, 2006, pursuant to a stock purchase agreement, CT Technologies, LLC purchased 100% of the outstanding stock of Companion Technologies Corporation (“Companion”), a software company, located in South Carolina.
Corporate Reorganization
HealthPort, Inc. (the “Company”) was formed on August 11, 2009 as a new Delaware corporation that has not, to date, conducted any activities other than those incident to our formation and the preparation of this registration statement. We were formed solely for the purpose of reorganizing the organizational structure of CT Technologies Holdings, LLC so that the issuer is a corporation rather than a limited liability company and so that our existing investors will own common stock rather than equity interests in a limited liability company.
On , each member of CT Technologies Holdings, LLC contributed all of their equity interests, including all Series A, B and C shares and all senior preferred shares, in CT Technologies Holdings, LLC to us. In connection with the contribution, we issued our common stock or Senior Preferred Stock, as the case may be, in exchange for the contributing member’s equity interests in accordance with the terms of the CT Technologies Holdings, LLC Agreement. After each member contributed all of their equity interests in CT Technologies Holdings, LLC to us, CT Technologies Holdings, LLC became our wholly owned subsidiary and each contributing member became our stockholder. We refer to these events as our corporate reorganization.
As a result of the corporate reorganization, CT Technologies Holdings, LLC’s Series A and Series C shares were exchanged for 15,088,841 shares of our common stock. In addition, outstanding Series B-1 and B-2 shares that had vested on or prior to (the date of our corporate reorganization) were exchanged for 1,420,445 shares of our common stock. Shares of CT Technologies Holdings, LLC’s senior preferred shares were exchanged for shares of our Senior Preferred Stock. The Senior Preferred Stock has substantially similar preferences, powers, rights, limitations and restrictions as the senior preferred shares.
The corporate reorganization had no affect on our operations, which continue to be conducted through our operating subsidiaries.
F-9
Table of Contents
HealthPort, Inc.
Notes to Consolidated Financial Statements—(Continued)
1. Summary of Significant Accounting Policies—Continued
Basis of Presentation
The consolidated statements of financial position, operations, changes in members’ equity and cash flows captioned as “Successor Company” represent the consolidated financial statements of the Company from January 1, 2007 through June 30, 2009. Prior to the acquisition of Companion, the Company had no significant operations. The consolidated statements of operations, members’ equity, and cash flows captioned as “Predecessor Company” include those of Companion from January 1, 2006 up to the date of acquisition, December 30, 2006. There were no material operating results on December 31, 2006 as it fell on a Sunday. As a result of the acquisition of 100% of the stock in Companion, the purchase price was allocated to its assets and liabilities, resulting in a new accounting basis. The comparability of operating results for the Predecessor Company and the Successor Company are affected by the purchase accounting adjustments.
The consolidated financial statements for the Successor Company include the accounts of HealthPort, Inc. (the “Company”) and its wholly owned subsidiaries. The consolidated financial statements for the Predecessor Company include the accounts of Companion Technologies Corporation (“Companion”) and its wholly owned subsidiary. All significant intercompany accounts and transactions have been eliminated in consolidation.
Unaudited Interim Financial Information
The accompanying interim consolidated balance sheet as of June 30, 2009, the consolidated statements of operations for the six months ended June 30, 2008 and 2009, the consolidated statements of cash flows for the six months ended June 30, 2008 and 2009 and the consolidated statement of members’ equity for the six months ended June 30, 2009 are unaudited. These unaudited interim consolidated financial statements have been prepared in accordance with U.S. generally accepted accounting principles. In the opinion of the Company’s management, the unaudited interim consolidated financial statements have been prepared on the same basis as the audited consolidated financial statements and include all adjustments necessary for the fair presentation of the Company’s statement of financial position at June 30, 2009, its results of operations and its cash flows for the six months ended June 30, 2008 and 2009. The results for the six months ended June 30, 2009 may not be indicative of the results to be expected for the year ending December 31, 2009.
Unaudited Pro forma Financial Information
The pro forma balance sheet gives effect to the change in capitalization on October , 2009 resulting from the exchange of CT Technologies Holdings, LLC’s senior preferred shares for our senior preferred stock and the exchange of CT Technologies Holdings, LLC’s Series A, B, and C shares for our common stock. The pro forma balance sheet does not reflect any initial public offering proceeds.
The accompanying consolidated statement of operations discloses unaudited pro forma earnings per share for the years ended December 31, 2007 and 2008 and the six months ended June 30, 2008 and 2009 giving affect to the exchange of CT Technologies Holdings, LLC’s senior preferred shares for our senior preferred stock and the exchange of CT Technologies Holdings, LLC’s Series A, B and C shares for our common stock.
F-10
Table of Contents
HealthPort, Inc.
Notes to Consolidated Financial Statements—(Continued)
1. Summary of Significant Accounting Policies—Continued
Use of Estimates
The preparation of the consolidated financial statements in conformity with U.S. generally accepted accounting principles requires management to make estimates and assumptions that affect the reported amounts of assets and liabilities and the disclosure of contingent assets and liabilities at the dates of the financial statements and the reported amounts of net revenue and expenses during the reporting periods. Actual results could differ from those estimates and the differences could be material. Certain estimates are required in recording net revenues and determining provisions for doubtful accounts. Inherent in these estimates is the risk that they will have to be revised or updated as additional information becomes available to management.
Cash and Cash Equivalents
We consider all highly liquid, unrestricted investments with an original maturity date of three months or less to be cash equivalents.
Revenue Recognition
Net revenue consists primarily of (a) release of information services, (b) software and hardware related fees and associated services, (c) post contract customer support, (d) subscription and transaction fees, and (e) consulting revenues received under fixed fee service contracts. Although the vast majority of our revenue is from services we do have revenue from products. In certain situations our services and products are recorded separately. For multi-element software arrangements, the services and products are bundled and we are unable to provide a breakdown between the service and product components; therefore our net revenue is presented on a combined basis.
Billings may not coincide with the recognition of revenue. Unbilled accounts receivable occur when revenue recognition precedes billing to the customer, and arise primarily from sales with predetermined billing schedules. Deferred revenue occurs when billing to the customer precedes revenue recognition, and arises primarily from cash contractually due from customers prior to delivery of the health record, maintenance revenue billed and collected in advance of performance of the maintenance activity and prepayments received from customers for transaction processing to be performed for a specified future period.
Release of Information Services Segment
Revenue is recognized as release of information services are performed and health records are delivered to customers. Release of information revenue is generally comprised of a base fee and a per-page fee depending on the number of pages made.
In accordance with Staff Accounting Bulletin No. 104, Revenue Recognition (“SAB 104”), we recognize our ROI revenue when (a) there is persuasive evidence of an arrangement, (b) the fee is fixed or determinable, (c) services have been rendered and payment has been contractually earned, and (d) collectability is reasonably assured.
F-11
Table of Contents
HealthPort, Inc.
Notes to Consolidated Financial Statements—(Continued)
1. Summary of Significant Accounting Policies—Continued
In accordance with Emerging Issues Task Force (“EITF” 00-10), Accounting for Shipping and Handling Fees and Costs, we recognize revenue for shipping and handling costs related to the delivery of records to customers on a gross basis, and the corresponding shipping and handling costs are classified as costs of services and products in the accompanying consolidated statements of operations. Shipping and handling costs included in revenue and costs of services and products were approximately $0.0 million, $3.8 million and $7.9 million for the period from January 1, 2006 through December 30, 2006 and for the years ended December 31, 2007 and 2008, respectively, and $4.4 million and $5.2 million for the six months ended June 30, 2008 and 2009, respectively.
We account for certain contracts using the proportional performance method based upon the pattern of performance of a particular medical record order. The proportional performance method is used only for contracts where project stages are clearly defined and can be invoiced and where the contract contains enforceable rights by both parties. We review contract prices and cost estimates and reflect adjustments in the period when the estimates are revised.
For certain of our release of information customers, cash is due prior to the delivery of the health records to the customer. Recognition of revenue relating to these customers and related direct costs are deferred until payment is received and health records are delivered. See Deferred Revenue below.
Software and Other Services Segment
We recognize software license revenue in accordance with Statement of Position 97-2, Software Revenue Recognition (“SOP 97-2”), as amended by Statement of Position 98-9, Modification of SOP 97-2 Software Revenue Recognition, with Respect to Certain Transactions (“SOP 98-9”) when the following criteria are met: (1) persuasive evidence of an arrangement is obtained; (2) delivery of the product has occurred; (3) the license fee is fixed or determinable; and (4) collection is probable. SOP 98-9 requires recognition of revenue using the “residual method” when (a) there is vendor-specific objective evidence of the fair values of all undelivered elements in a multiple-element arrangement that is not accounted for using long-term contract accounting; (b) vendor-specific objective evidence of fair value does not exist for one or more of the delivered elements in the arrangement; and (c) all revenue-recognition criteria in SOP 97-2, other than the requirement for vendor-specific objective evidence of the fair value of each delivered element of the arrangement, are satisfied. When software is licensed under a term arrangement, the related fees are recognized as revenue ratably over the contractual term of the agreement.
In accordance with SOP 97-2, when VSOE is able to be established for all elements, license fee revenue is recorded using the relative fair value method. If we are only able to establish VSOE for undelivered elements, we account for license fee revenue using the residual method. Historically for our software license agreements, we have not been able to establish VSOE for delivered and undelivered elements due to wide variation in actual pricing. Since we have not objectively determined the fair value of any undelivered element included in bundled software and service arrangements, including implied maintenance, we account for these arrangements using the combined services approach. Under this approach, the entire arrangement fee is
F-12
Table of Contents
HealthPort, Inc.
Notes to Consolidated Financial Statements—(Continued)
1. Summary of Significant Accounting Policies—Continued
recognized ratably over the period during which the services are expected to be performed or the post contract support (“PCS”) period (which is typically 12 months), whichever is longer, once the software has been delivered and the provision of both services has commenced, as long as all of the other basic revenue recognition criteria of SOP 97-2 have been met.
PCS is recognized ratably over the period of the PCS arrangements. These are typically twelve month agreements with annual auto renewals. Subscription fees, including our Application Service Provider (“ASP”) based solutions, are recognized ratably over the contracted agreement period. Customers have access to the software applications while the data is hosted by either our servers or via third parties. Our customers do not take physical possession of the software application. Implementation fees are typically billed at the beginning of the arrangement and recognized as revenue over the contract period.
We also generate revenue from transactional-based service contracts. Revenues under these arrangements are recognized as transactions are processed and delivered. They are typically transaction price based contracts.
Revenues from fixed-fee consulting services are recognized as services are performed and delivered.
Deferred Revenue
Deferred revenue consists of unrecognized revenue related to advanced customer invoicing or customer payments received prior to revenue being realized and earned. Substantially all deferred revenue consists of (i) cash contractually due from customers prior to delivery of health records and (ii) cash received from undelivered software and implementation fees. The following table summarizes deferred revenue by operating segment (in thousands).
| 2007 | 2008 | June 30, 2009 | |||||||
| (unaudited) | |||||||||
| ROI |
$ | 2,694 | $ | 3,195 | $ | 4,386 | |||
| Software and other services |
4,288 | 3,693 | 4,446 | ||||||
| Total deferred revenue |
$ | 6,982 | $ | 6,888 | $ | 8,832 | |||
Release of Information Services Segment
For certain of our release of information customers, cash is due prior to the delivery of the records to the customer. Recognition of revenue relating to these customers and related direct costs are deferred until payment is received and health records are delivered. As of December 31, 2007, 2008 and June 30, 2009, approximately $2.7 million, $3.2 million and $4.4 million, respectively, of revenue has been deferred relating to these customers and included as deferred revenue in the accompanying consolidated balance sheets. Direct costs associated with the deferred revenue as of December 31, 2007, 2008 and June 30, 2009 were approximately $1.6 million, $1.8 million and $2.6 million, respectively, and are included in inventory in the accompanying consolidated balance sheets.
F-13
Table of Contents
HealthPort, Inc.
Notes to Consolidated Financial Statements—(Continued)
1. Summary of Significant Accounting Policies—Continued
Software and Other Services Segment
Deferred software and implementation fees include (i) software license fees which result from undelivered products or specified enhancements, acceptance provisions, or software license arrangements that lack VSOE and are not separable from implementation, consulting, or other services; (ii) software support fee and system deposits which represent customer advance payments for services not yet rendered; and (iii) implementation fees that are received at the beginning of a subscription contract. These fees are deferred and amortized over the expected period of benefit, which is the greater of the contracted subscription period or the projected customer relationship period. Software and implementation fees are also deferred when the fees are contingent upon meeting a performance target that has not yet been achieved. Deferred revenue relating to these arrangements as of December 31, 2007, 2008 and June 30, 2009 was approximately $4.3 million, $3.7 million and $4.4 million, respectively. Direct costs associated with the deferred revenue as of December 31, 2007, 2008 and June 30, 2009, were approximately $0.2 million, $0.3 million and $0.4 million, respectively, and are included in inventory in the accompanying consolidated balance sheets.
Inventory
Inventory consists primarily of direct costs associated with health records which have been scanned but have not been sent to the customer and which are recorded at cost and direct costs associated with software and implementation fees.
Also included in inventory are computer parts, software, equipment and other supplies which are accounted for at the lower of cost or market. Cost is determined using specific identification for serialized items and average cost for non-serialized items. Management monitors obsolescence of inventory and records an allowance for obsolescence to reduce the carrying value of inventory to its net realizable value, when necessary. The allowance for obsolescence as of December 31, 2007, 2008 and June 30, 2009 was approximately $52,000, $26,000 and $32,000, respectively.
Cost of Services and Products
Cost of services and products consists primarily of costs related to the services we provide to our customers and costs associated with the operation and maintenance of our network. Costs of services and products includes (i) personnel costs associated with production, information technology operations, customer support, operations and other personnel, (ii) supplies, shipping and handling costs, (iii) other expenses related to revenues (iv) facilities expenses and (v) equipment maintenance, which vary less directly with our revenue due to the fixed or semi-fixed nature of these expenses.
Cost of services and products also consists of costs related to the delivery and implementation of software solutions and products to our customers. These costs include (i) software and hardware costs and associated maintenance, (ii) ASP hosting costs and (iii) data and telecommunications costs, all of which generally vary with our revenues.
F-14
Table of Contents
HealthPort, Inc.
Notes to Consolidated Financial Statements—(Continued)
1. Summary of Significant Accounting Policies—Continued
Deferred Loan Issuance Costs
Deferred loan issuance costs are approximately $9.8 million as of December 31, 2008 and $8.8 million as of June 30, 2009. Deferred loan issuance costs represent loan origination fees and other costs paid to multiple lenders associated with the Company’s term loan, revolving line of credit, incremental term loan and subordinated notes during the year ended December 31, 2008. Deferred loan issuance costs are amortized to interest expense over the estimated terms of the associated debt agreements of 5 or 5.5 years using the effective interest method.
Accumulated amortization as of December 31, 2008 and June 30, 2009 was approximately $0.6 million and $1.6 million, respectively.
Property and Equipment
Property and equipment are stated at cost, net of accumulated depreciation and amortization and include the capitalized portion of internal use product development costs. Depreciation of property and equipment (which includes amortization of capitalized internal use and internally developed software for customers) is computed using the straight-line method over the estimated useful lives of the respective assets, which range from three to eight years, or the term of the related lease if less than the useful life.
We evaluate the impairment or disposal of our property and equipment in accordance with the provisions of Statement of Financial Accounting Standards No. 144, Accounting for the Impairment of Long-Lived Assets (“SFAS No. 144”). Under SFAS No. 144, we evaluate the recoverability of property and equipment whenever events or changes in circumstances indicate that the carrying amount of an asset may not be recoverable, or whenever management has committed to an asset disposal plan. If the aforementioned indicators occur, recoverability is determined by comparing the net carrying value of an asset to its undiscounted cash flows.
Product Development Costs
Our product development costs include expenses incurred in the application development stage or prior to technological feasibility being reached and are expensed as incurred as required by SFAS No. 2, Accounting for Research and Development Costs. Internal-use software development costs are capitalized in accordance with Statement of Position 98-1, Accounting for the Costs of Computer Software Developed or Obtained for Internal Use (“SOP 98-1”). External-use software development costs are capitalized when the technological feasibility of a software product has been established in accordance with Statement of Financial Accounting Standards No. 86, Accounting for the Costs of Computer Software to be Sold, Leased or Otherwise Marketed (“SFAS No. 86”).
Capitalized software costs are amortized on a straight-line basis over the estimated useful lives of the related software applications of up to five years. We periodically evaluate the useful life of our capitalized software costs. We capitalized approximately $0.0 million, $0.1 million and $0.3 million for the period from January 1, 2006 through December 30, 2006 and for the years ended December 31, 2007 and 2008, respectively, and $0.1 million and $0.5 million for the six months ended June 30, 2008 and 2009, respectively, relating to the development of computer
F-15
Table of Contents
HealthPort, Inc.
Notes to Consolidated Financial Statements—(Continued)
1. Summary of Significant Accounting Policies—Continued
software products to be sold, licensed or otherwise marketed under SFAS No. 86 and costs of computer software developed or obtained for internal use under SOP 98-1. Research and development costs charged to expense totaled approximately $4.0 million, $4.7 million and $5.0 million for the period from January 1, 2006 through December 30, 2006 and for the years ended December 31, 2007 and 2008, respectively, and $2.3 million and $2.4 million for the six months ended June 30, 2009 and 2008, respectively, relating to the development of computer software products to be sold, licensed or otherwise marketed under SFAS No. 86. Research and development costs are included in selling, general, and administrative expenses in the accompanying consolidated statements of operations.
Goodwill and Other Intangible Assets – Indefinite Life
For identified intangible assets acquired in business combinations, we allocate purchase consideration based on the fair value of intangible assets acquired in accordance with Statement of Financial Accounting Standards No. 141, Business Combinations (“SFAS No. 141”).
We account for goodwill in accordance with Statement of Financial Accounting Standards No. 142, Goodwill and Other Intangible Assets (“SFAS No. 142”). In accordance with SFAS No. 142, goodwill represents the excess of cost over the fair value of net tangible and identifiable intangible assets acquired and is not amortized. In conjunction with its acquisitions, management of the Company has reviewed the allocation of the excess of costs (including costs incurred related to the acquisition) over net assets acquired, and has determined, to date, that these costs (goodwill) are allocated to the applicable reporting unit.
Identifiable Intangible and Long-Lived Assets – Definite Life
Identifiable intangible assets result from acquisitions accounted for under the purchase method. Our definite lived identifiable intangible assets consist of customer bases and internally developed software acquired in our acquisitions. The customer bases are amortized on a straight-line basis over 10 years. Long-lived assets also include property and equipment including internally developed software.
In accordance with SFAS No. 144, the carrying values of these identifiable intangible assets and other long-lived assets are reviewed whenever events or changes in circumstances indicate that the carrying amount of an asset may not be recoverable. If this review indicates that the asset will not be recoverable, as determined based on the undiscounted cash flows of the operating entity or asset over the remaining amortization period, the carrying value of the asset is reduced to its fair value.
Advertising Costs
Advertising costs are expensed as incurred. Advertising expense was approximately $0.6 million, $0.9 million and $1.3 million for the period from January 1, 2006 through December 30, 2006 and for the years ended December 31, 2007 and 2008, respectively, and $0.8 million and $0.6 million for the six months ended June 30, 2008 and 2009, respectively.
F-16
Table of Contents
HealthPort, Inc.
Notes to Consolidated Financial Statements—(Continued)
1. Summary of Significant Accounting Policies—Continued
Allowance for Doubtful Accounts
We closely monitor our cash collection trends and the aging of accounts receivable. Provisions for doubtful accounts are primarily estimated based on cash collection analyses and accounts receivable aging reports. In evaluating the adequacy of allowances for doubtful accounts, we assess a number of factors, including historical collection experience, customer concentrations, past due accounts, current economic trends and changes in our customer payment terms. Accounts receivable are written off after collection efforts have been pursued in accordance with our policies and procedures. Inherent in this estimate is the risk that it will need to be revised or updated, with the changes recorded in subsequent periods, as additional information becomes available to us.
Concentrations of Credit Risk
Financial instruments that potentially subject us to concentrations of credit risk consist primarily of trade receivables and cash in excess of federally insured limits. We maintain substantially all of our cash in financial institutions. As of December 31, 2007, 2008, and June 30, 2009 substantially all of our cash was invested in checking accounts that bear minimal risk and are available on demand. We had cash balances of approximately $7.2 million, $5.8 million and $0.6 million as of December 31, 2007, 2008 and June 30, 2009, respectively.
Revenue is earned throughout the United States. We recognize receivables for services provided to our customers and do not require collateral on the receivables. Our exposure to credit risk with respect to accounts receivable is limited due to broad dispersion of credit risk among our various customers and requestors.
Financial Instruments
Statement of Financial Accounting Standards No. 107 Disclosure About Fair Value of Financial Instruments, (“SFAS No. 107”), requires certain disclosures regarding the estimated fair values of financial instruments. The carrying value of cash and cash equivalents, net accounts receivable, accounts payable and accrued liabilities reflected in the consolidated financial statements approximate their estimated fair values due to their short-term nature. The estimated fair value of long-term debt, which is disclosed in Note 6 was determined by comparison of available yields and similar financing arrangements.
Derivative financial instruments are accounted for in accordance with Statement of Financial Accounting Standards No. 133, Accounting for Derivative Instruments and Hedging Activities (“SFAS No. 133”). SFAS No. 133 requires companies to recognize derivative instruments as either assets or liabilities in the balance sheet at fair value. See Note 6 for further discussions regarding our outstanding interest rate swap contracts.
Discontinued Operations
In August 2008, we sold the operations of Document Management Solutions (“DMS”). which was part of our software and other services segment, to a third party. As a result, the operations of DMS are reflected as discontinued operations. The consolidated financial statements for all periods presented have been reclassified to reflect discontinued operations.
F-17
Table of Contents
HealthPort, Inc.
Notes to Consolidated Financial Statements—(Continued)
1. Summary of Significant Accounting Policies—Continued
Income Taxes
A provision for income taxes is established for our subsidiaries for federal and state taxes. Income taxes are calculated using the liability method in accordance with Statement of Financial Accounting Standards No. 109, Accounting for Income Taxes (“SFAS 109”). Deferred taxes are provided for the differences between the tax and accounting bases of our assets and liabilities. Deferred tax assets and liabilities are measured using enacted tax rates expected to apply to taxable income in the years in which those temporary differences are expected to be recovered or settled. Income tax expense is comprised of the tax payable for the period and the change in deferred income tax assets and liabilities during the period. A valuation allowance for deferred tax assets is recorded when it is more likely than not that the benefit from the deferred tax asset will not be realized.
Prior to our Reorganization as described in Note 7, we were a Limited Liability Company (LLC) and were liable for state income taxes either at reduced LLC corporation rates or at the regular corporate rates, depending on whether the state recognized the LLC status; however, all of the operations of our operating subsidiaries were included in our consolidated federal income tax return of CT Technologies Intermediate Holdings (Topco), Inc. (“CTTIH Topco”), a wholly owned subsidiary of the Company. CTTIH Topco is organized for tax purposes as a federal and state tax paying entity.
Effective January 1, 2009, we adopted FASB, Interpretation, or FIN No. 48, Accounting for Uncertainty in Income Taxes, an Interpretation of FASB Statement No. 109 (“FIN 48”). FIN 48 prescribes a recognition threshold and measurement attribute for the financial statement recognition and measurement of uncertain tax positions taken or expected to be taken in our income tax return, and also provides guidance on de-recognition, classification, interest and penalties, accounting in interim periods, disclosure, and transition. FIN 48 utilizes a two-step approach for evaluating uncertain tax positions accounted for in accordance with SFAS 109. Step one, Recognition, requires a company to determine if the weight of available evidence indicates that a tax position is more likely than not to be sustained upon audit, including resolution of related appeals or litigation processes, if any. Step two, Measurement, is based on the largest amount of benefit which is more likely than not to be realized on ultimate settlement. Upon adoption, there was no material impact to our consolidated financial statements.
Equity-Based Compensation
Prior to our Reorganization as described in Note 1, we issued Series B-1 and B-2 Units (“the Series B Units”) under incentive compensation plans. These equity-based awards were accounted for under the provisions of Statement of Financial Accounting Standards No. 123(R) Share-Based Payment (“SFAS No. 123(R)”), requiring the measurement and recognition of all equity-based compensation under the fair value method. This statement requires companies to recognize the cost (expense) of all share-based payment transactions in the financial statements.
The Series B Shares vested over five or six years and were subject to continuing employment with us (for those shares issued to employees). All unvested Series B Shares issued to employees were forfeited upon termination of employment.
F-18
Table of Contents
HealthPort, Inc.
Notes to Consolidated Financial Statements—(Continued)
1. Summary of Significant Accounting Policies—Continued
The grant date fair value of the Series B shares issued to employees was recorded as equity-based compensation in selling, general and administrative expense on the consolidated statements of operations on a straight-line basis over the requisite service period which were deemed to be the vesting period for shares. The grant date fair value of Series B shares issued to non-employees was adjusted to the fair value on the measurement date, which was the vesting date.
Equity-based compensation expense recorded in selling, general and administrative expense was approximately $0.0 million, $0.4 million and $0.5 million for the period from January 1, 2006 through December 30, 2006 and for the years ended December 31, 2007 and 2008, respectively, and $0.4 million for the six months ended June 30, 2009. We did not recognize any significant equity-based compensation for the six months ended June 30, 2008 due to unexpected forfeitures.
Letters of Credit
As of December 31, 2007, 2008 and June 30, 2009 we had a total of approximately $1.4 million, $3.6 million and $3.5 million, respectively, in letters of credit with Wachovia Bank relating to our workers’ compensation insurance plan and leased equipment.
Unaudited Pro Forma Basic and Diluted Net Loss Per Share
Pro forma basic net loss per share is calculated in accordance with Statement of Financial Accounting Standards No. 128, Earnings Per Share (“SFAS 128”). Pro forma basic loss per share (“EPS”) is calculated using the weighted-average common shares outstanding in each period.
The shares used to calculate pro forma basic EPS represent the weighted-average common shares outstanding.
As we have a net loss for all periods presented, pro forma diluted net loss per common share is the same as pro forma basic net loss per share for the years ended December 31, 2007 and 2008, and for the six months ended June 30, 2008 and 2009.
F-19
Table of Contents
HealthPort, Inc.
Notes to Consolidated Financial Statements—(Continued)
1. Summary of Significant Accounting Policies—Continued
| Successor | ||||||||||||||||
| Pro forma | ||||||||||||||||
| Year Ended December 31 |
Six Months Ended June 30, |
|||||||||||||||
| 2007 | 2008 | 2008 | 2009 | |||||||||||||
| Numerator for basic and diluted loss per share |
||||||||||||||||
| Loss from continuing operations |
$ | (6,619 | ) | $ | (47,058 | ) | $ | (6,106 | ) | $ | (6,873 | ) | ||||
| Loss from discontinued operations, net of tax |
(732 | ) | (1,426 | ) | (936 | ) | — | |||||||||
| Loss on sale of discontinued operations, net of tax |
— | (1,306 | ) | — | — | |||||||||||
| Net loss |
$ | (7,351 | ) | $ | (49,790 | ) | $ | (7,042 | ) | $ | (6,873 | ) | ||||
| Denominator |
||||||||||||||||
| Weighted average shares outstanding |
9,840 | 13,401 | 12,372 | 16,492 | ||||||||||||
| Basic and diluted loss per share |
||||||||||||||||
| Loss from continuing operations |
$ | (0.67 | ) | $ | (3.51 | ) | $ | (0.49 | ) | $ | (0.42 | ) | ||||
| Loss from discontinued operations, net of tax |
(0.07 | ) | (0.11 | ) | (0.08 | ) | — | |||||||||
| Loss on sale of discontinued operations, net of tax |
— | (0.10 | ) | — | — | |||||||||||
| Net loss |
$ | (0.74 | ) | $ | (3.72 | ) | $ | (0.57 | ) | $ | (0.42 | ) | ||||
Stock Splits
Prior to our Reorganization as described in Note 1, on March 31, 2008, we effected a 500 to one stock split for all of our Series B shares. All Series B share amounts in this report reflect the 500 to one stock split.
Reclassifications
Certain amounts for prior periods have been reclassified to conform to the current year’s presentation.
Recent Accounting Pronouncements
Fair Value Measurements
In September 2006, the Financial Accounting Standards Board (FASB) issued SFAS No. 157, Fair Value Measurements, (“SFAS 157”) which, among other things, established a framework for measuring fair value and required supplemental disclosures about fair value measurements. The changes resulting from the application of this new accounting pronouncement primarily relate to the definition of fair value and the methods used to measure fair value. SFAS 157 was effective for fiscal years beginning after November 15, 2007. However, the FASB subsequently deferred SFAS 157 for one year insofar as it relates to certain non-financial assets and liabilities.
We adopted SFAS 157 on January 1, 2008, except for the provisions relating to non-financial assets and liabilities that are not required or permitted to be recognized or disclosed at fair value on a recurring basis. The adoption of SFAS 157 for financial assets and liabilities that are carried at fair value on a recurring basis did not have a material impact on our financial position or results of operations. Non-financial assets and liabilities for which the
F-20
Table of Contents
HealthPort, Inc.
Notes to Consolidated Financial Statements—(Continued)
1. Summary of Significant Accounting Policies—Continued
Company has not applied the provisions of SFAS 157 include: (i) those items measured at fair value in goodwill impairment testing; (ii) tangible and intangible long-lived assets measured at fair value for impairment testing; and (iii) those items initially measured at fair value in a business combination. The portion of the standard that defers the effective date of SFAS 157 for one year for certain non-financial assets and non-financial liabilities measured at fair value, except those that are recognized or disclosed at fair value in the financial statements on a recurring basis, was implemented January 1, 2009.
Fair Value Option for Financial Assets and Financial Liabilities
In February 2007, FASB issued SFAS No. 159, The Fair Value Option for Financial Assets and Financial Liabilities—Including an amendment of FASB Statement No. 115 (“SFAS 159”), which is effective for fiscal years beginning after November 15, 2007. This statement permits entities to choose to measure many financial instruments and certain other items at fair value. This statement also establishes presentation and disclosure requirements designed to facilitate comparisons between entities that choose different measurement attributes for similar types of assets and liabilities. Unrealized gains and losses on items for which the fair value option is elected would be reported in earnings. We have adopted SFAS 159 and have elected not to measure any additional financial instruments and other items at fair value.
Purchase Method of Accounting for Acquisitions
In December 2007, the FASB issued SFAS No. 141(R), Business Combinations (“SFAS 141(R)”). SFAS 141(R) retains the purchase method of accounting for acquisitions, but requires a number of changes, including changes in the way assets and liabilities are recognized in the purchase accounting as well as requiring the expensing of acquisition-related costs as incurred. Additionally, SFAS 141(R) provides guidance for recognizing and measuring the goodwill acquired in the business combination and determines what information to disclose to enable users of the financial statements to evaluate the nature and financial effects of the business combination. Furthermore, this standard requires any adjustments to acquired deferred tax assets and liabilities occurring after the related allocation period to be made through earnings for both acquisitions occurring prior and subsequent to the effective date of this standard. SFAS 141(R) is effective on January 1, 2009 for the Company. Earlier adoption was prohibited. The adoption of SFAS 141(R), prospectively, may have a material effect on our results of operations and financial position, to the extent that we have material acquisitions, as costs that have historically been capitalized as part of the purchase price will now be expensed, such as accounting, legal and other professional fees.
Noncontrolling Interests in Consolidated Financial Statements
In December 2007, the FASB issued SFAS No. 160, Noncontrolling Interests in Consolidated Financial Statements—An Amendment of ARB No. 51 (“SFAS No. 160”). SFAS No. 160 amends Accounting Research Bulletin 51, Consolidated Financial Statements, (“ARB 51”), to establish accounting and reporting standards for the noncontrolling interest in a subsidiary and for the deconsolidation of a subsidiary. SFAS 160 clarifies that a noncontrolling interest in a subsidiary is an ownership interest in the consolidated entity that should be reported as equity in the consolidated financial statements. Additionally, SFAS 160 changes the way the consolidated
F-21
Table of Contents
HealthPort, Inc.
Notes to Consolidated Financial Statements—(Continued)
1. Summary of Significant Accounting Policies—Continued
income statement is presented by requiring consolidated net income to be reported at amounts that include the amounts attributable to both the parent and the noncontrolling interest. SFAS 160 requires expanded disclosures in the consolidated financial statements that clearly identify and distinguish between the interests of the parent’s owners and the interests of the noncontrolling owners of a subsidiary, including a reconciliation of the beginning and ending balances of the equity attributable to the parent and the noncontrolling owners and a schedule showing the effects of changes in a parent’s ownership interest in a subsidiary on the equity attributable to the parent. SFAS 160 does not change ARB 51’s provisions related to consolidation purposes or consolidation policy, or the requirement that a parent consolidate all entities in which it has a controlling financial interest. SFAS 160 does, however, amend certain of ARB 51’s consolidation procedures to make them consistent with the requirements of SFAS 141(R) as well as to provide definitions for certain terms and to clarify some terminology. SFAS 160 is effective on January 1, 2009 for the Company. Earlier adoption was prohibited. SFAS 160 must be applied prospectively as of the beginning of the fiscal year in which it is initially applied, except for the presentation and disclosure requirements, which must be applied retrospectively for all periods presented. The adoption of SFAS 160 did not have a material impact on our consolidated financial statements.
Derivative Instruments and Hedging Activities
In March 2008, the FASB issued statement No. 161, “Disclosures about Derivative Instruments and Hedging Activities, an amendment of FASB Statement No. 133” (“SFAS 161”). SFAS 161 requires entities that use derivative instruments to provide qualitative disclosures about their objectives and strategies for using such instruments, as well as any details of credit- risk-related contingent features contained within derivatives. SFAS 161 also requires entities to disclose additional information about the amounts and location of derivatives located within the financial statements, how the provisions of SFAS 133, “Accounting for Derivative Instruments and Hedging Activities,” have been applied, and the impact that hedges have on an entity’s financial position, financial performance, and cash flows. We adopted the provisions of SFAS 161 effective January 1, 2009. See Note 6 for further detail.
Determination of Useful Life of Intangible Assets
In April 2008, the Financial Accounting Standards Board (“FASB”) issued FASB Staff Position (“FSP”) SFAS 142-3, Determination of the Useful Life of Intangible Assets (“FSP 142-3”). This guidance is intended to improve the consistency between the useful life of a recognized intangible asset under Statement of Financial Accounting Standards (“SFAS”) No. 142, Goodwill and Other Intangible Assets (“SFAS 142”), and the period of expected cash flows used to measure the fair value of the asset under SFAS 141R (Revised 2007) “Business Combinations” (“SFAS 141R”) when the underlying arrangement includes renewal or extension of terms that would require substantial costs or result in a material modification to the asset upon renewal or extension. Companies estimating the useful life of a recognized intangible asset must now consider their historical experience in renewing or extending similar arrangements or, in the absence of historical experience, must consider assumptions that market participants would use about renewal or extension as adjusted for SFAS 142’s entity-specific factors. FSP 142-3 is effective for us beginning January 1, 2009. Our adoption of FSP FAS 142-3 did not have a material impact on our consolidated financial statements.
F-22
Table of Contents
HealthPort, Inc.
Notes to Consolidated Financial Statements—(Continued)
1. Summary of Significant Accounting Policies—Continued
Generally Accepted Accounting Principles Hierarchy
In May 2008, the FASB issued SFAS No. 162, The Hierarchy of Generally Accepted Accounting Principles (“SFAS 162”). SFAS 162 identifies the sources of accounting principles and the framework for selecting the principles used in the preparation of financial statements of nongovernmental entities that are presented in conformity with generally accepted accounting principles (the GAAP hierarchy). SFAS 162 is effective for financial statements issued for fiscal years and interim periods beginning after November 15, 2008. Our adoption of SFAS 162 did not have a material impact on our consolidated financial statements.
Convertible Debt Instruments
In May 2008, the FASB issued FSP APB 14-1, Accounting for Convertible Debt Instruments That May Be Settled in Cash upon Conversion (Including Partial Cash Settlement) (“FSP APB 14-1”). FSP APB 14-1 specifies that issuers of certain convertible debt instruments must separately account for the liability and equity components thereof and reflect interest expense at the entity’s market rate of borrowing for non-convertible debt instruments. FSP APB 14-1 is effective for financial statements issued for fiscal years beginning after December 15, 2008, and interim periods within those fiscal years. Early adoption was not permitted. FSP APB 14-1 requires retrospective application to all periods presented in the annual financial statements for the period of adoption and where applicable instruments were outstanding during an earlier period. The cumulative effect of the change in accounting principle on periods prior to those presented shall be recognized as of the beginning of the first period presented. An offsetting adjustment shall be made to the opening balance of retained earnings for that period, presented separately. The adoption of FSP APB 14-1 did not have a material impact on our consolidated financial statements.
Fair Value Measurements
In April 2009, the FASB issued FSP FAS 157-4, Determining Fair Value When the Volume and Level of Activity for the Asset or Liability Have Significantly Decreased and Identifying Transactions That Are Not Orderly (“FSP FAS 157-4”). This FSP provides additional guidance for estimating fair value in accordance with FASB Statement 157, Fair Value Measurements, when the volume and level of activity for the asset or liability have significantly decreased. This FSP also includes guidance on identifying circumstances that indicate a transaction is not orderly. This FSP emphasizes that even if there has been a significant decrease in the volume and level of activity for the asset or liability and regardless of the valuation technique(s) used, the objective of a fair value measurement remains the same. Fair value is the price that would be received to sell an asset or paid to transfer a liability in an orderly transaction (that is, not a forced liquidation or distressed sale) between market participants at the measurement date under current market conditions. FSP FAS 157-4 is effective for interim and annual reporting periods ending after June 15, 2009, and is applied prospectively. The adoption of this standard did not have a material impact on our consolidated financial statements.
Interim Disclosures about Fair Value of Financial Instruments
In April 2009, the FASB issued FSP FAS 107-1 and APB 28-1, Interim Disclosures about Fair Value of Financial Instruments (“FSP FAS 107-1 and APB 28-1”). This FSP amends FASB
F-23
Table of Contents
HealthPort, Inc.
Notes to Consolidated Financial Statements—(Continued)
1. Summary of Significant Accounting Policies—Continued
Statement No. 107, Disclosures about Fair Value of Financial Instruments, to require disclosures about fair value of financial instruments for interim reporting periods of publicly traded companies as well as in annual financial statements. This FSP also amends APB Opinion 28, Interim Financial Reporting, to require those disclosures in summarized financial information at interim reporting periods. FSP FAS 107-1 and APB 28-1 are effective for interim and annual reporting periods ending after June 15, 2009. The adoption of this standard did not have a material impact on our consolidated financial statements.
Subsequent Events
In May 2009, the FASB issued SFAS 165, Subsequent Events, to establish general standards of accounting for and disclosure of events that occur after the balance sheet date but before financial statements are issued. We adopted this pronouncement for the quarter ended June 30, 2009. We have evaluated our subsequent events through October 20, 2009.
Codification and Hierarchy of Generally Accepted Accounting Principles
In June 2009, the FASB issued SFAS No. 168, “The FASB Accounting Standards Codification and the Hierarchy of Generally Accepted Accounting Principles,” (“SFAS 168”). SFAS 168 establishes the FASB Accounting Standards Codification (the Codification) as the single source of authoritative, nongovernmental U.S. GAAP. The Codification does not change U.S. GAAP. All existing accounting standard documents will be superseded and all other accounting literature not included in the Codification will be considered nonauthoritative. SFAS 168 is effective for interim and annual periods ending after September 15, 2009. Accordingly, we will adopt the provision of SFAS 168 in the fourth quarter 2009. We do not expect the adoption of the provisions of SFAS 168 to have any effect on our financial condition and consolidated financial statements.
2. Acquisition
Companion Technologies Corporation
On December 31, 2006, pursuant to a stock purchase agreement, we purchased 100% of the outstanding stock of Companion Technologies Corporation (“Companion”), a software company, located in South Carolina, for $38.0 million from BlueCross BlueShield of South Carolina (“BCBSSC”). The purchase price was determined based upon the expected annual cash flows to be generated by Companion. We purchased Companion as a platform to enter into the healthcare information technology market. Prior to the acquisition of Companion, the Company had no operations; accordingly, Companion is our predecessor company. The results of operations of the acquired entity are included in our consolidated financial statements since the date of acquisition.
F-24
Table of Contents
HealthPort, Inc.
Notes to Consolidated Financial Statements—(Continued)
2. Acquisition—Continued
The following table summarizes the estimated fair value of net assets acquired at the date of the acquisition The total purchase price of the acquisition has been allocated based on fair value (in thousands).
| Current assets |
$ | 11,099 | |
| Long-term assets |
1,851 | ||
| Goodwill (not deductible for income tax purposes) |
18,951 | ||
| Customer base |
10,310 | ||
| Acquired software |
9,975 | ||
| Total assets acquired |
52,186 | ||
| Current liabilities |
6,749 | ||
| Other liabilities |
7,521 | ||
| Total liabilities assumed |
14,270 | ||
| Net assets acquired |
$ | 37,916 | |
Smart Holdings Corporation
In June 2007, pursuant to a stock purchase agreement, we purchased 100% of the outstanding stock of Smart Holdings Corporation (“SHC”) for a purchase price of approximately $195.4 million. The purchase price was determined based upon the expected annual cash flows to be generated by SHC. We purchased SHC to expand our healthcare information technology market position and to capitalize on revenue opportunities within its expanded hospital and physician practice customer base. The results of operations of the acquired entity are included in our consolidated financial statements since the date of acquisition.
The following table summarizes the estimated fair value of net assets acquired at the date of the acquisition. The total purchase price of the acquisition has been allocated based on fair value (in thousands).
| Current assets |
$ | 19,839 | |
| Long-term assets |
24,084 | ||
| Goodwill (not deductible for income tax purposes) |
109,693 | ||
| Customer base |
62,466 | ||
| Acquired software |
10,478 | ||
| Total assets acquired |
226,560 | ||
| Current liabilities |
8,127 | ||
| Other liabilities |
23,031 | ||
| Total liabilities assumed |
31,158 | ||
| Net assets acquired |
$ | 195,402 | |
F-25
Table of Contents
HealthPort, Inc.
Notes to Consolidated Financial Statements—(Continued)
2. Acquisition—Continued
ChartOne Inc.
In September 2008, pursuant to a merger agreement, we purchased 100% of the outstanding stock of ChartOne, Inc. (“ChartOne”) for a purchase price of approximately $98.0 million. The purchase price was determined based upon the expected annual cash flows to be generated by ChartOne. We purchased ChartOne to expand our healthcare information technology market position and to capitalize on revenue opportunities within our hospital and physician practice customer base. The results of operations of the acquired entity are included in our consolidated financial statements since the date of acquisition.
The following table summarizes the estimated fair value of net assets acquired at the date of the acquisition. The total purchase price of the acquisition has been allocated based on fair value (in thousands).
| Current assets |
$ | 9,829 | |
| Long-term assets |
2,560 | ||
| Goodwill (not deductible for income tax purposes) |
71,030 | ||
| Customer base |
26,408 | ||
| Total assets acquired |
109,827 | ||
| Current liabilities |
10,378 | ||
| Other liabilities |
1,481 | ||
| Total liabilities assumed |
11,859 | ||
| Net assets acquired |
$ | 97,968 | |
Unaudited Pro Forma Financial Information
The unaudited financial information in the table below summarizes the combined results of operations for the Company and significant acquisitions (ChartOne and SHC) on a pro forma basis as though the companies had been combined as of the beginning of each period prior to acquisition. The pro forma financial information is presented for informational purposes only and is not indicative of the results of operations that would have been achieved if the acquisitions had taken place at the beginning of each of the periods presented (in thousands) .
| Year Ended December 31, |
Six Months Ended June 30, | ||||||||||
| 2007 | 2008 | 2008 | |||||||||
| (unaudited) | |||||||||||
| Net revenue |
$ | 245,471 | $ | 242,077 | $ | 121,062 | |||||
| Income (loss) from operations |
(4,631 | ) | (26,372 | ) | 6,624 | ||||||
F-26
Table of Contents
HealthPort, Inc.
Notes to Consolidated Financial Statements—(Continued)
3. Trade Accounts Receivable
The components of trade receivables are as follows as of December 31, 2007 and 2008, and June 30, 2009 (in thousands):
| 2007 | 2008 | June 30, 2009 | ||||||||||
| (unaudited) | ||||||||||||
| Trade accounts receivable |
$ | 30,605 | $ | 47,127 | $ | 53,297 | ||||||
| Unbilled accounts receivable |
1,198 | 1,352 | 1,270 | |||||||||
| Total trade receivables |
31,803 | 48,479 | 54,567 | |||||||||
| Allowance for doubtful accounts |
(9,909 | ) | (14,454 | ) | (15,076 | ) | ||||||
| Trade accounts receivable, net |
$ | 21,894 | $ | 34,025 | $ | 39,491 | ||||||
4. Property and Equipment
Property and equipment consists of the following as of December 31, 2007 and 2008, and June 30, 2009 (in thousands):
| 2007 | 2008 | June 30, 2009 | ||||||||||
| (unaudited) | ||||||||||||
| Leasehold improvements |
$ | 901 | $ | 1,317 | $ | 1,367 | ||||||
| Furniture and equipment |
1,139 | 1,414 | 1,495 | |||||||||
| EDP equipment |
6,349 | 10,349 | 13,061 | |||||||||
| Computer software |
21,109 | 13,424 | 13,578 | |||||||||
| Vehicles |
57 | 85 | 83 | |||||||||
| 29,555 | 26,589 | 29,584 | ||||||||||
| Accumulated depreciation and amortization |
(5,210 | ) | (8,330 | ) | (11,353 | ) | ||||||
| $ | 24,345 | $ | 18,259 | $ | 18,231 | |||||||
Depreciation and amortization expense incurred for the period from January 1, 2006 through December 30, 2006 and the years ended December 31, 2007 and 2008 was approximately $0.7 million, $9.6 million, $15.1 million, respectively, and $7.7 million and $7.9 million for the six months ended June 30, 2008 and 2009, respectively. Depreciation and amortization included in costs of services and products is approximately $0.0 million, $2.8 million and $2.4 million for the period from January 1, 2006 through December 30, 2006 and the years ended December 31, 2007 and 2008, respectively, and $1.5 million and $0.6 million for the six months ended June 30, 2008 and 2009, respectively. Depreciation and amortization included in discontinued operations is approximately $0.0 million, $0.7 million, $0.5 million, respectively, and $0.5 million and $0.0 million for the six months ended June 30, 2008 and 2009, respectively
5. Capital Leases
We lease certain equipment under agreements that are classified as capital leases. The cost of equipment under capital leases, included as property and equipment in the accompanying consolidated balance sheets, was approximately $0.3 million, $1.0 million and $2.4 million as of December 31, 2007, 2008, and June 30, 2009, respectively. Accumulated amortization relating to this equipment was approximately $0.0 million, $0.2 million and $0.5 million as of December 31, 2007, 2008 and June 30, 2009, respectively. Amortization of assets under capital leases is included in depreciation expense.
F-27
Table of Contents
HealthPort, Inc.
Notes to Consolidated Financial Statements—(Continued)
5. Capital Leases—Continued
The future minimum lease payments required under the capital leases as of December 31, 2008, are as follows (in thousands):
| Year ended December 31, |
||||
| 2009 |
$ | 314 | ||
| 2010 |
287 | |||
| 2011 |
198 | |||
| 2012 |
152 | |||
| 2013 and thereafter |
11 | |||
| 962 | ||||
| Less amount representing interest |
(109 | ) | ||
| 853 | ||||
| Less current portion |
(246 | ) | ||
| Long-term capital lease obligations |
$ | 607 | ||
6. Long-Term Obligations
The following table represents our long-term debt as of December 31, 2007 and 2008 and June 30, 2009 (in thousands):
| 2007 | 2008 | June 30, 2009 | ||||||||||
| (unaudited) | ||||||||||||
| Revolving credit facility |
$ | 2,700 | $ | 4,000 | $ | 7,400 | ||||||
| Term loan |
120,000 | 130,000 | 125,125 | |||||||||
| Convertible promissory notes |
7,964 | — | — | |||||||||
| Subordinated notes |
— | 75,413 | 76,169 | |||||||||
| 130,664 | 209,413 | 208,694 | ||||||||||
| Less current portion |
(3,000 | ) | (9,750 | ) | (11,375 | ) | ||||||
| $ | 127,664 | $ | 199,663 | $ | 197,319 | |||||||
On June 15, 2007, our wholly owned subsidiary, CT Technologies Intermediate Holdings, Inc. (“CTTIH”), entered into a credit agreement (the 2007 Credit Agreement) with several lenders managed by ARES Capital Corporation (collectively, the 2007 Lenders). The 2007 Credit Agreement consisted of a revolving credit facility (the 2007 Revolver), a term loan (the 2007 Term Loan) and an incremental term loan (the 2007 Incremental Term Loan). All obligations under the 2007 Credit Agreement were collateralized by substantially all assets of the obligors as defined in the agreement, subject to certain limitations. On September 22, 2008, the 2007 Term Loan, 2007 Revolver and 2007 Incremental Term Loan were repaid in full including all outstanding principal and interest due.
On September 22, 2008, our wholly owned subsidiary, CTTIH, entered into a credit agreement (the 2008 Credit Agreement) with several lenders managed by General Electric Capital Corporation (collectively, the 2008 Lenders). The 2008 Credit Agreement consists of a revolving credit facility (the 2008 Revolver), a term loan (the 2008 Term Loan) and an
F-28
Table of Contents
HealthPort, Inc.
Notes to Consolidated Financial Statements—(Continued)
6. Long-Term Obligations—Continued
incremental term loan (the 2008 Incremental Term Loan). All obligations under the 2008 Credit Agreement are collateralized by substantially all assets of the obligors as defined in the agreement, subject to certain limitations.
As of December 31, 2008 and June 30, 2009, the fair value of our outstanding long-term obligations was estimated to be $200.6 million and $178.6 million, respectively.
Revolving Credit Facilities
On September 22, 2008, the 2007 Revolver was repaid in full including all outstanding principal and interest due. The 2007 Revolver provided for a credit line of up to $10.0 million (of which up to $2.5 million could be utilized in the form of commercial and standby letters of credit), payable in full by June 14, 2013 and carried interest, at our discretion, based upon either ABR loans (interest equal to the maximum of Prime or the Federal Funds rate plus one half of 1% plus an applicable margin of 4%) or Eurodollar loans (interest equal to LIBOR plus an applicable margin of 5%). The 2007 Revolver was to be used for consummation of the June 15, 2007 acquisition of SHC; working capital requirements; specified Restricted Payments and general corporate purposes. The applicable margins varied based on a leverage performance grid as defined in the 2007 Credit Agreement. Interest payments were due monthly to quarterly depending on the borrowing election (ABR loans quarterly and LIBOR loans based on LIBOR contracts but no longer than quarterly). As of December 31, 2007, we had $2.7 million outstanding under the 2007 Revolver consisting of three revolving loans.
The 2008 Revolver provides for a credit line of up to $20.0 million (of which up to $5 million may be utilized in the form of commercial and standby letters of credit), payable in full by September 22, 2013 and carries interest, at our discretion, based upon either Index Rate loans (interest equal to the maximum of (1) Prime, (2) the Federal Funds rate plus one half of 1% or (3) 4%) or LIBOR loans (interest equal to the greater of LIBOR or 3%) plus an applicable margin of 5%. The 2008 Revolver is to be used for working capital requirements, permitted acquisitions and general corporate needs. Interest payments are due monthly to quarterly depending on the borrowing election (Index Rate loans quarterly and LIBOR loans based on LIBOR contracts but no longer than quarterly). As of December 31, 2008 and June 30, 2009, we had $4.0 million and $7.4 million outstanding under the 2008 Revolver, respectively. We had $3.6 million in outstanding letters of credit in relation to the 2008 Revolver at December 31, 2008, leaving $12.4 million available from the 2008 Revolver for additional borrowings at December 31, 2008. We had $3.5 million in outstanding letters of credit in relation to the 2008 Revolver at June 30, 2009 leaving $9.1 million available from the 2008 revolver for additional borrowings at June 30, 2009. The interest rate was 8% on the outstanding 2008 Revolver balance as of December 31, 2008 and June 30, 2009, respectively.
Term Loans
On September 22, 2008, the 2007 Term Loan was repaid in full including all outstanding principal and interest due. In addition, we cancelled the 2007 Incremental Term Loan. The 2007 Term Loan and 2007 Incremental Term Loan could be used for the same purposes as the 2007 Revolver with the noted restrictions on the 2007 Incremental Term Loan below. The 2007 Term Loan provided a credit line of $120.0 million with interest options the same as the 2007
F-29
Table of Contents
HealthPort, Inc.
Notes to Consolidated Financial Statements—(Continued)
6. Long-Term Obligations—Continued
Revolver, and was payable in quarterly installments through June 15, 2013. On June 15, 2007, we borrowed $120.0 million under the Term Loan which was still outstanding as of December 31, 2007.
The 2008 Term Loan and 2008 Incremental Term Loan were to be used for the ChartOne acquisition (and any related transaction expenses) including any related refinancing and for permitted acquisitions. The 2008 Term Loan provides a credit line of $130.0 million with interest options the same as the 2008 Revolver, and is payable in quarterly installments through June 30, 2013. On September 22, 2008, we borrowed $130.0 million under the 2008 Term Loan which was still outstanding as of December 31, 2008. As of June 30, 2009, there was $125.1 million outstanding on the 2008 Term Loan. The interest rates on the 2008 Term Loan as of December 31, 2008 and June 30, 2009 ranged from 8% to 9%, respectively.
Future maturities of principal on the 2008 Term Loan as of December 31, 2008 are as follows (in thousands):
| 2009 |
$ | 9,750 | |
| 2010 |
13,000 | ||
| 2011 |
16,250 | ||
| 2012 |
19,500 | ||
| 2013 |
71,500 | ||
| $ | 130,000 | ||
Incremental Term Loans
The 2007 Incremental Term Loan provided for a credit line of up to $37.5 million for working capital and Capital Expenditures and to make up to $7.5 million in Bridge Loan repayments and to allow for up to $30.0 million of the $37.5 million for Permitted Acquisitions with interest options the same as the 2007 Revolver. We had not borrowed against the 2007 Incremental Term Loan as of December 31, 2007. The 2007 Incremental Term Loan commitment was due to expire on June 15, 2013, and was payable quarterly based upon a percentage of the outstanding balance. We cancelled the 2007 Incremental Term Loan on September 22, 2008.
The 2008 Incremental Term Loan provides for a credit line of up to $20 million for working capital, general corporate needs and Permitted Acquisitions as defined in the 2008 Credit Agreement with interest rate margins on the resultant new term loan to be no more than 0.25% greater than the interest rate margins on any other existing term loans. In the event this 0.25% margin spread is exceeded on the resulting new term loan, then the interest rate margins on the respective existing term loan(s) shall be adjusted on a mark-to-market basis to the interest rate margins on the new term loan to maintain not more than a 0.25% difference. The maturity date for the 2008 Incremental Term Loan shall be no shorter than the remaining life of the existing 2008 Term Loan. We have not borrowed against the 2008 Incremental Term Loan as of December 31, 2008. The 2008 Incremental Term Loan commitment expires on September 22, 2013, and except for maturity and interest rate margins of a new term loan as previously described, the terms and conditions of any new term loan shall be consistent with the terms of the existing 2008 Term Loan.
F-30
Table of Contents
HealthPort, Inc.
Notes to Consolidated Financial Statements—(Continued)
6. Long-Term Obligations—Continued
Convertible Promissory Notes
On June 15, 2007, a wholly owned subsidiary of ours entered into two convertible subordinated promissory notes with our primary investor for a bridge loan (Bridge Loans) totaling $7.5 million. While the Bridge Loans had a maturity date of December 31, 2013, they had an automatic conversion on December 15, 2008, of all then unpaid principal and interest into fully paid and non-assessable Series A Shares of the Company with yield accruing from the borrowing date until conversion. Conversion was to be at $413.27 per Series A Share.
Interest on the Bridge Loans accrued at an 11% per annum rate compounding quarterly. As of December 31, 2007, approximately $0.5 million of unpaid interest was added to the principal balance of the Bridge Loans. The Bridge Loans were unsecured and subordinated to all Senior Debt as defined in the 2007 Credit Agreement.
The Bridge Loans contained a beneficial conversion feature totaling approximately $0.03 million as of December 31, 2007 which was to be amortized through December 15, 2008.
On September 22, 2008, the Bridge Loans were repaid in full including all outstanding principal and interest due as of September 22, 2008.
Subordinated Notes
On September 22, 2008, our wholly owned subsidiary, CTTIH, entered into a note purchase agreement (the “Note Agreement”) with three primary lenders for a total of $75.0 million in aggregate principal amount of 14% Senior Subordinated Notes (the “Notes”) due March 22, 2014. The Notes are guaranteed by all of our current and future Domestic subsidiaries in accordance with the Note Agreement. Interest is payable quarterly at a 12% interest rate for cash payments and a 2% interest rate for deferred payments. For deferred payments, the associated quarterly interest becomes additional principal on which interest begins to accrue on the date of any such deferral. As of December 31, 2008 and June 30, 2009 we had approximately $75.4 million and $76.2 million outstanding on the Notes.
Collateral
Our 2008 Credit Agreements are collateralized by substantially all of our assets including cash and cash equivalents, accounts receivable, and property and equipment.
Prepayments
Prepayment without premium or penalty is available on the 2008 Term Loan, 2008 Incremental Term Loan and the 2008 Revolver. In addition, the 2008 Credit Agreement requires annual mandatory prepayments due after each fiscal year end (beginning May 5, 2010 for the fiscal year ended December 31, 2009) calculated based on a percentage of our Excess Cash Flow for such fiscal year as defined in the 2008 Credit Agreement. The percentage of Excess Cash Flow that is required to be paid ranges from 50% to 75% depending on our leverage ratio during such fiscal year. There were no mandatory prepayments for the fiscal year ended December 31, 2008 and the six months ended June 30, 2009.
F-31
Table of Contents
HealthPort, Inc.
Notes to Consolidated Financial Statements—(Continued)
6. Long-Term Obligations—Continued
A prepayment penalty will be imposed on the Note Agreement at a percentage of the principal amount of the Notes to be redeemed beginning at 4% on September 22, 2009 and declining over time to 0% on September 22, 2012.
Fees
There is a fee on issued letters of credit equal to 5% of the face amount of the letter of credit from date of issue to date of termination, payable quarterly in arrears on each fiscal quarter.
There are unused commitment fees equal to 0.5% of the unused 2008 Revolver credit line, payable quarterly in arrears on the first day of each quarter.
Covenants
The 2008 Credit Agreement and Note Agreement contain certain affirmative and negative covenants customary for these types of agreements. We are also required to comply with various financial covenants including maintaining certain levels of leverage, fixed charge coverage and capital expenditures. Through December 31, 2008 and June 30, 2009, there were no events of default under these covenant requirements.
Interest Rate Swap Agreements
On November 6, 2007, we entered into an interest rate swap agreement (the 2007 Swap) with a financial institution to manage exposure to fluctuations in interest rates. The 2007 Swap represented a contract to cap our exposure to three-month LIBOR rates over the life of the agreement. At December 31, 2007, the 2007 Swap covered a notional amount of $60.0 million of the $120.0 million 2007 Term Loan at a fixed interest rate of 6% and was to expire on November 6, 2009. As of December 31, 2007, the fair value of the 2007 Swap as determined by the financial institution was approximately $0.007 million, which is included in the accompanying 2007 consolidated balance sheet in other assets. The 2007 Swap was not accounted for as an effective cash flow hedge, accordingly changes in the fair value of the interest rate cap agreement are reflected in 2007 operations. The 2007 Swap agreement was terminated effective September 22, 2008.
Effective December 31, 2008, we entered into two interest rate swap agreements (the 2008 Swaps) with a financial institution to manage exposure to fluctuations in interest rates. Under the first agreement, we exchange with the financial institution on a quarterly basis beginning February 28, 2009, the difference between a fixed rate of 3.65% and the floating interest rate amount to be determined for the initial calculation period of February 28, 2009, and a floating rate option equal to the USD-LIBOR-BBA calculated by reference to an agreed notional principal amount of $65.0 million. This agreement will expire on September 30, 2010. The second agreement is a swap agreement with a floor under which we exchange with the financial institution on a quarterly basis beginning February 28, 2009 with a floor rate of 3% and a floating rate option equal to the USD-LIBOR-BBA calculated by reference to an agreed notional principal amount of $65.0 million and expires on May 31, 2010. The fair value of the 2008 Swaps was approximately $(1.9) million and $(2.4) million, at December 31, 2008 and June 30, 2009,
F-32
Table of Contents
HealthPort, Inc.
Notes to Consolidated Financial Statements—(Continued)
6. Long-Term Obligations—Continued
respectively and is included in the accompanying consolidated balance sheets in other non-current liabilities. The 2008 Swaps are not accounted for as effective cash flow hedges, accordingly changes in the fair value are reflected in operations.
In March 2008, the FASB issued statement No. 161, “Disclosures about Derivative Instruments and Hedging Activities, an amendment of FASB Statement No. 133” (“SFAS 161”). SFAS 161 requires entities that use derivative instruments to provide qualitative disclosures about their objectives and strategies for using such instruments, as well as any details of credit-risk-related contingent features contained within derivatives. SFAS 161 also requires entities to disclose additional information about the amounts and location of derivatives located within the financial statements, how the provisions of SFAS 133, “Accounting for Derivative Instruments and Hedging Activities,” have been applied, and the impact that hedges have on an entity’s financial position, financial performance, and cash flows. The Company adopted the provisions of SFAS 161 effective January 1, 2009.
These 2008 swap agreements expose us to credit losses in the event of non-performance by the counterparty to the financial instruments. The counterparty is a creditworthy financial institution and we believe the counterparty will be able to fully satisfy its obligations under the contracts.
The following table presents the location of the liabilities associated with our interest rate swap agreements within the accompanying consolidated balance sheets (in thousands):
| Asset Derivatives | Liability Derivatives | Total | ||||||||||||||||||
| Balance Sheet Location |
Fair Value at December 31, 2008 |
Fair Value at June 30, 2009 |
Fair Value at December 31, 2008 |
Fair Value at June 30, 2009 |
Fair Value at December 31, 2008 |
Fair Value at June 30, 2009 |
||||||||||||||
| (unaudited) | (unaudited) | (unaudited) | ||||||||||||||||||
| Other non-current liabilities |
$ | 629 | $ | 1,406 | $ | 2,567 | $ | 3,761 | $ | (1,938 | ) | $ | (2,355 | ) | ||||||
7. Fair Value Disclosures
Effective January 1, 2008, we adopted SFAS No. 157, which defines fair value, establishes a framework for measuring fair value, establishes a fair value hierarchy based on the quality of inputs used to measure fair value and enhances disclosure requirements for fair value measurements. The implementation of SFAS No. 157 did not change the method of calculating the fair value of assets or liabilities. The primary impact from adoption was additional disclosures. The portion of the standard that defers the effective date of SFAS No. 157 for one year for certain non-financial assets and non-financial liabilities measured at fair value, except those that are recognized or disclosed at fair value in the financial statements on a recurring basis, was implemented January 1, 2009, and did not have an impact on our consolidated financial position, cash flows or results of operations.
In October 2008, the FASB issued FSP 157-3 Determining the Fair Value of a Financial Asset When the Market for That Asset is Not Active. This FSP clarifies the application of FASB 157 in an inactive market and provides an illustrative example to demonstrate how the fair value of a financial asset is determined when the market for that financial asset is inactive. This FSP was
F-33
Table of Contents
HealthPort, Inc.
Notes to Consolidated Financial Statements—(Continued)
7. Fair Value Disclosures—Continued
effective upon issuance. We do not currently have any investments requiring fair market valuations in inactive markets; therefore, the adoption of this FSP did not have an impact on our consolidated financial position, cash flows or results of operations.
The fair value hierarchy categorizes assets and liabilities at fair value into one of three different levels depending on the observability of the inputs employed in the measurement, as follows:
| • | Level 1—inputs to the valuation methodology are quoted prices (unadjusted) for identical assets or liabilities in active markets. |
| • | Level 2—inputs to the valuation methodology include quoted prices for similar assets and liabilities in active markets, and inputs are observable for the asset or liability, either directly or indirectly, for substantially the full term of the financial instrument. |
| • | Level 3—inputs to the valuation methodology are unobservable and significant to the fair value measurement. |
The following table summarizes the financial instruments we had as of December 31, 2008 and June 30, 2009, which are valued at fair value (in thousands):
| Quoted Prices in Active Markets for Identical Assets (Level 1) |
Significant Other Observable Inputs (Level 2) |
Significant Other Unobservable Inputs (Level 3) |
Balance as of December 31, 2008 |
|||||||||||
| Derivative liabilities, net |
$ | — | $ | (1,938 | ) | $ | — | $ | (1,938 | ) | ||||
| Quoted Prices in Active Markets for Identical Assets (Level 1) |
Significant Other Observable Inputs (Level 2) |
Significant Other Unobservable Inputs (Level 3) |
Balance as of June 30, 2009 (unaudited) |
|||||||||||
| Derivative liabilities, net |
$ | — | $ | (2,355 | ) | $ | — | $ | (2,355 | ) | ||||
The methods and assumptions used to estimate the fair values of the derivative assets and liabilities in the table above include the mark-to-market statements from the counterparties, which can be validated using modeling techniques that include market inputs, such as publicly available forward market rates, and are designated as Level 2 within the valuation hierarchy. The model also incorporates valuation adjustments for credit risk. In addition to the above liabilities, we also have a financial liability for our senior preferred shares that is not carried at fair market value. This is accounted for as a liability because it is mandatorily redeemable. At December 31, 2008 and June 30, 2009, the senior preferred shares have a carrying value of approximately $34.2 million and $37.1 million and a fair market value of approximately $23.4 million and $43.1 million, respectively.
F-34
Table of Contents
HealthPort, Inc.
Notes to Consolidated Financial Statements—(Continued)
8. Identifiable Intangible Assets
Identifiable intangible assets as of December 31, 2007, 2008, and June 30, 2009, consist of our acquired customer bases as follows (in thousands):
| 2007 | 2008 | June 30, 2009 |
||||||||||
| (unaudited) | ||||||||||||
| Customer base |
$ | 72,776 | $ | 89,977 | $ | 89,977 | ||||||
| Accumulated amortization |
(4,415 | ) | (9,733 | ) | (14,271 | ) | ||||||
| Identifiable intangible assets, net |
$ | 68,361 | $ | 80,244 | $ | 75,706 | ||||||
The estimated aggregate amortization is summarized for the years ended December 31:
| 2009 |
$ | 8,998 | |
| 2010 |
8,998 | ||
| 2011 |
8,998 | ||
| 2012 |
8,998 | ||
| 2013 |
8,998 | ||
| Thereafter |
35,254 | ||
| Total |
$ | 80,244 | |
Amortization expense of identifiable intangible assets for the period from January 1, 2006 through December 30, 2006 and for the years ended December 31, 2007 and 2008 was approximately $0.0 million $4.4 million and $7.6 million, respectively, and $3.8 million and $4.5 million, for the six months ended June 30, 2008 and 2009, respectively.
9. Impairment of Goodwill and Identifiable Intangible Assets
During the year ended December 31, 2008, we recorded a non-cash impairment charge of approximately $26.0 million which is included in impairment of goodwill and intangible assets in the accompanying consolidated statement of operations. We did not recognize any impairment losses during the period from January 1, 2006 through December 30, 2006, the year ended December 31, 2007 or the six months ended June 30, 2008 and 2009.
After completing our annual impairment test in 2008, we concluded that goodwill and certain intangible assets recorded as a result of our December 2006 acquisition of Companion were impaired and we recorded non-cash impairment charges of approximately $18.3 million for goodwill, $4.8 million for developed software and $2.9 million for the customer base. The impairment charge was recorded in accordance with SFAS 142 with respect to goodwill and No. 144 with respect to the customer base and developed software. The primary factor contributing to the impairment charge was the recent significant economic downturn which has resulted in a general lack of discretionary spending by healthcare providers which are Companion’s primary customers. As a result, we updated our long-range financial outlook in 2008, which reflected decreased expectations of future growth rates and cash flows for Companion. We used this updated financial outlook in conjunction with our annual impairment test.
F-35
Table of Contents
HealthPort, Inc.
Notes to Consolidated Financial Statements—(Continued)
9. Impairment of Goodwill and Identifiable Intangible Assets—Continued
Our estimates used in these valuations could differ from actual results. If actual results are not consistent with our estimates or assumptions, we may be exposed to an impairment charge that could be material.
Goodwill
In accordance with SFAS 142, we review the carrying value of goodwill annually and whenever possible indications of impairment are present. With respect to goodwill, we determine whether potential impairments are present by comparing the carrying value of our reporting units to the fair value of our reporting units. If the fair value of the reporting unit is less than the carrying value of the reporting unit, then a hypothetical purchase price allocation is performed to determine the amount, if any, of goodwill impairment.
When testing the goodwill for impairment, we estimate the fair value of our reporting units by considering both the income and market approaches. Specifically, we develop an initial estimate of the fair value of each reporting unit as the present value of the expected future cash flows to be generated by the reporting unit. We then validate this fair value by performing the market approach to estimate the fair value.
Each approach requires the use of certain assumptions. The income approach requires management to exercise judgment in making assumptions regarding the reporting unit’s future income stream, a discount rate and a constant rate of growth after the discrete forecast period. These assumptions are subject to change based on business and economic conditions and could materially affect the indicated values of our reporting units. The market approach requires management to exercise judgment in its selection of the guideline companies as well as its selection of the most relevant valuation multiple. Guideline companies selected are comparable to us in terms of product or service offerings, markets, and/or customers, among other characteristics. We considered two valuation multiples—(i) the ratio of market value of invested capital to revenue (MVIC/Revenue) and (ii) the ratio of market value of invested capital to earnings before interest, taxes, depreciation, and amortization (MVIC/EBITDA).
Identifiable Definite Lived Intangible Assets
The carrying value of other intangibles is evaluated when indicators are present to determine whether such intangibles may be impaired with respect to their recorded values. In accordance with Statement of Financial Accounting Standards No. 144, Accounting for the Impairment or Disposal of Long-Lived Assets (SFAS No. 144), the carrying values of these identifiable intangible assets are reviewed whenever events or changes in circumstances indicate that the carrying amount of an asset may not be recoverable. If this review indicates that the asset will not be recoverable, as determined based on the undiscounted cash flows of the operating entity or asset over the remaining amortization period, the carrying value of the asset is reduced to its fair value.
As a result of the goodwill impairment, we also tested Companion’s definite-lived intangible assets for impairment pursuant to SFAS No. 144. Because of the decrease in expected future cash from such definite-lived intangible assets, we recorded non-cash impairment charges of approximately $4.8 million relating to its developed software and $2.9 million relating to its customer base during the year ended December 31, 2008.
F-36
Table of Contents
HealthPort, Inc.
Notes to Consolidated Financial Statements—(Continued)
10. Senior Preferred Shares and Series C Shares
Prior to our reorganization as described in Note 1, our LLC Agreement authorized the issuance of an unlimited number of Senior Preferred Shares and 7,730 Series C Shares. On June 15, 2007, we sold 30,000 Senior Preferred Shares and 7,730 Series C Shares under a Securities Purchase Agreement for an aggregate amount of $30 million. As of December 31, 2007, 2008 and June 30, 2009, there were 30,000 Senior Preferred Shares and 7,730 Series C Shares issued and outstanding.
The Securities Purchase Agreement contained certain affirmative and negative covenants. The Company was also required to comply with financial covenants for maintaining certain levels of leverage and fixed charge coverage.
The holders of Series C Shares were entitled to one vote per Point (as defined in our LLC Agreement).
The Senior Preferred Shares earned a yield of 14% compounded quarterly on the amount of unreturned capital value plus any previously unpaid yield. This yield rate increased to 17% if we had a continuing Event of Default under the Securities Purchase Agreement.
In the event of a liquidation or dissolution of the Company, the holders of the Senior Preferred Shares would have been entitled to receive a liquidation payment in the amount of any unreturned capital plus unpaid yield prior to any distribution to any other members. As of December 31, 2008 and June 30, 2009, the unreturned capital relating to the Senior Preferred Shares was $30.0 million.
In the event of a liquidation or dissolution of the Company, the holders of the Series C Shares would have been entitled to receive a liquidation payment subsequent to the Senior Preferred shareholders based upon levels of unreturned capital and unpaid yield relating to Series A Shares.
Prior to our reorganization as described in Note 1, on September 19, 2014, the Senior Preferred Shares would have been required to be redeemed by us at Liquidation Value (as defined in the Securities Purchase Agreement). As of December 31, 2008, the unreturned capital and unpaid yield of the Senior Preferred Shares was $30.0 million and $7.2 million, respectively. As of June 30, 2009, the unreturned capital and unpaid yield of the Senior Preferred Shares were $30.0 million and $9.8 million, respectively. The Senior Preferred Shares were issued at a discount of approximately $3.7 million and accordingly the discount on the Senior Preferred Shares were being accreted using the effective interest method to the mandatory redemption date of September 19, 2014. As the Senior Preferred Shares are mandatorily redeemable, the Senior Preferred Shares are reflected as a liability in the accompanying balance sheets.
The holders of Series C Shares had the right to require us to redeem the Series C Shares at Fair Market Value (as defined in the Securities Purchase Agreement) on or after September 19, 2014. The Series C Shares were stated at fair value at December 31, 2007 and 2008, and at June 30, 2009, in the accompanying consolidated balance sheets. As the Series C Shares are optionally redeemable, the Series C Shares are reflected outside of permanent equity.
F-37
Table of Contents
HealthPort, Inc.
Notes to Consolidated Financial Statements—(Continued)
11. Members’ Equity
Series A Shares
Prior to our reorganization as described in Note 1, our LLC Agreement authorized the issuance of an unlimited number of Series A Shares. On December 29, 2006, we sold 90,000 Series A Shares for $37.2 million and on June 15, 2007, we sold 74,050 Series A Shares for $30.6 million. On September 22, 2008, we sold 54,824 Series A shares for $31.6 million primarily to our major shareholder. On October 14, 2008, we purchased 2,178 Series A Shares from our Chairman for $1.0 million. As of December 31, 2008 and June 30, 2009, there were 218,874 Series A Shares issued and 216,696 Series A Shares outstanding.
The holders of Series A Shares were entitled to one vote per Point (as defined in our LLC Agreement).
The Series A Shares earned a yield of 15% compounded annually on the amount of unreturned capital value plus any previously unpaid yield.
Prior to our reorganization as described in Note 1, in the event of a liquidation or dissolution of the Company, the holders of the Series A Shares would have been entitled to receive a liquidation payment subsequent to the Senior Preferred shareholders based upon levels of unreturned capital and unpaid yield relating to Series A Shares. In addition, the holders of Series A Shares would have shared in any remaining distributions after the previous allocation pro rata with the holders of Series C Shares and Series B Shares.
Series B Shares
Prior to our reorganization as described in Note 1, our LLC Agreement, adjusted for the 500 to 1 split on March 31, 2008, authorized the issuance of 10,000,000 Series B-1 Shares and 25,000,000 Series B-2 Shares. As of December 31, 2008 and June 30, 2009, there were 10,000,000 and 9,897,300 Series B-1 Shares and 25,000,000 and 24,742,700 Series B-2 Shares issued and outstanding. The Series B-1 Shares and Series B-2 Shares (collectively, the Series B Shares) were issued under various Incentive Share Purchase Agreements. Except for 62,500 Series B-1 Shares and 156,250 Series B-2 Shares issued on December 29, 2006, all Series B Shares were issued to our employees.
The holders of Series B-1 Shares were entitled to one vote per Point (as defined in our LLC Agreement).
The Series B Shares could not have been transferred without prior written consent of our board of directors.
In the event of a liquidation or dissolution of the Company, the holders of the Series B Shares would have been entitled to receive a liquidation payment subsequent to holders of the Senior Preferred Shares, Series A Shares and Series C Shares receiving amounts based upon levels of their unreturned capital and unpaid yield.
The Series B Shares vested over periods ranging from five to six years and are subject to continuing employment with us (for those shares issued to employees). All unvested Series B
F-38
Table of Contents
HealthPort, Inc.
Notes to Consolidated Financial Statements—(Continued)
11. Members’ Equity—Continued
Shares issued to employees were forfeited upon termination of employment. If a Sale of the Company (as defined in the Incentive Share Purchase Agreement) occurred, all Series B Shares would have vested so long as the holder of the Series B shares was still employed by us.
Prior to our reorganization as described in Note 1 the grant date fair value of the Series B Shares issued to employees was recognized as equity-based compensation in selling, general and administrative expense on the consolidated statements of operations on a straight-line basis over the requisite service period which was deemed to be the vesting period for the shares.
The assumptions utilized for our valuation analysis, which was based on option pricing methodology (OPM), for the years ended December 31, 2007 and 2008 and the six months ended June 30, 2008 and 2009 were as follows:
| Year Ended December 31, |
Six Months Ended June 30, |
|||||||||||
| 2007 | 2008 | 2008 | 2009 | |||||||||
| (unaudited) | ||||||||||||
| Risk free interest rate |
3.10 | % | 0.67 | % | 2.44 | % | 0.35 | % | ||||
| Dividend yield |
0.00 | % | 0.00 | % | 0.00 | % | 0.00 | % | ||||
| Volatility |
33.00 | % | 42.00 | % | 34.00 | % | 50.00 | % | ||||
| Expected term (in years) |
1.75 | 1.75 | 1.25 | 0.50 | ||||||||
The dividend yield of zero was based on the fact that we had no present intention to pay cash dividends. Volatility was based on the historical volatility of guideline publicly traded companies over the period commensurate with the expected time to liquidity horizon. The risk-free interest rate was derived from the average U.S. Treasury CMT rate during the period, which approximated the rate in effect as of the respective valuation dates.
F-39
Table of Contents
HealthPort, Inc.
Notes to Consolidated Financial Statements—(Continued)
11. Members’ Equity—Continued
Information regarding activity for the Series B Shares outstanding under the Incentive Shares Purchase Agreements prior to our reorganization, as described in Note 1 was as follows:
| Series B-1 Shares |
Weighted- Average Fair Value |
Series B-2 Shares |
Weighted- Average Fair Value | |||||||||
| Outstanding at January 1, 2007 |
4,875,000 | $ | 0.13 | 12,187,500 | $ | 0.04 | ||||||
| Granted |
3,125,000 | 0.44 | 7,812,500 | 0.28 | ||||||||
| Outstanding at December 31, 2007 |
8,000,000 | 0.25 | 20,000,000 | 0.13 | ||||||||
| Forfeited |
(3,000,000 | ) | 0.44 | (7,500,000 | ) | 0.28 | ||||||
| Granted |
5,000,000 | 0.28 | 12,500,000 | 0.17 | ||||||||
| Outstanding at December 31, 2008 |
10,000,000 | 0.22 | 25,000,000 | 0.12 | ||||||||
| Forfeited |
(102,700 | ) | 0.44 | (257,300 | ) | 0.28 | ||||||
| Outstanding at June 30, 2009 (unaudited) |
9,897,300 | $ | 0.21 | 24,742,700 | $ | 0.11 | ||||||
| Vested at January 1, 2007 |
1,162,500 | $ | 0.13 | 2,906,250 | $ | 0.04 | ||||||
| Vested |
681,250 | 0.13 | 1,703,125 | 0.04 | ||||||||
| Vested at December 31, 2007 |
1,843,750 | 0.13 | 4,609,375 | 0.04 | ||||||||
| Vested |
1,307,479 | 0.13 | 3,274,328 | 0.04 | ||||||||
| Vested at December 31, 2008 |
3,151,229 | 0.13 | 7,883,703 | 0.04 | ||||||||
| Vested |
172,400 | 0.37 | 430,100 | 0.23 | ||||||||
| Vested at June 30, 2009 (unaudited) |
3,323,629 | $ | 0.14 | 8,313,803 | $ | 0.05 | ||||||
As equity-based compensation expense recognized is based on awards ultimately expected to vest, it should be reduced for estimated forfeitures. SFAS No. 123R requires forfeitures to be estimated at the time of grant and revised, if necessary, in subsequent periods if actual forfeitures differ from those estimates. At December 31, 2007, 2008, and June 30, 2009 non-vested equity-based compensation, net of estimated forfeitures, totaled approximately $4.2 million, $3.6 million and $3.1 million, respectively.
Equity-based compensation was approximately $0.0 million, $0.4 million, and $0.5 million for the period from January 1, 2006 through December 30, 2006 and for the years ended December 31, 2007 and 2008, respectively, and $(5,000) and $0.4 million for the six months ended June 30, 2008 and 2009, respectively.
12. Employee Benefits
During 2008, we combined our two 401(k) Savings Plans into one plan. This plan qualifies under Section 401(k) of the Internal Revenue Code (“Code”), covering all eligible employees (except, among others, highly compensated employees as defined in the Savings Plan, certain employees designated as part time employees and employees deemed to be leased employees within the meaning of certain provisions of the Code). Employee contributions to the Savings Plan are made at predetermined rates elected by the employee. We, at our discretion, may match a percentage of employee contributions. For the period from January 1, 2006 through December 30, 2006 and for the years ended December 31, 2007 and 2008, we contributed
F-40
Table of Contents
HealthPort, Inc.
Notes to Consolidated Financial Statements—(Continued)
12. Employee Benefits—Continued
approximately $0.4 million, $0.3 million and $0.1 million, respectively, and $0.1 million and $0.0 million, respectively for the six months ending June 30, 2008 and 2009 to one of the Savings Plan.
We have a Deferred Compensation Plan (“Non-Qualified Plan”) for certain employees. On January 1, 2008, the Non-Qualified Plan was amended to comply with recently enacted tax law changes. The purpose of this Non-Qualifed Plan is to provide selected management or highly compensated personnel of our company with the opportunity to defer amounts of their compensation which might not otherwise be deferrable under other company plans, including the Savings Plans, and to receive the benefits of deferring their compensation, in the absence of certain restrictions and limitations in the Code. Participants elect the amount of pay they wish to defer and are immediately vested. The Non-Qualified Plan provides for these amounts to be paid upon termination of employment or upon change in ownership of the Company. We do not make any contributions to this plan. The Non-Qualified plan is intended to be an unfunded plan for purposes of the Employee Retirement Income Security Act of 1974, as amended (“ERISA”). Voluntary compensation deferrals are held in a “Rabbi Trust” as that term is defined in Revenue Procedure 92-64, 1992-2 C.B 422. Distributions of Plan contributions and earnings will be made upon termination of employment, disability, retirement or the financial hardship of the participant. In-service benefits are also available to participants. As of December 31, 2007, 2008 and June 30, 2009 the Non-Qualified Plan’s assets were approximately $1.2 million, $0.7 million and $0.7 million respectively. These assets represent the cash surrender value of insurance policies held in a rabbi trust for which we are the sole beneficiary and are included in other long-term assets in the accompanying consolidated balance sheets. The Non-Qualified Plan’s liabilities as of December 31, 2007, 2008 and June 30, 2009 were approximately $1.2 million, $0.7 million, and $0.7 million, respectively, and are included in other long term liabilities in the accompanying consolidated balance sheets.
13. Income Taxes
We account for income taxes in accordance with SFAS 109, Accounting for Income Taxes. Accordingly, our provision for income taxes is determined using the liability method. Under this method, deferred income tax assets and liabilities are calculated based upon the temporary differences between the financial statement and income tax bases of assets and liabilities using the combined federal and state effective tax rates that are applicable to us in a given year. The effect of a change in income tax rates on deferred income tax assets and liabilities is recognized as a component of income tax expense in the period which includes the enactment date.
The deferred income tax assets are recorded net of a valuation allowance when, based on the weight of available evidence, we believe it is more likely than not that some portion or all of the recorded deferred tax assets will not be realized in future periods. In making such determination, we consider all available positive and negative evidence, including scheduled reversals of deferred income tax liabilities, projected future taxable income, tax planning strategies and recent financial operations. In the event we were to determine that we would be able to realize the deferred income tax assets in the future in excess of their respective net recorded amounts, we would make an adjustment to the valuation allowance. This adjustment would reduce the provision for income taxes in the period of determination to the extent that the valuation allowance was not established in purchase accounting.
F-41
Table of Contents
HealthPort, Inc.
Notes to Consolidated Financial Statements—(Continued)
13. Income Taxes—Continued
Predecessor
For the period from January 1, 2006 through December 30, 2006, our operations are included in the consolidated federal income tax return of BCBSSC. Under a written tax-sharing agreement, BCBSSC allocates the tax provision to each company within the consolidated group based upon the company’s proportionate share of the consolidated federal income tax liability computed on a stand-alone basis, multiplied by the total consolidated federal income tax return liability. In accordance with the terms of the agreement, entities receive credit for a net operating loss when that loss has been used in the consolidated income tax return and has also been used in determining the entity’s base separate income tax liability.
We had income taxes receivable from BCBSSC of $0.6 million at December 31, 2006. The Company received payments from BCBSSC for income taxes of approximately $1.1 million during the period from January 1, 2006 through December 30, 2006.
At December 30, 2006, we recorded a full valuation allowance against the net deferred income tax asset, exclusive of a deferred income tax liability related to indefinite lived intangible assets, as we believe that it is not more likely than not that we would ultimately realize the net deferred income tax asset recorded at December 30, 2006.
The components of loss before income taxes were (in thousands):
| Period from January 1, 2006 through December 30, |
2006 | |||
| U.S. |
$ | (5,368 | ) | |
| Non-U.S. |
— | |||
| $ | (5,368 | ) | ||
Income tax expense/(benefit) consisted of the following (in thousands):
| Period from January 1, 2006 through December 30, |
2006 | |||
| Current tax expense |
||||
| U.S. federal |
$ | (1,583 | ) | |
| U.S. state |
(37 | ) | ||
| (1,620 | ) | |||
| Deferred tax expense |
||||
| U.S. federal |
671 | |||
| U.S. state |
96 | |||
| 767 | ||||
| Total income tax benefit |
$ | (853 | ) | |
F-42
Table of Contents
HealthPort, Inc.
Notes to Consolidated Financial Statements—(Continued)
13. Income Taxes—Continued
The following is a reconciliation of the U.S. federal statutory tax rate of 35% to our recorded income tax benefit (in thousands):
| Period from January 1, 2006 through December 30, |
2006 | ||||||
| U.S. federal statutory tax |
$ | (1,879 | ) | 35.0 | % | ||
| State income taxes, net of federal benefit |
59 | (1.1 | )% | ||||
| Permanent items |
356 | (6.6 | )% | ||||
| Change in valuation allowance |
611 | (11.4 | )% | ||||
| Income tax benefit |
$ | (853 | ) | 15.9 | % | ||
Significant components of our deferred tax assets, net of deferred tax liabilities, at December 30, 2006 were as follows (in thousands):
| 2006 | ||||
| Deferred Tax Liabilities: |
||||
| Prepaid expenses |
$ | (98 | ) | |
| Fixed assets |
(69 | ) | ||
| Total deferred tax liabilities |
(167 | ) | ||
| Deferred Tax Assets: |
||||
| Net operating loss carryforward |
67 | |||
| Intangible assets |
94 | |||
| Allowance for doubtful accounts |
493 | |||
| Accrued vacation |
124 | |||
| Valuation allowance |
(611 | ) | ||
| Total deferred tax assets |
167 | |||
| Net deferred tax assets |
$ | — | ||
At December 30, 2006, we had federal net operating loss carryforwards of approximately $0.2 million, subject to annual utilization limitations pursuant to Internal Revenue Code section 382. If not utilized, the federal net operating loss carryforwards will expire during 2020. At December 30, 2006, we had state net operating loss carryforwards of approximately $0.2 million, which have various dates of expiration.
Net deferred tax assets at December 30, 2006 were as follows (in thousands):
| 2006 | ||||
| Deferred tax assets |
$ | 778 | ||
| Deferred tax liabilities |
(167 | ) | ||
| Valuation allowance |
(611 | ) | ||
| Net deferred tax assets |
$ | — | ||
For the period from January 1, 2006 through December 30, 2006, we evaluated uncertain tax positions in accordance with SFAS 5, Accounting for Contingencies.
F-43
Table of Contents
HealthPort, Inc.
Notes to Consolidated Financial Statements—(Continued)
13. Income Taxes—Continued
Successor
Prior to our reorganization as described in Note 1, at December 31, 2007 and 2008, we were generally classified as a Limited Liability Company (LLC) for federal and state income tax purposes, which resulted in us generally not being subject to entity-level income taxes. However, we were liable for state income taxes either at reduced LLC corporation rates or at the regular corporate rates, depending on whether the state has recognized the LLC status. In most states the members are taxed individually on state corporate taxable income not subject to tax at the regular tax rates. Operations of all operating subsidiaries were included in the consolidated federal income tax return of CT Technologies Intermediate Holdings (TOPCO), Inc. (“TOPCO”) for the years ended December 31, 2007 and 2008.
At December 31, 2008 and June 30, 2009, we have recorded a full valuation allowance against the net deferred income tax asset exclusive of a deferred income tax liability related to indefinite lived intangible assets, as we believe that it is not more likely than not that it will ultimately realize the net deferred income tax asset recorded at December 31, 2008 and June 30, 2009. We recorded approximately $22.3 million of the valuation allowance in purchase accounting in connection with the acquisition of ChartOne, Inc. in September 2008; we recorded the remaining $4.1 million of the valuation allowance at December 31, 2008 as a component of income tax benefit. Prior to the adoption of SFAS 141(R), to the extent that any valuation allowances established in purchase accounting are reduced, these reductions are recorded as adjustments to goodwill rather than to the provision for income taxes. Beginning January 1, 2009, these reductions will be recorded through our statement of operations as a result of our adoption of SFAS 141(R).
We have computed the tax provision for the six months ended June 30, 2009 in accordance with the provisions of FASB Interpretation No. 18, Accounting for Income Taxes in Interim Periods, and Accounting Principles Board Opinion No. 28, Interim Financial Reporting. We did not recognize an income tax benefit in tax jurisdictions which incurred pre-tax losses for the six months ended June 30, 2009 because we have concluded that we will ultimately not be able to realize these losses during the remainder of fiscal year 2009 and we do not expect to recognize a deferred tax asset related to such losses at December 31, 2009 that will more likely than not be realized. The income tax expense recorded for the six months ended June 30, 2009 relates to the change in the deferred income tax liability for indefinite lived intangible assets which cannot be considered when assessing the need for a valuation allowance to be recorded against the Company’s net deferred income tax asset at June 30, 2009.
The components of loss before income taxes were (in thousands):
| December 31, | June 30, | |||||||||||
| 2007 | 2008 | 2009 | ||||||||||
| U.S. |
$ | (11,877 | ) | $ | (48,467 | ) | $ | (5,823 | ) | |||
| Non-U.S. |
— | — | — | |||||||||
| $ | (11,877 | ) | $ | (48,467 | ) | $ | (5,823 | ) | ||||
F-44
Table of Contents
HealthPort, Inc.
Notes to Consolidated Financial Statements—(Continued)
13. Income Taxes—Continued
Income tax (benefit) expense consisted of the following (in thousands):
| December 31, | June 30, | ||||||||||
| 2007 | 2008 | 2009 | |||||||||
| Current tax expense |
|||||||||||
| U.S. federal |
$ | — | $ | — | $ | — | |||||
| U.S. state |
— | — | — | ||||||||
| — | — | — | |||||||||
| Deferred tax expense |
|||||||||||
| U.S. federal |
(4,866 | ) | (1,880 | ) | 945 | ||||||
| U.S. state |
(392 | ) | 471 | 105 | |||||||
| (5,258 | ) | (1,409 | ) | 1,050 | |||||||
| Total income tax (benefit) expense |
$ | (5,258 | ) | $ | (1,409 | ) | $ | 1,050 | |||
The following is a reconciliation of the U.S. federal statutory tax rate of 35% to our recorded income tax expense/(benefit) (in thousands):
| Years ended December 31, | Six months ended June 30, 2009 |
||||||||||||||||||||
| 2007 | 2008 | ||||||||||||||||||||
| U.S. federal statutory tax |
$ | (4,157 | ) | 35.0 | % | $ | (16,964 | ) | 35.0 | % | $ | (2,038 | ) | 35.0 | % | ||||||
| State income taxes, net of federal benefit |
(291 | ) | 2.5 | 471 | (1.0 | ) | 267 | (4.6 | ) | ||||||||||||
| Non-deductible interest expense |
— | — | 2,279 | (4.7 | ) | 853 | (14.6 | ) | |||||||||||||
| Goodwill impairment |
— | — | 6,309 | (13.0 | ) | — | — | ||||||||||||||
| Other permanent items |
209 | (1.8 | ) | 401 | (0.8 | ) | 188 | (3.2 | ) | ||||||||||||
| Prior year reconciliation adjustments |
(1,019 | ) | 8.6 | 1,974 | (4.1 | ) | — | — | |||||||||||||
| Change in valuation allowance |
— | — | 4,121 | (8.5 | ) | 1,780 | (30.6 | ) | |||||||||||||
| Income tax benefit |
$ | (5,258 | ) | 44.3 | % | $ | (1,409 | ) | 2.9 | % | $ | 1,050 | (18.0 | )% | |||||||
F-45
Table of Contents
HealthPort, Inc.
Notes to Consolidated Financial Statements—(Continued)
13. Income Taxes—Continued
Significant components of our deferred income tax assets and liabilities and valuation allowance at December 31 were as follows (in thousands):
| 2007 | 2008 | |||||||
| Deferred Tax Liabilities: |
||||||||
| Identifiable intangible assets |
$ | (27,955 | ) | $ | (33,315 | ) | ||
| Property and equipment |
(1,243 | ) | (415 | ) | ||||
| Other |
(3,612 | ) | (342 | ) | ||||
| Total deferred tax liabilities |
(32,810 | ) | (34,072 | ) | ||||
| Deferred Tax Assets: |
||||||||
| Net operating loss carryforwards |
16,647 | 49,120 | ||||||
| Accrued liabilities |
2,016 | 2,030 | ||||||
| Allowance for doubtful accounts |
4,191 | 5,619 | ||||||
| Unrealized hedging loss |
— | 883 | ||||||
| Other |
3,916 | 98 | ||||||
| Valuation allowance |
— | (26,429 | ) | |||||
| Total deferred tax assets |
26,770 | 31,321 | ||||||
| Net deferred tax liability |
$ | (6,040 | ) | $ | (2,751 | ) | ||
At December 31, 2007 and 2008 and June 30, 2009, TOPCO and subsidiaries had federal net operating loss carryforwards of approximately $40.0 million, $126.0 million and $126.0 million, respectively, subject to annual utilization limitations pursuant to Internal Revenue Code section 382. If not utilized, the federal net operating loss carryforwards will expire between 2012 and 2029. At December 31, 2008 and June 30, 2009, TOPCO and subsidiaries had approximately $0.1 million of federal general business tax credits which will expire between 2008 and 2025 if not utilized. At December 31, 2007 and 2008 and June 30, 2009, TOPCO and subsidiaries has state net operating loss carryforwards of approximately $28.3 million, $90.4 million and $81.0 million, respectively which have various dates of expiration.
Net deferred tax assets and liabilities at December 31 were as follows (in thousands):
| 2007 | 2008 | |||||||
| Deferred tax assets |
$ | 26,770 | $ | 57,750 | ||||
| Deferred tax liabilities |
(32,810 | ) | (34,072 | ) | ||||
| Valuation allowance |
— | (26,429 | ) | |||||
| Net deferred tax liability |
$ | (6,040 | ) | $ | (2,751 | ) | ||
In July 2006, the FASB issued FIN 48, Accounting for Uncertainty in Income Taxes, which provides clarification of SFAS 109 with respect to the recognition of income tax benefits of uncertain income tax positions in the financial statements. FIN 48 requires uncertain income tax positions to be reviewed and assessed with recognition and measurement of the income tax benefit related to such uncertain income tax position on a “more likely than not” standard. Income tax benefits of uncertain income tax positions taken on income tax returns which do not qualify for financial statement recognition are required to be disclosed in the financial
F-46
Table of Contents
HealthPort, Inc.
Notes to Consolidated Financial Statements—(Continued)
13. Income Taxes—Continued
statements. Pursuant to FASB Staff Position FIN 48-3, Effective Date of FASB Interpretation No. 48 for Certain Nonpublic Enterprises, non-public companies are required to adopt the provisions of FIN 48 for years beginning after December 15, 2008.
We adopted the provisions of FIN 48 on January 1, 2009. As a result of the implementation of FIN 48, we recognized no cumulative effect adjustment. At January 1 and June 30, 2009, we had $0.6 million of unrecognized tax benefits, none of which would affect our effective tax rate if recognized.
We recognize interest and penalties related to uncertain tax positions in income tax expense. As of June 30, 2009, we have no accrued interest and penalties related to uncertain tax positions due to the net operating loss position of the Company. We do not expect any significant increases or decreases in the unrecognized tax benefit within twelve months of the reporting date.
Our federal and state income tax returns filed for tax years 2007 and 2008, the pre-acquisition federal and state income filed by Companion for tax years 2005 through 2006, the pre-acquisition federal and state income tax returns filed by Smart Holdings Corporation for tax years 2005 through 2007, the pre-acquisition federal and state income tax returns filed by Micro Innovations, Inc. for tax years 2005 through 2006 and the pre-acquisition federal and state income tax returns filed by ChartOne for the tax years 2005 through 2008 generally remain open for examination by the Internal Revenue Service and relevant state taxing jurisdictions. In addition net operating losses from the years 1997 through 2004 still remain open to examination.
Our effective tax rate on income from continuing operations is approximately 19.7% and (18.0)% for the first six months ended June 30, 2008 and June 30, 2009 respectively. The increase in tax expense from the first six months of 2008 to the first six months of 2009 is primarily driven by the increase in the valuation allowance established as part of the ChartOne acquisition in the third quarter of 2008. In 2009, the Company continues to have a full valuation allowance against its net deferred tax assets exclusive of indefinite lived intangible assets.
Our income tax expense was $1.1 million for the six months ended June 30, 2009 compared to an income tax benefit of $1.5 million for the six months ended June 30, 2008, which resulted in an effective income tax rate of approximately (18%) and 20%, respectively. For the period ended June 30, 2009, the income tax expense is solely related to the change during the period in the deferred income tax liability related to indefinite lived intangible assets which is not a component of the net deferred income tax asset being offset by a valuation allowance at June 30, 2009. The change in the deferred income tax liability related to indefinite lived intangible assets is attributable to amortization claimed for income tax purposes but not for financial accounting purposes during the period. For the period ended June 30, 2008, the differences between the federal statutory rate and the effective income tax rate were caused by adjustments related to state income taxes, non-deductible interest expense and non-deductible equity compensation.
As of June 30, 2009, we are currently not under examination by the Internal Revenue Service or any state tax jurisdiction. As of June 30, 2009, we do not believe that the gross recorded unrecognized tax benefits will materially change within the next 12 months. See note 13 in the consolidated financial statements for the year ended December 31, 2008 contained elsewhere in this prospectus for additional information about our income taxes.
F-47
Table of Contents
HealthPort, Inc.
Notes to Consolidated Financial Statements—(Continued)
14. Discontinued Operations
In August 2008, we sold the operations of DMS to a third party. As a result, the operations of DMS are reflected as discontinued operations. The consolidated financial statements for all periods presented have been reclassified to reflect discontinued operations. Included in discontinued operations are income tax benefits of approximately $0.4 million, $1.7 million and $0.6 million for the years ended December 31, 2007 and 2008 and for the six months ended June 30, 2008, respectively.
The operating results of discontinued operations are summarized as follows for the period from January 1, 2006 through December 30, 2006 and for the years ended December 31, 2007 and 2008, and for the six months ending June 30, 2008. (in thousands):
| 2007 | 2008 | June 30, 2008 |
||||||||||
| (unaudited) | ||||||||||||
| Discontinued operations |
||||||||||||
| Net revenues |
$ | 6,632 | $ | 2,717 | $ | 2,340 | ||||||
| Net loss |
(732 | ) | (1,426 | ) | (936 | ) | ||||||
| 2008 | ||||||||||||
| Loss on disposal |
||||||||||||
| Loss on sale of discontinued operations, net of tax |
$ | (1,306 | ) | |||||||||
15. Operating Leases
The Company leases office facilities, photocopiers, computers, and other office equipment under the terms of various operating leases with non-related parties. For the period from January 1, 2006 through December 30, 2006 and for the years ended December 31, 2007 and 2008 rent expense under these lease agreements approximated $1.7 million, $2.4 million and $4.1 million respectively, and $1.8 million and $2.6 million for the six months ended June 30, 2008 and 2009, respectively.
At December 31, 2008, aggregate minimum lease payments on operating leases with original or remaining terms in excess of one year are as follows (in thousands):
| Year ended December 31, |
|||
| 2009 |
$ | 4,792 | |
| 2010 |
2,390 | ||
| 2011 |
1,388 | ||
| 2012 |
961 | ||
| 2013 |
869 | ||
| Thereafter |
2,469 | ||
| Total |
$ | 12,869 | |
F-48
Table of Contents
HealthPort, Inc.
Notes to Consolidated Financial Statements—(Continued)
16. Related-Party Transactions
Predecessor
For the year ended 2006, a portion of our offices, other facilities and services are provided by BCBSSC. Reimbursement of BCBSSC for these costs is based on allocations of actual costs incurred. Expenses allocated to us for 2006 were approximately $14.8 million. Other receivables include allocations made to the Company to fund operations, net of repayments. Such allocations are not necessarily indicative of the costs that would have been incurred if we had been a separate entity.
BCBSSC had a significant investment in one of our customers. Sales to this customer were approximately $0.008 million in 2006. As of December 30, 2006, trade receivables included amounts due from this customer of approximately $0.5 million. Approximately 93% of the balances at December 30, 2006 are in the form of installment sales or leases.
Successor
For the years ended December 31, 2007 and 2008, we paid consulting fees to an entity owned by our Chairman of the board of directors totaling approximately $0.6 million and $0.8 million, respectively, and $0.4 million and $0.5 million, for the six months ended June 30, 2008 and 2009, respectively.
During 2008, we issued promissory notes with an aggregate principal value of approximately $1.1 million to our Chairman of the board of directors. In October 2008, we purchased approximately 2,178 of our Series A Shares from our Chairman. We paid approximately $0.5 million in cash and a portion of this repurchase amount was used as repayment of $0.8 million plus accrued interest of these promissory notes. At December 31, 2008, one promissory note remained outstanding in the amount of approximately $0.3 million with a due date of January 31, 2009. In January 2009, the promissory note was extended for an additional year. In May 2009, we issued two additional promissory notes totaling approximately $0.5 million which are due January 1, 2010. At June 30, 2009, three promissory notes were outstanding in the amount of approximately $0.8 million. On August 14, 2009, we repurchased approximately 911 of our Series A Shares from our Chairman for approximately $0.8 million in cash. Interest on the notes is due annually and was accrued at 9.12% for the year ended December 31, 2008 and 9.16% for the six months ended June 30, 2009. The notes are included in other assets in the accompanying consolidated balance sheets.
17. Contingent Liabilities
We are subject to claims and various legal proceedings arising in the ordinary course of business. Based upon information available to date, management believes it has provided adequate reserves if needed for any unfavorable settlement; however, there can be no assurance that the ultimate resolution of such current pending legal proceedings would not have a material adverse effect on our financial condition or liquidity position.
We have entered into employment agreements with certain of our employees which provide, among other things, salary, benefits and perquisites, as well as additional compensation for certain changes in control of the Company or a failure of the Company to comply with any material terms of the agreements.
F-49
Table of Contents
HealthPort, Inc.
Notes to Consolidated Financial Statements—(Continued)
18. Segment Information
We have two reportable segments: Release of Information (“ROI”) and Software and Other Services. SFAS 131, Disclosures about Segments of an Enterprise and Related Information (“SFAS 131”), defines reportable segments as components of an enterprise about which separate financial information is available that is evaluated regularly by the chief operating decision maker (“CODM”) in deciding how to allocate resources and in assessing financial performance. SFAS 131 indicates that financial information about segments should be reported on the same basis as that which is used by the CODM in the analysis of performance and allocation of resources.
Management of the Company, including our CODM, evaluates performance based on operating income, excluding corporate, general and administrative expenses. Asset information by segment, including capital expenditures and net income (loss) beyond operating contribution margins are not prepared and are not provided to our CODM.
ROI
ROI is the process by which requestors outside the health information management department of a hospital or physician clinic with a legitimate need and proper authorization can receive access to the information contained in patient’s health records. ROI services consist of processing requests for a patient’s health records from such a requestor. Requestors access these health records for a variety of reasons, including attorneys, usually for a legal proceeding; insurance companies, usually to help underwrite a policy or pay a claim; government agencies, usually to verify Medicare status; or physicians, healthcare institutions or individuals, usually for medical purposes. Typically we use our proprietary technology to efficiently manage the ROI process in an accurate, timely and regulatory-compliant manner. The average ROI service price for a billable request is approximately $38, although pricing is regulated by state law, depending on the type of requestor and purpose of request and size of record, and varies from state to state. Fees are recurring in nature because of the contractual nature of our business and associated maintenance revenues. Our employees scan documents at the different sites and transmit the files to our Corporate office for processing and billing.
Software and Other Services
In our software and other services segment, we provide proprietary software to physicians’ offices and hospitals which enables the electronic submission of claims to third-party payers, post contract customer support, subscription and transaction fees, and related consulting fees.
The following table summarizes goodwill for each of our company’s operating segments (in thousands):
| 2007 | 2008 | June 30, 2009 | |||||||
| (unaudited) | |||||||||
| ROI(1) |
$ | 109,693 | $ | 177,739 | $ | 177,827 | |||
| Software and Other Services(2) |
18,951 | — | — | ||||||
| Total |
$ | 128,644 | $ | 177,739 | $ | 177,827 | |||
| (1) | Acquired 100% of the outstanding stock of Chart One. |
| (2) | After completing our Annual impairment test in 2008, we concluded that goodwill from our Companion acquisition was impaired and wrote off $18.3 million. |
F-50
Table of Contents
HealthPort, Inc.
Notes to Consolidated Financial Statements—(Continued)
18. Segment Information—Continued
The following tables present segment gross profit and financial position information as utilized by our CODM (in thousands):
| ROI | Software and Other Services |
Consolidated Total | |||||||
| Period from January 1, 2006 through December 30, 2006 |
|||||||||
| Net revenue |
$ | — | $ | 38,267 | $ | 38,267 | |||
| Costs of services and products |
— | 12,663 | 12,663 | ||||||
| Gross profit |
$ | — | $ | 25,604 | $ | 25,604 | |||
| Year Ended December 31, 2007 |
|||||||||
| Net revenue |
$ | 64,687 | $ | 37,682 | $ | 102,369 | |||
| Costs of services and products |
38,638 | 15,680 | 54,318 | ||||||
| Gross profit |
$ | 26,049 | $ | 22,002 | $ | 48,051 | |||
| Year Ended December 31, 2008 |
|||||||||
| Net revenue |
$ | 149,825 | $ | 38,344 | $ | 188,169 | |||
| Costs of services and products |
91,265 | 18,708 | 109,973 | ||||||
| Gross profit |
$ | 58,560 | $ | 19,636 | $ | 78,196 | |||
| Six Months Ended June 30, 2008 (unaudited) |
|||||||||
| Net revenue |
$ | 63,880 | $ | 19,942 | $ | 83,822 | |||
| Costs of services and products |
37,953 | 8,876 | 46,829 | ||||||
| Gross profit |
$ | 25,927 | $ | 11,066 | $ | 36,993 | |||
| Six Months Ended June 30, 2009 (unaudited) |
|||||||||
| Net revenue |
$ | 107,853 | $ | 18,953 | $ | 126,806 | |||
| Costs of services and products |
65,106 | 8,828 | 73,934 | ||||||
| Gross profit |
$ | 42,747 | $ | 10,125 | $ | 52,872 | |||
F-51
Table of Contents
HealthPort, Inc.
Notes to Consolidated Financial Statements—(Continued)
18. Segment Information—Continued
SFAS No. 131 requires that the total of the reportable segments’ measures of profit or loss be reconciled to the Company’s consolidated operating results. The following table reconciles Segment Gross Profit to consolidated net loss for each of the years ended December 31, 2006, 2007 and 2008 and for the six months ended June 30, 2008 and 2009 (in thousands):
| Successor | ||||||||||||||||||||||
| Predecessor Period from January 1, 2006- December 30, 2006 |
Year Ended December 31, |
Six Months Ended June 30, (unaudited) |
||||||||||||||||||||
| 2007 | 2008 | 2008 | 2009 | |||||||||||||||||||
| ROI Gross Profit |
$ | — | $ | 26,049 | $ | 58,560 | $ | 25,927 | $ | 42,747 | ||||||||||||
| Software and Other Services Gross Profit |
25,604 | 22,002 | 19,636 | 11,066 | 10,125 | |||||||||||||||||
| Total Reportable Segment Gross Profit |
25,604 | 48,051 | 78,196 | 36,993 | 52,872 | |||||||||||||||||
| Bad debt recovery (expense) |
185 | (3,216 | ) | (9,088 | ) | (4,414 | ) | (5,260 | ) | |||||||||||||
| Selling, general, and administrative |
(31,744 | ) | (40,287 | ) | (56,575 | ) | (25,679 | ) | (30,789 | ) | ||||||||||||
| Depreciation and amortization expense |
(676 | ) | (6,099 | ) | (12,183 | ) | (5,726 | ) | (7,274 | ) | ||||||||||||
| Impairment of goodwill and intangible assets |
— | — | (25,966 | ) | — | — | ||||||||||||||||
| Interest expense, net |
— | (10,333 | ) | (20,906 | ) | (8,781 | ) | (14,956 | ) | |||||||||||||
| Interest income |
60 | — | — | — | — | |||||||||||||||||
| Change in fair value of interest rate swaps |
— | 7 | (1,945 | ) | — | (416 | ) | |||||||||||||||
| Equity in net gains of affiliates |
1,426 | — | — | — | — | |||||||||||||||||
| Loss on transfer of investment in affiliate |
(223 | ) | — | — | — | — | ||||||||||||||||
| Income tax benefit (expense) |
853 | 5,258 | 1,409 | 1,501 | (1,050 | ) | ||||||||||||||||
| Loss from discontinued operations, net of tax |
— | (732 | ) | (1,426 | ) | (936 | ) | — | ||||||||||||||
| Loss on sale of discontinued operations, net of tax |
— | — | (1,306 | ) | — | — | ||||||||||||||||
| Net loss |
$ | (4,515 | ) | $ | (7,351 | ) | $ | (49,790 | ) | $ | (7,042 | ) | $ | (6,873 | ) | |||||||
F-52
Table of Contents
HealthPort, Inc.
Notes to Consolidated Financial Statements—(Continued)
19. Valuation and Qualifying Accounts
We maintain an allowance for doubtful accounts that is recorded as a contra asset to our accounts receivable balance. We also maintain a valuation allowance that is recorded as a contra asset to our deferred tax asset balance. The following table sets forth the change in each of those reserves for the period from January 1, 2006 through December 30, 2006 and the years ended December 31, 2007 and 2008.
| December 30, 2006 |
December 31, | |||||||||||
| Allowance for Doubtful Accounts |
2007 | 2008 | ||||||||||
| (In thousands) | ||||||||||||
| Balance at beginning of period |
$ | 1,180 | $ | 1,231 | $ | 9,909 | ||||||
| Expense (recoveries) |
(185 | ) | 3,216 | 9,008 | ||||||||
| Write-offs and collections |
— | (4,736 | ) | (8,034 | ) | |||||||
| Acquisitions |
— | 10,198 | 3,571 | |||||||||
| Other |
236 | — | — | |||||||||
| Balance at end of period |
$ | 1,231 | $ | 9,909 | $ | 14,454 | ||||||
| December 30, 2006 |
December 31, | |||||||||||
| Valuation Allowance |
2007 | 2008 | ||||||||||
| (In thousands) | ||||||||||||
| Balance at beginning of period |
$ | — | $ | — | $ | — | ||||||
| Additions |
611 | — | 4,121 | |||||||||
| Deductions |
— | — | — | |||||||||
| Acquisition |
— | — | 22,308 | |||||||||
| Balance at end of period |
$ | 611 | — | $ | 26,429 | |||||||
F-53
Table of Contents
CONSOLIDATED FINANCIAL STATEMENTS
Smart Holdings Corp.
Years Ended September 30, 2006, 2005 and 2004
With Report of Independent Auditors
F-54
Table of Contents
Smart Holdings Corp.
Consolidated Financial Statements
Years Ended September 30, 2006, 2005 and 2004
Contents
F-55
Table of Contents
Report of Independent Auditors
Board of Directors
Smart Holdings Corp.
We have audited the accompanying consolidated balance sheets of Smart Holdings Corp. (the Company) as of September 30, 2006 and 2005, and the related consolidated statements of operations, stockholders’ deficit and cash flows for each of the three years in the period ended September 30, 2006. These financial statements are the responsibility of the Company’s management. Our responsibility is to express an opinion on these financial statements based on our audits.
We conducted our audits in accordance with auditing standards generally accepted in the United States. Those standards require that we plan and perform the audit to obtain reasonable assurance about whether the financial statements are free of material misstatement. We were not engaged to perform an audit of the Company’s internal control over financial reporting. Our audits included consideration of internal control over financial reporting as a basis for designing audit procedures that are appropriate in the circumstances, but not for the purpose of expressing an opinion on the effectiveness of the Company’s internal control over financial reporting. Accordingly, we express no such opinion. An audit also includes examining, on a test basis, evidence supporting the amounts and disclosures in the financial statements, assessing the accounting principles used and significant estimates made by management and evaluating the overall financial statement presentation. We believe that our audits provide a reasonable basis for our opinion.
In our opinion, the financial statements referred to above present fairly, in all material respects, the consolidated financial position of Smart Holdings Corp. at September 30, 2006 and 2005, and the consolidated results of its operations and its cash flows for each of the three years in the period ended September 30, 2006, in conformity with U.S. generally accepted accounting principles.
| Atlanta, Georgia |
/s/ Ernst & Young LLP | |||||
| August 14, 2009 |
||||||
F-56
Table of Contents
| September 30 | ||||||
| 2006 | 2005 | |||||
| Assets |
||||||
| Current assets: |
||||||
| Cash and cash equivalents |
$ | 2,559,498 | $ | 2,566,860 | ||
| Trade accounts receivable, net of allowances of approximately $9,832,000 and $11,323,000 |
14,832,156 | 12,426,942 | ||||
| Other accounts receivable |
502,459 | 390,783 | ||||
| Inventory |
1,061,462 | — | ||||
| Due from minority interest member |
– | 153,442 | ||||
| Prepaid expenses and other current assets |
1,571,991 | 1,609,572 | ||||
| Total current assets |
20,527,566 | 17,147,599 | ||||
| Property and equipment, net |
8,007,039 | 10,779,179 | ||||
| Goodwill |
51,118,544 | 51,134,710 | ||||
| Customer base, net of amortization of $696,395 and $8,242,922 as of September 30, 2006 and 2005, respectively |
4,262,790 | 5,482,080 | ||||
| Covenants not to compete, net of amortization of $712,744 and $556,762 as of September 30, 2006 and 2005, respectively |
266,588 | 422,568 | ||||
| Other assets |
816,360 | 400,406 | ||||
| $ | 84,998,887 | $ | 85,366,542 | |||
See accompanying notes.
F-57
Table of Contents
Smart Holdings Corp.
Consolidated Balance Sheets
| September 30 | ||||||||
| 2006 | 2005 | |||||||
| Liabilities and Stockholders’ Deficit |
||||||||
| Current liabilities: |
||||||||
| Long-term obligations, current portion |
$ | 4,800,000 | $ | 4,800,000 | ||||
| Promissory notes with related parties, current portion |
83,903,764 | — | ||||||
| Line of credit |
2,500,000 | 5,000,000 | ||||||
| Accounts payable |
2,738,099 | 1,807,746 | ||||||
| Accrued salaries and bonuses |
2,971,380 | 2,360,662 | ||||||
| Deferred revenue |
1,787,064 | — | ||||||
| Income tax payable |
14,346 | 18,565 | ||||||
| Other accrued expenses |
1,848,886 | 1,951,380 | ||||||
| Total current liabilities |
100,563,539 | 15,938,353 | ||||||
| Long-term obligations, net of current portion |
1,059,094 | 5,770,872 | ||||||
| Promissory notes with related parties, net of current portion |
— | 74,317,346 | ||||||
| Deferred tax liability |
5,296,218 | 4,140,223 | ||||||
| Minority interest |
1,413,524 | 968,723 | ||||||
| Stockholders’ deficit: |
||||||||
| Capital stock, $0.01 par value, 1,700,000 shares authorized and 1,667,429 shares issued and outstanding as of September 30, 2006 and 2005 |
16,674 | 16,674 | ||||||
| Accumulated deficit |
(23,350,162 | ) | (15,785,649 | ) | ||||
| Total stockholders’ deficit |
(23,333,488 | ) | (15,768,975 | ) | ||||
| $ | 84,998,887 | $ | 85,366,542 | |||||
See accompanying notes.
F-58
Table of Contents
Consolidated Statements of Operations
| Year Ended September 30 | ||||||||||||
| 2006 | 2005 | 2004 | ||||||||||
| Revenue |
$ | 113,630,463 | $ | 100,333,650 | $ | 93,652,387 | ||||||
| Cost of services: |
||||||||||||
| Salaries and benefits |
49,756,398 | 44,028,817 | 40,176,064 | |||||||||
| Rent expense |
2,398,667 | 2,308,494 | 2,118,157 | |||||||||
| Retrieval fees |
1,705,388 | 1,574,044 | 1,172,034 | |||||||||
| Supplies and postage |
9,893,138 | 8,940,752 | 8,586,556 | |||||||||
| Bad debts expense |
7,280,686 | 8,143,249 | 7,890,993 | |||||||||
| Depreciation and amortization expense |
7,483,680 | 6,765,527 | 6,360,185 | |||||||||
| Other |
6,376,251 | 5,179,021 | 5,257,964 | |||||||||
| Total costs of services |
84,894,208 | 76,939,904 | 71,561,953 | |||||||||
| Gross profit |
28,736,255 | 23,393,746 | 22,090,434 | |||||||||
| Selling expenses |
6,862,950 | 5,006,407 | 5,073,201 | |||||||||
| General and administrative expenses |
16,915,457 | 12,906,336 | 13,569,096 | |||||||||
| Financing costs |
10,671,920 | 9,558,446 | 9,096,658 | |||||||||
| Loss before provision for income taxes |
(5,714,072 | ) | (4,077,443 | ) | (5,648,521 | ) | ||||||
| Provision for income taxes |
1,166,180 | 1,306,471 | 1,250,735 | |||||||||
| Net loss before minority interest in subsidiary |
(6,880,252 | ) | (5,383,914 | ) | (6,899,256 | ) | ||||||
| Minority interest |
444,801 | 430,065 | 212,271 | |||||||||
| Net loss |
$ | (7,325,053 | ) | $ | (5,813,979 | ) | $ | (7,111,527 | ) | |||
See accompanying notes.
F-59
Table of Contents
Consolidated Statements of Changes in Stockholders’ Deficit
| Common Stock | Accumulated Deficit |
Total Stockholders’ Deficit |
|||||||||||
| Shares | Value | ||||||||||||
| Balance at October 1, 2003 |
1,667,429 | $ | 16,674 | (2,487,615 | ) | $ | (2,470,941 | ) | |||||
| Net loss |
— | — | (7,111,527 | ) | (7,111,527 | ) | |||||||
| Distributions |
— | — | (130,339 | ) | (130,339 | ) | |||||||
| Balance at September 30, 2004 |
1,667,429 | 16,674 | (9,729,481 | ) | (9,712,807 | ) | |||||||
| Net loss |
— | — | (5,813,979 | ) | (5,813,979 | ) | |||||||
| Distributions |
— | — | (242,189 | ) | (242,189 | ) | |||||||
| Balance at September 30, 2005 |
1,667,429 | 16,674 | (15,785,649 | ) | (15,768,975 | ) | |||||||
| Net loss |
— | — | (7,325,053 | ) | (7,325,053 | ) | |||||||
| Distributions |
— | — | (239,460 | ) | (239,460 | ) | |||||||
| Balance at September 30, 2006 |
1,667,429 | $ | 16,674 | $ | (23,350,162 | ) | $ | (23,333,488 | ) | ||||
See accompanying notes.
F-60
Table of Contents
Consolidated Statements of Cash Flows
| Year Ended September 30 | ||||||||||||
| 2006 | 2005 | 2004 | ||||||||||
| Operating activities |
||||||||||||
| Net loss |
$ | (7,325,053 | ) | $ | (5,813,979 | ) | $ | (7,111,527 | ) | |||
| Adjustments to reconcile net income to net cash provided by operating activities |
||||||||||||
| Depreciation and amortization |
7,483,680 | 6,765,527 | 6,360,185 | |||||||||
| Non cash interest expense |
9,586,418 | 8,397,826 | 7,480,484 | |||||||||
| Amortization of deferred financing costs |
88,222 | 396,764 | 472,000 | |||||||||
| Provision for doubtful accounts |
7,280,686 | 8,143,249 | 7,890,993 | |||||||||
| Minority interest |
444,801 | 430,065 | 212,271 | |||||||||
| Deferred taxes |
1,155,962 | 1,301,649 | 1,241,536 | |||||||||
| Changes in operating assets and liabilities: |
||||||||||||
| Trade accounts receivable |
(9,685,900 | ) | (9,060,468 | ) | (7,776,071 | ) | ||||||
| Other accounts receivable |
(111,676 | ) | (7,578 | ) | (132,464 | ) | ||||||
| Inventory |
(1,061,462 | ) | — | — | ||||||||
| Prepaid expenses and other current assets |
(378,373 | ) | 203,659 | 8,755 | ||||||||
| Accounts payable |
930,386 | 626,233 | 48,738 | |||||||||
| Accrued salaries and bonuses |
610,718 | (541,879 | ) | (497,765 | ) | |||||||
| Deferred revenue |
1,787,064 | — | — | |||||||||
| Income tax payable |
(4,219 | ) | 12,780 | 1,022 | ||||||||
| Due from minority interest holder |
136,586 | 127,517 | 256,186 | |||||||||
| Other accrued expenses |
(85,638 | ) | (704,818 | ) | 648,958 | |||||||
| Net cash provided by operating activities |
10,852,202 | 10,276,547 | 9,103,301 | |||||||||
| Investing Activities |
||||||||||||
| Purchases of Equipment |
(2,060,677 | ) | (2,280,973 | ) | (2,000,121 | ) | ||||||
| Acquisition and investments |
(1,259,427 | ) | (10,400,000 | ) | — | |||||||
| Net cash used in investing activities |
(3,320,104 | ) | (12,680,973 | ) | (2,000,121 | ) | ||||||
| Financing Activities |
||||||||||||
| Payments of long-term obligations |
(9,300,000 | ) | (8,608,366 | ) | (5,966,634 | ) | ||||||
| Borrowings |
2,000,000 | 8,000,000 | — | |||||||||
| Financing issuance costs |
— | (291,559 | ) | — | ||||||||
| Distributions to stockholder |
(239,460 | ) | (242,189 | ) | (333,810 | ) | ||||||
| Net cash used in financing activities |
(7,539,460 | ) | (1,142,114 | ) | (6,300,444 | ) | ||||||
| Net change in cash and cash equivalents |
(7,362 | ) | (3,546,540 | ) | 802,736 | |||||||
| Cash and cash equivalents, beginning of year |
2,566,860 | 6,113,400 | 5,310,664 | |||||||||
| Cash and cash equivalents, end of year |
$ | 2,559,498 | $ | 2,566,860 | $ | 6,113,400 | ||||||
See accompanying notes.
F-61
Table of Contents
Notes to Consolidated Financial Statements
1. Summary of Significant Accounting Policies
Organization and Business
Smart Holdings Corp. (Smart Holdings or the Company) was incorporated on May 28, 2002 under the laws of the state of Delaware for the purpose of acquiring JAS Imaging. On June 13, 2002 Smart Holdings completed its acquisition of 90% of JAS Imaging, LLC. Concurrent with the acquisition, JAS Imaging’s name was changed to Smart Document Solutions, LLC (SDS). As a result of the acquisition, SDS became a 90% owned subsidiary of Smart Holdings. Smart Holdings’ principal operations are conducted through its majority owned subsidiary SDS.
SDS’s principal business activity is to provide outsourcing of photocopy and release of information services of medical records for hospitals, attorneys, insurance companies and other users of such records throughout the United States. The Company’s administrative facilities are located in Alpharetta, Georgia and the Company maintains regional offices in various states. In August 2005, the Company purchased 100% of the outstanding stock of Micro Innovations, Inc. (Micro).
Basis of Presentation
The consolidated financial statements include the accounts of the Company and its wholly owned and majority owned subsidiaries. All significant intercompany accounts have been eliminated in consolidation.
Revenue Recognition
Revenue is recognized as photocopy services are performed and copies are delivered to customers. Photocopy and release of information revenue is generally comprised of a base fee and a per-page fee depending on the number of pages requested. The Company recognizes revenue for shipping and handling costs related to the delivery of copies to customers, and the corresponding shipping and handling costs are classified within the consolidated statements of operations as supplies and postage. Shipping and handling fees included in revenue were approximately $4,714,000, $4,267,000 and $4,288,000 for the years ended September 30, 2006, 2005 and 2004, respectively.
The Company accounts for certain of its contracts using the proportional performance method based upon the pattern of performance of recognizing revenue and expenses. The proportional performance method is used only for contracts where project stages are clearly defined and can be invoiced and where the contract contains enforceable rights by both parties. The Company invoices customers for all unbilled revenues. The Company reviews contract prices and cost estimates and reflects adjustments in the period when the estimates are revised.
For certain of the Company’s release of information customers, cash is due prior to the delivery of the copies to the customer. Recognition of revenue relating to these customers and related direct costs are deferred until payment is received and copies are delivered. As of September 30, 2006 and 2005, approximately $1,787,000 and $0 of revenue, respectively has been deferred relating to these customers and is included as deferred revenue in the accompanying consolidated balance sheets. Direct costs associated with the deferred revenue
F-62
Table of Contents
Smart Holdings Corp.
Notes to Consolidated Financial Statements—(Continued)
1. Summary of Significant Accounting Policies—Continued
as of September 30, 2006 and 2005 included in inventory in the accompanying consolidated balance sheets were approximately $1,061,000 and $0, respectively. The consolidated statements of operations for 2006 includes a decrease in income before income taxes of approximately $380,000 relating to adjustments recorded in 2006 which relate to revenue and direct costs that should have been deferred in the year ended September 30, 2005. This amount is not considered material to the Company’s 2005 or 2006 consolidated financial statements.
Concentrations of Credit Risk
Financial instruments that potentially subject the Company to significant concentrations of credit risk consist principally of cash and trade accounts receivable. The Company maintains substantially all of its cash with two financial institutions located in Georgia and Missouri. As of September 30, 2006 and 2005, substantially all of the Company’s cash was invested in checking accounts that bear minimal risk and were available upon demand. The Company has a cash balance of approximately $2,559,000, $2,567,000 as of September 30, 2006 and 2005, respectively.
Revenue is earned throughout the United States. The Company recognizes receivables for services provided to its customers and does not require collateral on the receivables. The Company reviews the allowance for doubtful accounts based upon the credit risk of specific customers, historical experience and other information. An allowance for doubtful accounts is established for accounts receivable estimated to be uncollectible and is adjusted periodically based upon management’s evaluation of current economic conditions, historical experience and other relevant factors that, in the opinion of management, deserve recognition in estimating such allowance. The Company writes off receivables which are past due and deemed to be uncollectible. The Company’s exposure to credit risk with respect to accounts receivable is limited due to broad dispersion of credit risk among its various customers.
Financial Instruments
The carrying amounts reported in the balance sheet for cash and cash equivalents, net accounts receivable, accounts payable, and accrued liabilities approximate fair value given their short-term maturities of the financial instruments.
The carrying amounts reported in the balance sheet for the line of credit approximate fair value given the financial instruments bear interest at variable market rates. The fair value of the Company’s long-term debt was approximately $90.0 million, $84.9 million, and $93.2 million as of September 30, 2006, 2005 and March 31, 2007, respectively.
Software and Software Development Costs
Software and software development costs include costs incurred by the Company to develop software for internal use in photocopy and release of information services.
Costs of software developed for internal use are accounted for in accordance with Statement of Position 98-1, Accounting for the Costs of Computer Software Developed or Obtained for Internal Use (SOP 98-1). In accordance with SOP 98-1, internal and external costs
F-63
Table of Contents
Smart Holdings Corp.
Notes to Consolidated Financial Statements—(Continued)
1. Summary of Significant Accounting Policies—Continued
incurred to develop internal-use computer software during the application development stage are capitalized. Application development stage costs generally include software configuration, coding, installation of hardware and testing. Costs of significant upgrades and enhancements that result in additional functionality are also capitalized. In accordance with SOP 98-1, as of September 30, 2006 and 2005, the Company has net capitalized software costs of approximately $1,441,000, and $3,435,000, respectively, related to internal use software projects. All other costs incurred in connection with an internal use software project are expensed as incurred. Costs incurred for maintenance and minor upgrades and enhancements are expensed as incurred. Capitalized software costs are amortized on a straight-line basis over the estimated useful lives of the related software applications of up to five years. Software development costs relating to the development of the internal use software amortized in the years ended September 30, 2006, 2005 and 2004, were approximately $717,000, $950,000 and $336,000, respectively.
Property and Equipment
Property and equipment are stated at cost less accumulated depreciation. Depreciation is calculated on the straight-line basis over the estimated useful lives of the assets, or lease term if shorter, which is generally three to seven years.
The carrying values of property and equipment and other long-lived assets are reviewed whenever events or changes in circumstances indicate that the carrying amount of an asset may not be recoverable. If this review indicates that the asset will not be recoverable, as determined based upon the undiscounted cash flows of the operating asset over the remaining amortization period, the carrying value of the asset will be reduced to its fair value.
Goodwill
Goodwill represents the excess of cost over the fair value of net tangible assets and identifiable intangible assets acquired and is not amortized in accordance with the provisions of Statement of Financial Accounting Standards (SFAS) No. 142, Goodwill and Other Intangible Assets. Under this statement, goodwill is subject to annual impairment tests. The Company analyzed its goodwill in the years ended September 30, 2006, 2005 and 2004, and no impairment was noted as a result of these analyses.
Long-Lived and Identifiable Intangible Assets
Identifiable intangible assets result from acquisitions accounted for under the purchase method. Identifiable intangible assets consist of customer base and covenants not to compete. These identifiable intangibles are amortized on a straight-line basis over four to eight years. The carrying values of these identifiable intangible assets and other long-lived assets are reviewed whenever events or changes in circumstances indicate that the carrying amount of an asset may not be recoverable. If this review indicates that the asset will not be recoverable, as determined based on the undiscounted cash flows of the operating entity or asset over the remaining amortization period, the carrying value of the asset will be reduced to its fair value.
Cash and Cash Equivalents
The Company considers all highly liquid, unrestricted investments with an original maturity of three months or less to be cash equivalents.
F-64
Table of Contents
Smart Holdings Corp.
Notes to Consolidated Financial Statements—(Continued)
1. Summary of Significant Accounting Policies—Continued
Inventory
Inventory represents the direct costs of medical records which have been scanned but have not been sent to the customer. Inventory is recorded at cost.
Deferred Revenue
Deferred revenue relates to charges for medical records which have been scanned but which have not been made available to the customer.
Income Taxes
Income taxes are accounted for under the asset and liability method. Deferred tax assets and liabilities are recognized for the future tax consequences attributable to differences between the financial statement carrying amounts of existing assets and liabilities and their respective tax basis. Deferred tax assets and liabilities are measured using enacted tax rates expected to apply to taxable income in the years in which those temporary differences are expected to be recovered or settled. Income tax expense is comprised of the tax payable for the period and the change in deferred income tax assets and liabilities during the period. A valuation allowance for deferred tax assets is recorded when it is more likely than not that the benefit from the deferred tax asset will not be realized.
Options
The Company has elected to follow Accounting Principles Board Opinion No. 25, Accounting for Stock Issued to Employees, (APB 25) and related Interpretations in accounting for employee stock options and adopted the disclosure-only provisions of Statement of Financial Accounting Standards No. 123, Accounting for Stock Based Compensation (SFAS No. 123) as amended by Statements of Financial Accounting Standards No. 148, Accounting for Stock-Based Compensation—Transitional Disclosure, an Amendment to SFAS No. 123, (SFAS No. 148) for option grants to employees. The Company generally grants stock options for a fixed number of shares to employees with an exercise price equal to or above the fair value of the shares at the date of grant and, accordingly, recognizes no compensation expense for the employee stock option grants.
The following table illustrates the effect on net income as if the Company had applied the fair value recognition provisions of SFAS No. 123 as amended by SFAS No. 148:
| For the Year Ended September 30 | ||||||||||||
| 2006 | 2005 | 2004 | ||||||||||
| Net loss, as reported |
$ | (7,325,053 | ) | $ | (5,813,979 | ) | $ | (7,111,527 | ) | |||
| Employee option compensation expense, net of related tax effect |
(350,583 | ) | (316,983 | ) | (122,099 | ) | ||||||
| $ | (7,675,636 | ) | $ | (6,130,962 | ) | $ | (7,233,626 | ) | ||||
F-65
Table of Contents
Smart Holdings Corp.
Notes to Consolidated Financial Statements—(Continued)
1. Summary of Significant Accounting Policies—Continued
Letter of Credit
As of September 30, 2006, 2005 and 2004 the Company has a total of approximately $1,051,000, $800,000 and $670,000 respectively, in letters of credit with a bank relating to its workers’ compensation insurance plan (previous provider requires continued security for existing claims).
Use of Estimates
The preparation of the financial statements in conformity with accounting principles generally accepted in the United States requires management to make estimates and assumptions that affect the amounts reported in the financial statements and accompanying notes. Actual results could differ from those estimates, and such differences may be material to the financial statements.
Recent Accounting Pronouncements
Share-Based Payment
On December 16, 2004, the FASB issued FASB Statement No. 123 (revised 2004), Share-Based Payment, (SFAS No. 123R) which is a revision of SFAS No. 123. SFAS No. 123R supersedes APB 25 and amends FASB Statement No. 3295, Statement of Cash Flows. Generally, the approach in SFAS No. 123R is similar to the approach described in SFAS No. 123. However, SFAS No. 123R requires all share-based payments to employees, including grants of employee stock options, to be recognized in the income statement based on their fair values. Pro forma disclosure is no longer an alternative. The Company must adopt SFAS No. 123R on October 1, 2006.
As permitted by SFAS No. 123, the Company currently accounts for share-based payments to employees using APB 25’s intrinsic value method and, as such, generally recognizes no compensation cost for employee stock options. Accordingly, the adoption of SFAS No.123R’s fair value method may have a significant impact on the Company’s results of operations and financial position. The impact of adoption of SFAS No. 123R cannot be predicted at this time because it will depend on levels of share-based payments granted in the future. However, had the Company adopted SFAS No. 123R in prior periods, the impact of that standard would have approximated the impact of SFAS 123 as described in the disclosure of pro forma net income in Notes 1 and 7 to the consolidated financial statements.
Fair Value Measurements
In September 2006, the Financial Accounting Standards Board (FASB) issued SFAS No. 157, Fair Value Measurements, (SFAS No. 157) which, among other things, established a framework for measuring fair value and required supplemental disclosures about fair value measurements. The changes resulting from the application of this new accounting pronouncement primarily relate to the definition of fair value and the methods used to measure fair value. SFAS No. 157.
SFAS No. 157 is effective on October 1, 2008, except for the provisions relating to non-financial assets and liabilities that are not required or permitted to be recognized or
F-66
Table of Contents
Smart Holdings Corp.
Notes to Consolidated Financial Statements—(Continued)
1. Summary of Significant Accounting Policies—Continued
disclosed at fair value on a recurring basis which is effective on October 1, 2009. Non-financial assets and liabilities include: (i) those items measured at fair value in goodwill impairment testing; (ii) tangible and intangible long-lived assets measured at fair value for impairment testing; and (iii) those items initially measured at fair value in a business combination. The adoption of SFAS No. 157 is not expected to have a material impact on the Company’s consolidated results of operations, cash flows or financial position.
In February 2007, the Financial Accounting Standards Board (FASB) issued SFAS No. 159, The Fair Value Option for Financial Assets and Financial Liabilities—Including an amendment of FASB Statement No. 115 (“SFAS 159”), which is effective for fiscal years beginning after November 15, 2007. This statement permits entities to choose to measure many financial instruments and certain other items at fair value. This statement also establishes presentation and disclosure requirements designed to facilitate comparisons between entities that choose different measurement attributes for similar types of assets and liabilities. Unrealized gains and losses on items for which the fair value option is elected would be reported in earnings. The adoption of SFAS No. 159 is not expected to have a material impact on the Company’s consolidated results of operations, cash flows or financial position.
Purchase Method of Accounting for Acquisitions
In December 2007, the FASB issued SFAS No. 141(R), Business Combinations (“SFAS No. 141(R)”). SFAS No. 141(R) retains the purchase method of accounting for acquisitions, but requires a number of changes, including changes in the way assets and liabilities are recognized in the purchase accounting as well as requiring the expensing of acquisition-related costs as incurred. Additionally, SFAS No. 141(R) provides guidance for recognizing and measuring the goodwill acquired in the business combination and determines what information to disclose to enable users of the financial statements to evaluate the nature and financial effects of the business combination. Furthermore, this standard requires any adjustments to acquired deferred tax assets and liabilities occurring after the related allocation period to be made through earnings for both acquisitions occurring prior and subsequent to the effective date of this standard. SFAS No. 141(R) is effective for financial statements for interim or annual periods ending on or after September 15, 2009 for the Company. Earlier adoption is prohibited. The adoption of SFAS No. 141(R), prospectively, may have a material effect on the Company’s results of operations and financial position, to the extent that the Company has material acquisitions, as costs that have historically been capitalized as part of the purchase price will now be expensed, such as accounting, legal and other professional fees.
Noncontrolling Interests in Consolidated Financial Statements
In December 2007, the FASB issued SFAS No. 160, Noncontrolling Interests in Consolidated Financial Statements—An Amendment of ARB No. 51 (“SFAS No. 160”). SFAS No. 160 amends Accounting Research Bulletin No. 51, Consolidated Financial Statements, (ARB No. 51), to establish accounting and reporting standards for the noncontrolling interest in a subsidiary and for the deconsolidation of a subsidiary. SFAS No. 160 clarifies that a noncontrolling interest in a subsidiary is an ownership interest in the consolidated entity that should be reported as equity in the consolidated financial statements. Additionally, SFAS No. 160 changes the way the consolidated income statement is presented by requiring consolidated net income to be reported at amounts that include the amounts attributable to both the parent and the
F-67
Table of Contents
Smart Holdings Corp.
Notes to Consolidated Financial Statements—(Continued)
1. Summary of Significant Accounting Policies—Continued
noncontrolling interest. SFAS No. 160 requires expanded disclosures in the consolidated financial statements that clearly identify and distinguish between the interests of the parent’s owners and the interests of the noncontrolling owners of a subsidiary, including a reconciliation of the beginning and ending balances of the equity attributable to the parent and the noncontrolling owners and a schedule showing the effects of changes in a parent’s ownership interest in a subsidiary on the equity attributable to the parent. SFAS No. 160 does not change ARB No. 51’s provisions related to consolidation purposes or consolidation policy, or the requirement that a parent consolidate all entities in which it has a controlling financial interest. SFAS No. 160 does, however, amend certain of ARB No. 51’s consolidation procedures to make them consistent with the requirements of SFAS No. 141(R) as well as to provide definitions for certain terms and to clarify some terminology. SFAS No. 160 is effective for financial statements for interim or annual periods ending on or after September 15, 2009. Earlier adoption is prohibited. SFAS No. 160 must be applied prospectively as of the beginning of the fiscal year in which it is initially applied, except for the presentation and disclosure requirements, which must be applied retrospectively for all periods presented. The adoption of SFAS No. 160 is not expected to have a material impact on the Company’s consolidated results of operations, cash flows or financial position.
Accounting for Uncertainty in Income Taxes
In June 2006, the FASB issued Interpretation No. 48, Accounting for Uncertainty in Income Taxes—an interpretation of FASB Statement No. 109 (FIN 48). FIN 48 clarifies the accounting for uncertainty in income taxes by prescribing a recognition threshold and measurement attribute for the financial statement implications of tax positions taken or expected to be taken in a company’s tax return. The interpretation also provides guidance on derecognition, classification, interest and penalties, accounting in interim periods, and disclosure of such positions. Pursuant to the proposed FASB Staff Position (FSB) FIN 48-3, Effective Date of FASB Interpretation No. 48 for Certain Nonpublic Enterprises, nonpublic companies are required to adopt the provisions of FIN 48 for years beginning after December 15, 2008. Therefore, the Company will adopt the provisions of FIN 48 effective January 1, 2009. Upon adoption, the cumulative effect of this change in accounting principle will be accounted for as an adjustment to retained earnings. The Company is currently evaluating the impact of the adoption of FIN 48 on its consolidated results of operations, cash flows or financial position.
Determination of Useful Life of Intangible Assets
In April 2008, the Financial Accounting Standards Board (“FASB”) issued FASB Staff Position (“FSP”) SFAS 142-3, Determination of the Useful Life of Intangible Assets (“FSP 142-3”). This guidance is intended to improve the consistency between the useful life of a recognized intangible asset under Statement of Financial Accounting Standards (“SFAS”) No. 142, Goodwill and Other Intangible Assets (“SFAS 142”), and the period of expected cash flows used to measure the fair value of the asset under SFAS 141R (Revised 2007) “Business Combinations” (“SFAS 141R”) when the underlying arrangement includes renewal or extension of terms that would require substantial costs or result in a material modification to the asset upon renewal or extension. Companies estimating the useful life of a recognized intangible asset must now consider their historical experience in renewing or extending similar arrangements or, in the absence of historical experience, must consider assumptions that
F-68
Table of Contents
Smart Holdings Corp.
Notes to Consolidated Financial Statements—(Continued)
1. Summary of Significant Accounting Policies—Continued
market participants would use about renewal or extension as adjusted for SFAS 142’s entity- specific factors. FSP 142-3 is effective January 1, 2009. The adoption of FSP FAS 142-is not expected to have a material impact on the Company’s consolidated results of operations, cash flows or financial position.
Fair Value Measurements
In April 2009, the FASB issued FSP FAS 157-4, Determining Fair Value When the Volume and Level of Activity for the Asset or Liability Have Significantly Decreased and Identifying Transactions That Are Not Orderly (“FSP FAS 157-4”). This FSP provides additional guidance for estimating fair value in accordance with FASB Statement No. 157, Fair Value Measurements, when the volume and level of activity for the asset or liability have significantly decreased. This FSP also includes guidance on identifying circumstances that indicate a transaction is not orderly. This FSP emphasizes that even if there has been a significant decrease in the volume and level of activity for the asset or liability and regardless of the valuation technique(s) used, the objective of a fair value measurement remains the same. Fair value is the price that would be received to sell an asset or paid to transfer a liability in an orderly transaction (that is, not a forced liquidation or distressed sale) between market participants at the measurement date under current market conditions. FSP FAS 157-4 is effective for interim and annual reporting periods ending after June 15, 2009, and is applied prospectively. The adoption of this standard is not expected to have a material impact on the Company’s consolidated results of operations, cash flows or financial position.
Subsequent Events
In May 2009, the FASB issued SFAS 165, “Subsequent Events”, to establish general standards of accounting for and disclosure of events that occur after the balance sheet date but before financial statements are issued. This pronouncement is effective in interim or annual periods ending after June 15, 2009. The adoption of this standard is not expected to have a material effect on the Company’s consolidated results of operations, cash flows or financial position.
Codification and Hierarchy of Generally Accepted Accounting Principles
In June 2009, the FASB issued SFAS No. 168, “The FASB Accounting Standards Codification and the Hierarchy of Generally Accepted Accounting Principles,” (SFAS 168). SFAS 168 establishes the FASB Accounting Standards Codification (the Codification) as the single source of authoritative, nongovernmental U.S. GAAP. The Codification does not change U.S. GAAP. All existing accounting standard documents will be superseded and all other accounting literature not included in the Codification will be considered nonauthoritative. SFAS 168 is effective for interim and annual periods ending after September 15, 2009. The Company does not expect the adoption of this standard to have a material effect on the consolidated results of operations, cash flows or financial position.
Reclassifications
Certain amounts in the prior year financial statements have been reclassified to conform to the current year presentation.
F-69
Table of Contents
Smart Holdings Corp.
Notes to Consolidated Financial Statements—(Continued)
2. Acquisition
In August 2005, pursuant to a stock purchase agreement, the Company purchased 100% of the outstanding stock of Micro Innovations, Inc., a document management solutions corporation located in Missouri, for $10,000,000 plus approximately $400,000 in acquisition costs. The purchase price was determined based upon the expected annual cash flow to be generated by Micro. The Company purchased Micro to expand its release of information market and to enter into the document retention market. The results of operations of the acquired entity are included in the Company’s consolidated financial statements since the date of acquisition. The Company recorded an addition to goodwill of approximately $3,076,000 related to the acquisition.
The following table summarizes the estimated fair value of Micro’s assets acquired and liabilities at the date of the acquisition. The total purchase price of the acquisition has been allocated based on management’s estimate of their fair values.
| At August 18, 2005 |
||||
| Current assets |
$ | 2,410,870 | ||
| Property and equipment |
4,074,861 | |||
| Deferred tax asset |
566,005 | |||
| Goodwill (not deductible for income tax purposes) |
3,075,673 | |||
| Customer lists |
3,780,000 | |||
| Total assets acquired |
13,907,409 | |||
| Current liabilities |
(889,293 | ) | ||
| Deferred tax liability |
(2,618,116 | ) | ||
| Total liabilities assumed |
(3,507,409 | ) | ||
| Net assets acquired |
$ | 10,400,000 | ||
3. Property and Equipment
Property and equipment consists of the following:
| September 30 | ||||||||
| 2006 | 2005 | |||||||
| Data processing equipment |
$ | 11,412,653 | $ | 9,939,381 | ||||
| Software |
11,855,814 | 11,855,814 | ||||||
| Vehicles |
45,238 | 114,198 | ||||||
| Office furniture and equipment |
1,179,058 | 918,945 | ||||||
| Leasehold improvements |
1,798,317 | 1,287,809 | ||||||
| 26,291,080 | 24,116,147 | |||||||
| Accumulated depreciation and amortization |
(18,284,041 | ) | (13,336,968 | ) | ||||
| $ | 8,007,039 | $ | 10,779,179 | |||||
F-70
Table of Contents
Smart Holdings Corp.
Notes to Consolidated Financial Statements—(Continued)
4. Identifiable Intangible Assets
Identifiable intangible assets consist of the following:
| September 30 | ||||||||
| 2006 | 2005 | |||||||
| Customer base |
$ | 4,959,185 | $ | 13,725,000 | ||||
| Covenants not Covenant not to compete |
979,332 | 979,332 | ||||||
| 5,938,517 | 14,704,332 | |||||||
| Accumulated depreciation and amortization |
(1,409,139 | ) | (8,799,684 | ) | ||||
| $ | 4,529,378 | $ | 5,904,648 | |||||
The estimated aggregate amortization is summarized for the years ended September 30:
| 2007 |
$ | 973,275 | |
| 2008 |
877,905 | ||
| 2009 |
767,296 | ||
| 2010 |
602,464 | ||
| 2011 |
472,500 | ||
| Thereafter |
835,938 | ||
| Total |
$ | 4,529,378 | |
Amortization expense of identifiable intangible assets for the years ended September 30, 2006, 2005 and 2004, was approximately $2,657,000 $2,701,000 and $2,646,000, respectively. In the year ended September 30, 2006, a customer base asset with a gross value of $9,945,000 became fully amortized.
5. Long-Term Obligations
Long-term obligations are comprised of the following:
| September 30 | ||||||||
| 2006 | 2005 | |||||||
| Promissory notes with related parties |
$ | 83,903,764 | $ | 74,317,346 | ||||
| Lease agreement with bank |
6,000,000 | 10,800,000 | ||||||
| Less unamortized financing costs |
(140,906 | ) | (229,128 | ) | ||||
| 89,762,858 | 84,888,218 | |||||||
| Less current maturities |
(88,703,764 | ) | (4,800,000 | ) | ||||
| Total long-term obligations, less current maturities |
$ | 1,059,094 | $ | 80,088,218 | ||||
On June 13, 2002, the Company entered into promissory notes with the Company’s primary investors totaling approximately $50,023,000 with a maturity date of June 13, 2007. The promissory notes bear interest at 12% per annum. Interest is due semi-annually on each September 30 and March 31 either in cash or at the option of the Company, in the form of additional notes (“PIK Notes”) with terms identical to those of the original promissory notes
F-71
Table of Contents
Smart Holdings Corp.
Notes to Consolidated Financial Statements—(Continued)
5. Long-Term Obligations—Continued
including the maturity date. The promissory notes may be prepaid in whole or in part, at any time, without penalty. To date the Company has elected to convert all semi-annual interest payments into additional promissory notes.
In connection with the promissory note during 2002, the Company sold $30,000,000 of property and equipment to an affiliate of a bank under a Registered Lease and License Financing and Purchase Option Agreement (the Lease Agreement). SDS did not recognize a gain on the transaction. Concurrent with the sale to the affiliate, the Company leased back all of the property and equipment included in the sale to the affiliate under a capital lease arrangement that expired on June 13, 2005. The Lease Agreement was structured as an Ijara Participation and Lease Agreement and contains a stated provision intended to be consistent with the Islamic Shari’ah rules. Under accounting principles generally accepted in the United States, the Lease Agreement qualifies as a capital lease and thus has been characterized as a long-term obligation on the balance sheet.
On February 18, 2005, the Company amended the Lease Agreement to provide for, among other things, revisions to repayment terms and certain definitions of the financial covenants. The Lease Agreement is due December 31, 2007. Principal and interest are payable quarterly. The interest rate on the Lease Agreement is based upon LIBOR plus an applicable margin and was 7.37% at September 30, 2006.
The Company incurred financing costs of approximately $292,000 in connection with refinancing the Lease Agreement in 2005.
The Lease Agreement contains certain affirmative and negative covenants customary for this type of facility and is collateralized by virtually all assets of the Company and its subsidiary. The Company is also required to comply with various financial covenants including maintaining certain levels of leverage, fixed charge coverage and net worth ratios.
As of September 30, 2006, the Company is in compliance with all of the covenants of the Lease Agreement.
The following summarizes the aggregate maturities of debt at September 30, 2006:
| Year ended September 30, |
|||
| 2007 |
$ | 88,703,764 | |
| 2008 |
1,200,000 | ||
| $ | 89,903,764 | ||
In 2005, the Company entered into a $10,000,000 line of credit with a bank. As of September 30, 2006 and 2005, $2,500,000 and $5,000,000, respectively, was borrowed and outstanding on the line of credit. The line of credit terminates on December 31, 2007.
F-72
Table of Contents
Smart Holdings Corp.
Notes to Consolidated Financial Statements—(Continued)
6. Option Plan
During the year ended September 30, 2003, SDS adopted an option plan authorizing the granting of options to acquire units of SDS. The number of these nonqualified stock options granted and their terms are determined by the Board of Directors.
The following describes the option activity during the years ended September 30, 2006, 2005, and 2004:
| Units | Weighted Average Exercise Price | |||||
| Outstanding at September 30, 2003 |
415,790 | $ | 7.36 | |||
| Granted |
488,596 | 7.27 | ||||
| Forfeited |
(123,687 | ) | 7.36 | |||
| Outstanding at September 30, 2004 |
780,699 | 7.30 | ||||
| Granted |
28,947 | 7.27 | ||||
| Outstanding at September 30, 2005 |
809,646 | 7.30 | ||||
| Granted |
200,000 | 7.60 | ||||
| Outstanding at September 30, 2006 |
1,009,646 | 7.36 | ||||
The weighted average fair value per unit of options granted was $0.84, $2.12 and $7.27 in 2006, 2005 and 2004, respectively. At September 30, 2006, 2005 and 2004, no options were exercisable. As of September 30, 2006, 2005, and 2004, the weighted average exercise price of the outstanding options is $7.36, $7.30, and $7.30, respectively with exercise prices ranging from $7.27 to $7.60. The weighted average remaining contractual life at September 30, 2006, 2005, and 2004 is 5.96 years, 7.96 years, and 8.96 years, respectively. During the years ended September 30, 2006, 2005 and 2004 SDS granted 200,000, 28,947 and 488,596 options, respectively, with exercise prices of $7.60, $7.27 and $7.27 at September 30, 2006, 2005 and 2004, respectively.
At September 30, 2006, 2005, and 2004, 420,349, 214,560, and 58,421 options were vested, respectively. The options vest over a period of five years. An aggregate of 1,060,010 units of the Company has been reserved for issuance in connection with the Company’s option plan.
The Company has elected to follow APB 25 and related interpretations in accounting for its employee stock options because, as discussed below, the alternative fair value accounting provided for under SFAS No. 123 requires use of option valuation models that were not developed for use in valuing employee stock options. Under APB 25, because the exercise price of the Company’s employee stock options equals or exceeds the market price of the underlying stock on the date of grant, no compensation expense is recognized.
Pro forma information regarding net income is required by SFAS No. 123, and has been determined as if the Company had accounted for its employee stock options under the fair value method of the Statement. The fair value for these options was estimated at the date of grant using the minimum value option pricing model with the following weighted-average assumptions: risk-free interest rates ranging from 3.6% to 4.4%; dividend yields of 0%, and an expected life of the options of nine years.
F-73
Table of Contents
Smart Holdings Corp.
Notes to Consolidated Financial Statements—(Continued)
6. Option Plan—Continued
The minimum value option valuation model was developed for use in estimating the fair value of traded options which have no vesting restrictions and are fully transferable. In addition, option valuation models require the input of highly subjective assumptions. Because the Company’s employee stock options have characteristics significantly different from those of traded options, and because changes in the subjective input assumptions can materially affect the fair value estimate, in management’s opinion, the existing models do not necessarily provide a reliable single measure of the fair value of its employee stock options. For purposes of pro forma disclosures, the estimated fair value of the options is amortized to expense over the options’ vesting period. The effect of applying the fair value method to the Company’s stock based awards results in a decrease of the 2006, 2005 and 2004 net income of approximately $351,000, $317,000 and $122,000, respectively.
7. Deferred Compensation and Savings Plans
In January 2003, the Company adopted a deferred compensation plan (“Non-Qualified Plan”) for certain key employees which provides for amounts to be paid upon termination of employment or upon change in ownership of the Company. The Company does not make any contributions to this plan. Voluntary compensation deferrals are held in a “Rabbi Trust” as that term is defined in Revenue Procedure 92-64, 1992-2 C.B 422. Distributions of Plan contributions and earnings will be made upon termination of employment, disability, retirement or the financial hardship of the participant. The Non-Qualified Plan’s assets as of September 30, 2006, 2005 and 2004 were approximately $804,000, $305,000 and $274,000, respectively. The Non-Qualified Plan’s liabilities were approximately $804,000, $305,000 and $274,000 as of September 30, 2006, 2005 and 2004 is held in a rabbi trust.
The Company has a 401(k) Savings Plan and a 529 Savings Plan (collectively, the Plans). The Plans cover all eligible employees, and employee contributions to the Plans are made at predetermined rates elected by the employee. The Company did not incur any expense relating to the Plans in the years ended September 30, 2006, 2005 and 2004.
8. Income Taxes
The Company accounts for income taxes in accordance with SFAS 109, Accounting for Income Taxes. Accordingly, the Company’s provision for income taxes is determined using the asset and liability method. Under this method, deferred income tax assets and liabilities are calculated based upon the temporary differences between the financial statement and income tax bases of assets and liabilities using the combined federal and state effective tax rates that are applicable to the Company in a given year. The effect of a change in income tax rates on deferred income tax assets and liabilities is recognized as a component of income tax expense in the period which includes the enactment date.
The deferred income tax assets are recorded net of a valuation allowance when, based on the weight of available evidence, the Company believes it is more likely than not that some portion or all of the recorded deferred tax assets will not be realized in future periods. In making such determination, the Company considers all available positive and negative evidence, including scheduled reversals of deferred income tax liabilities, projected future taxable income, tax planning strategies and recent financial operations. In the event the Company was to
F-74
Table of Contents
Smart Holdings Corp.
Notes to Consolidated Financial Statements—(Continued)
8. Income Taxes—Continued
determine that the Company would be able to realize the deferred income tax assets in the future in excess of their respective net recorded amounts, the Company would make an adjustment to the valuation allowance which would reduce the provision for income taxes in the period of determination. At September 30, 2006, 2005, and 2004, the Company has recorded a full valuation allowance against the net deferred income tax asset exclusive of a deferred income tax liability related indefinite lived intangible assets, as the Company believes that it is not more likely than not that it will ultimately realize the net deferred income tax asset recorded at September 30, 2006, 2005, and 2004 (in thousands).
The components of loss before income taxes were:
| Years Ended September 30 | ||||||||||||
| 2006 | 2005 | 2004 | ||||||||||
| U.S. |
$ | (5,714 | ) | $ | (4,077 | ) | $ | (5,649 | ) | |||
| Non-U.S. |
— | — | ||||||||||
| $ | (5,714 | ) | $ | (4,077 | ) | $ | (5,649 | ) | ||||
Income tax expense (benefit) consisted of the following:
| Years ended September 30 | |||||||||
| 2006 | 2005 | 2004 | |||||||
| Current tax expense |
|||||||||
| U.S. federal |
$ | — | $ | — | $ | — | |||
| U.S. state |
10 | 7 | 7 | ||||||
| 10 | 7 | 7 | |||||||
| Deferred tax expense |
|||||||||
| U.S. federal |
1,136 | 1,136 | 1,136 | ||||||
| U.S. state |
20 | 163 | 108 | ||||||
| 1,156 | 1,299 | 1,244 | |||||||
| Total income tax expense |
$ | 1,166 | $ | 1,306 | $ | 1,251 | |||
The following is a reconciliation of the U.S. federal statutory tax rate of 34% to our recorded income tax expense (benefit) (in thousands):
| September 30 | |||||||||||||||||||||
| 2006 | 2005 | 2004 | |||||||||||||||||||
| U.S. federal statutory tax |
$ | (1,943 | ) | 34.0 | % | $ | (1,386 | ) | 34.0 | % | $ | (1,920 | ) | 34.0 | % | ||||||
| State income taxes, net of federal benefit |
(211 | ) | 3.7 | (168 | ) | 4.1 | (179 | ) | 3.2 | ||||||||||||
| Minority interest |
24 | (0.4 | ) | 16 | (0.4 | ) | 12 | (0.2 | ) | ||||||||||||
| Other permanent adjustments |
(643 | ) | 11.2 | (171 | ) | 4.2 | (72 | ) | 1.3 | ||||||||||||
| Change in valuation allowance |
3,939 | (68.9 | ) | 3,015 | (74.0 | ) | 3,410 | (60.4 | ) | ||||||||||||
| Income tax expense (benefit) |
$ | 1,166 | (20.4 | )% | $ | 1,306 | (32.1 | )% | $ | 1,251 | (22.1 | )% | |||||||||
F-75
Table of Contents
Smart Holdings Corp.
Notes to Consolidated Financial Statements—(Continued)
8. Income Taxes—Continued
Significant components of our deferred income tax assets, net of deferred income tax liabilities and valuation allowance, at September 30 were as follows:
| in thousands | ||||||||
| September 30 | ||||||||
| 2006 | 2005 | |||||||
| Deferred tax liabilities: |
||||||||
| Identifiable intangible assets |
$ | (1,239 | ) | $ | (1,418 | ) | ||
| Property and equipment |
(137 | ) | (253 | ) | ||||
| Investment in partnership |
(124 | ) | — | |||||
| Software costs |
(591 | ) | (743 | ) | ||||
| Total deferred tax liabilities |
(2,091 | ) | (2,414 | ) | ||||
| Deferred tax assets: |
||||||||
| Net operating loss carryforwards |
7,996 | 5,496 | ||||||
| Federal general business tax credit |
104 | 104 | ||||||
| Investment in partnership |
— | 326 | ||||||
| Other |
61 | 37 | ||||||
| Valuation allowance |
(11,366 | ) | (7,689 | ) | ||||
| Total deferred tax assets |
(3,205 | ) | (1,726 | ) | ||||
| Net deferred tax assets |
$ | (5,296 | ) | $ | (4,140 | ) | ||
At September 30, 2006, 2005, and 2004, Smart Holdings Corp. and subsidiaries had federal net operating loss carryforwards of approximately $21.4 million, $14.7 million, and $9.7 million, respectively, subject to annual utilization limitations pursuant to IRC section 382. If not utilized, the federal net operating loss carryforwards will expire between 2022 and 2026. At September, 30, 2006, 2005, and 2004, the Company and subsidiaries had approximately $104,000, $104,000 and $0, respectively of federal general business tax credits which will expire between 2022 and 2024 if not utilized. At September 30, 2006, 2005, and 2004, the Company and subsidiaries have state net operating loss carryforwards of approximately $22.4 million, $15.7 million, and $9.7 million, respectively, which have various dates of expiration.
Net deferred tax assets at September 30 were as follows:
| in thousands | ||||||||
| Year Ended September 30 |
||||||||
| 2006 | 2005 | |||||||
| Deferred tax assets |
$ | 8,161 | $ | 5,963 | ||||
| Deferred tax liabilities |
(2,091 | ) | (2,414 | ) | ||||
| Valuation allowance |
(11,366 | ) | (7,689 | ) | ||||
| Net deferred tax assets |
$ | (5,296 | ) | $ | (4,140 | ) | ||
In July 2006, the FASB issued FIN 48, Accounting for Uncertainty in Income Taxes, which provides clarification of SFAS 109 with respect to the recognition of income tax benefits of uncertain income tax positions in the financial statements. FIN 48 requires uncertain income tax positions to be reviewed and assessed with recognition and measurement of the income tax benefit related to such uncertain income tax position on a “more likely than not” standard.
F-76
Table of Contents
Smart Holdings Corp.
Notes to Consolidated Financial Statements—(Continued)
8. Income Taxes—Continued
Income tax benefits of uncertain income tax positions taken on income tax returns which do not qualify for financial statement recognition are required to be disclosed in the financial statements.
Pursuant to FASB Staff Position FIN 48-3, Effective Date of FASB Interpretation No. 48 for Certain Nonpublic Enterprises, non-public companies are required to adopt the provisions of FIN 48 for years beginning after December 15, 2008. Therefore, the Company will adopt the provisions of FIN 48 in 2009. Upon adoption, the cumulative effect of this change in accounting principle will be accounted for as an adjustment to retained earnings. The Company continues to evaluate the potential impact of this standard on its financial statements, though the potential impact caused by the adoption of FIN 48 effective January 1, 2009 is not expected to be material to the Company’s financial statements as a whole. For the years ended September 30, 2006,
2005, and 2004, the Company has evaluated uncertain tax positions in accordance with SFAS 5, Accounting for Contingencies.
9. Lease Commitments
The Company leases regional office facilities, photocopiers, computers and other office equipment under the terms of various operating leases with non-related parties. For the years ended September 30, 2006, 2005 and 2004, rent expense under these lease agreements approximated $2,388,000, $2,057,000 and $2,213,000, respectively.
Effective August 19, 2005, Micro entered into a five-year lease agreement with the former owner of the company for the headquarter offices located in Nixa, Missouri. Rent expense under this lease for the years ended September 30, 2006 and 2005, approximated $420,000 and $49,800, respectively.
Aggregate minimum lease payments on operating leases with non-related parties with original or remaining terms in excess of one year are as follows:
| Year ended September 30, |
|||
| 2007 |
$ | 1,320,710 | |
| 2008 |
860,489 | ||
| 2009 |
473,589 | ||
| 2010 |
434,559 | ||
| Total |
$ | 3,089,347 | |
Effective June 13, 2002, the Company entered into a five-year lease agreement with one of the Company’s members for the Company’s corporate headquarters. The lease contains a five-year renewal option at the end of the original lease term. Rent expense under this lease for the years ended September 30, 2006, 2005 and 2004, approximated $390,000, $377,000 and $360,000, respectively. The Company continued to lease another one of its regional offices from the member under a lease agreement with a two-year lease term. Rent expense under this lease approximated $16,600 for the years ended September 30, 2006, 2005, and 2004, respectively.
F-77
Table of Contents
Smart Holdings Corp.
Notes to Consolidated Financial Statements—(Continued)
9. Lease Commitments—Continued
Aggregate minimum lease payments on operating leases with related parties with original or remaining terms in excess of one year are as follows:
| Year ended September 30, |
|||
| 2007 |
$ | 388,335 | |
| 2008 |
417,649 | ||
| 2009 |
426,090 | ||
| 2010 |
434,701 | ||
| 2011 |
443,487 | ||
| 2012 |
305,065 | ||
| Total |
$ | 2,415,327 | |
10. Litigation
The Company is a party to various legal proceedings in the normal course of business. The ultimate resolution of many of these actions has not been determined. For certain of these legal proceedings, the Company may negotiate settlements to end the proceedings and minimize costs.
11. Subsequent Events
In June 2007, 100% of the Company’s outstanding stock was acquired by HealthPort, Inc. for a purchase price of approximately $195,402,000. In connection with the acquisition, all of the Company’s outstanding promissory notes were paid in full.
F-78
Table of Contents
Consolidated Balance Sheet
(In thousands)
| March 31, 2007 | |||
| (unaudited) | |||
| Assets |
|||
| Current assets: |
|||
| Cash and cash equivalents |
$ | 2,015 | |
| Trade accounts receivable, net of allowances of approximately $9,830 at March 31, 2007 |
14,702 | ||
| Other accounts receivable |
132 | ||
| Inventory |
1,098 | ||
| Due from minority interest member |
21 | ||
| Prepaid expenses and other current assets |
2,626 | ||
| Total current assets |
20,594 | ||
| Property and equipment, net |
6,411 | ||
| Goodwill |
51,119 | ||
| Customer base, net of amortization of $11,025 at March 31, 2007 |
3,879 | ||
| Covenants not to compete, net of amortization of $791 at March 31, 2007 |
189 | ||
| Other assets |
898 | ||
| Total Assets |
$ | 83,090 | |
See accompanying notes.
F-79
Table of Contents
Smart Holdings Corp.
Consolidated Balance Sheet
(In thousands)
| March 31, 2007 |
||||
| (unaudited) | ||||
| Liabilities and Stockholders’ Deficit |
||||
| Current liabilities: |
||||
| Long-term obligations, current portion |
$ | 3,600 | ||
| Promissory notes with related parties, current portion |
88,564 | |||
| Accounts payable |
1,488 | |||
| Accrued salaries and bonuses |
2,838 | |||
| Deferred revenue |
1,849 | |||
| Income tax payable |
14 | |||
| Other accrued expenses |
1,401 | |||
| Total current liabilities |
99,754 | |||
| Long-term obligations, net of current portion |
837 | |||
| Deferred tax liability |
5,913 | |||
| Minority interest |
1,793 | |||
| Stockholders’ deficit: |
||||
| 1,700,000 shares of capital stock authorized and 1,667,429 issued and outstanding at March 31, 2007, respectively |
16 | |||
| Accumulated deficit |
(25,223 | ) | ||
| Total stockholders’ deficit |
(25,207 | ) | ||
| Total liabilities and stockholders’ deficit |
$ | 83,090 | ||
See accompanying notes.
F-80
Table of Contents
Consolidated Statements of Operations
(In thousands)
| Six months ended March 31, |
||||||||
| 2007 | 2006 | |||||||
| (unaudited) | ||||||||
| Revenue |
$ | 60,572 | $ | 54,463 | ||||
| Cost of services: |
||||||||
| Salaries and benefits |
27,206 | 24,044 | ||||||
| Rent expense |
946 | 1,208 | ||||||
| Retrieval fees |
894 | 792 | ||||||
| Supplies and postage |
5,077 | 4,595 | ||||||
| Bad debts expense |
3,848 | 4,127 | ||||||
| Depreciation and amortization expense |
2,848 | 4,026 | ||||||
| Other |
3,811 | 3,213 | ||||||
| Total costs of services |
44,630 | 42,005 | ||||||
| Gross profit |
15,942 | 12,458 | ||||||
| Selling expenses |
3,486 | 3,309 | ||||||
| General and administrative expenses |
8,335 | 7,876 | ||||||
| Financing costs |
4,996 | 5,355 | ||||||
| Other non-operating expenses (income) |
(46 | ) | (31 | ) | ||||
| Loss before provision for income taxes |
(829 | ) | (4,051 | ) | ||||
| Provision for income taxes |
617 | 578 | ||||||
| Net loss before minority interest in subsidiary |
(1,446 | ) | (4,629 | ) | ||||
| Minority interest |
379 | 76 | ||||||
| Net loss |
$ | (1,825 | ) | $ | (4,705 | ) | ||
See accompanying notes.
F-81
Table of Contents
Consolidated Statements of Cash Flows
(In thousands)
| Six months ended March 31, |
||||||||
| 2007 | 2006 | |||||||
| (unaudited) | ||||||||
| Operating activities |
||||||||
| Net loss |
$ | (1,825 | ) | $ | (4,705 | ) | ||
| Adjustments to reconcile net loss to net cash provided by operating activities: |
||||||||
| Depreciation and amortization |
2,848 | 4,026 | ||||||
| Non cash interest expense |
5,034 | 4,793 | ||||||
| Amortization of deferred financing costs |
58 | 27 | ||||||
| Provision for doubtful accounts |
3,848 | 4,127 | ||||||
| Minority interest |
379 | 76 | ||||||
| Deferred taxes |
617 | 594 | ||||||
| Changes in operating assets and liabilities: |
||||||||
| Trade accounts receivable |
(3,718 | ) | (4,531 | ) | ||||
| Other accounts receivable |
289 | 87 | ||||||
| Inventory |
(36 | ) | — | |||||
| Prepaid expenses and other current assets |
(1,075 | ) | (1,142 | ) | ||||
| Accounts payable |
(1,297 | ) | (1,404 | ) | ||||
| Accrued salaries and bonuses |
(133 | ) | (247 | ) | ||||
| Deferred revenue |
62 | 893 | ||||||
| Other accrued expenses |
(508 | ) | (163 | ) | ||||
| Net cash provided by operating activities |
4,543 | 2,431 | ||||||
| Investing activities |
||||||||
| Purchases of equipment |
(791 | ) | (915 | ) | ||||
| Net cash used in investing activities |
(791 | ) | (915 | ) | ||||
| Financing activities |
||||||||
| Payments of long-term obligations |
(4,296 | ) | (7,200 | ) | ||||
| Borrowings |
— | 6,800 | ||||||
| Net cash used in financing activities |
(4,296 | ) | (400 | ) | ||||
| Net change in cash and cash equivalents |
(544 | ) | 1,116 | |||||
| Cash and cash equivalents, beginning of year |
2,559 | 2,567 | ||||||
| Cash and cash equivalents, end of period |
$ | 2,015 | $ | 3,683 | ||||
See accompanying notes.
F-82
Table of Contents
Notes to Consolidated Financial Statements (unaudited)
1. Summary of Significant Accounting Policies
Organization and Business
Smart Holdings Corp. (Smart Holdings or the Company) was incorporated on May 28, 2002 under the laws of the state of Delaware for the purpose of acquiring JAS Imaging. On June 13, 2002 Smart Holdings completed its acquisition of 90% of JAS Imaging, LLC. Concurrent with the acquisition, JAS Imaging’s name was changed to Smart Document Solutions, LLC (SDS). As a result of the acquisition, SDS became a 90% owned subsidiary of Smart Holdings. Smart Holdings’ principal operations are conducted through its majority owned subsidiary SDS.
SDS’s principal business activity is to provide outsourcing of photocopy and release of information services of medical records for hospitals, attorneys, insurance companies and other users of such records throughout the United States. The Company’s administrative facilities are located in Alpharetta, Georgia and the Company maintains regional offices in various states. In August 2005, the Company purchased 100% of the outstanding stock of Micro Innovations, Inc. (Micro).
Basis of Presentation
The consolidated financial statements include the accounts of the Company and its wholly owned and majority owned subsidiaries. All significant intercompany accounts have been eliminated in consolidation.
Unaudited Interim Financial Information
The accompanying interim consolidated balance sheets as of March 31, 2007, the consolidated statements of operations for the six months ended March 31, 2007 and 2006 and the consolidated statements of cash flows for the six months ended March 31, 2008 and 2007 are unaudited. These unaudited interim consolidated financial statements have been prepared in accordance with U.S. generally accepted accounting principles. In the opinion of the Company’s management, the unaudited interim consolidated financial statements have been prepared on the same basis as the audited consolidated financial statements and include all adjustments necessary for the fair presentation of the Company’s statement of financial position at March 31, 2007 and March 31, 2006, and its results of operations and its cash flows for the six months ended March 31, 2007 and 2006. The results of operations for the six months ended March 31, 2007 and 2006 are not necessarily indicative of the results for the year ending September 2007.
2. Financial Instruments
The carrying amounts reported in the balance sheet for cash and cash equivalents, net accounts receivable, accounts payable, and accrued liabilities approximate fair value given their short-term maturities of the financial instruments.
The carrying amounts reported in the balance sheet for the line of credit approximate fair value given the financial instruments bear interest at variable market rates. The fair value of the Company’s long-term debt was approximately $88,564,000 as of March 31, 2007.
3. Subsequent Events
In June 2007, 100% of the Company’s outstanding stock was acquired by CT Technologies Holdings, LLC for a purchase price of approximately $195,402,000. In connection with the acquisition, all of the Company’s outstanding promissory notes were re-paid.
F-83
Table of Contents
ChartOne, Inc. and Subsidiaries
Consolidated Financial Statements
December 31, 2007
F-84
Table of Contents
ChartOne, Inc. and Subsidiaries
Index
December 31, 2007
| Page(s) | ||
| F-86 | ||
| Financial Statements |
||
| F-87 | ||
| F-88 | ||
| Consolidated Statement of Redeemable Convertible Preferred Stock and Stockholders’ Deficit |
F-89 | |
| F-90 | ||
| F-91-108 |
F-85
Table of Contents
Report of Independent Auditors
To the Board of Directors of
ChartOne, Inc. and Subsidiaries
In our opinion, the accompanying consolidated balance sheet and the related consolidated statements of operations, stockholders’ equity, and cash flows present fairly, in all material respects, the financial position of ChartOne, Inc. and Subsidiaries (the “Company”) at December 31, 2007, and the results of their operations and their cash flows for the year then ended in conformity with accounting principles generally accepted in the United States of America. These financial statements are the responsibility of the Company’s management. Our responsibility is to express an opinion on these financial statements based on our audit. We conducted our audit of these statements in accordance with auditing standards generally accepted in the United States of America. Those standards require that we plan and perform the audit to obtain reasonable assurance about whether the financial statements are free of material misstatement. An audit includes examining, on a test basis, evidence supporting the amounts and disclosures in the financial statements, assessing the accounting principles used and significant estimates made by management, and evaluating the overall financial statement presentation. We believe that our audit provides a reasonable basis for our opinion.
Boston, Massachusetts
June 12, 2008
| /s/ PricewaterhouseCoopers LLP |
F-86
Table of Contents
ChartOne, Inc. and Subsidiaries
Consolidated Balance Sheet
December 31, 2007
(in thousands, except share and per share amounts)
| Assets |
||||
| Current assets |
||||
| Cash |
$ | 1,015 | ||
| Accounts receivable, less allowance for doubtful accounts of $2,727 |
9,318 | |||
| Prepaid expenses |
996 | |||
| Deferred charges |
683 | |||
| Other current assets |
262 | |||
| Total current assets |
12,274 | |||
| Property, equipment, and software development costs, net |
5,547 | |||
| Goodwill |
30,075 | |||
| Intangible assets, net |
10,272 | |||
| Other assets, net |
30 | |||
| Total assets |
$ | 58,198 | ||
| Liabilities, Redeemable Convertible Preferred Stock and Stockholders’ Equity |
||||
| Liabilities |
||||
| Current liabilities |
||||
| Current maturities of long-term debt and line of credit |
$ | 27,439 | ||
| Accounts payable |
1,410 | |||
| Accrued payroll |
3,637 | |||
| Accrued liabilities |
3,698 | |||
| Deferred revenue |
1,308 | |||
| Other liabilities |
1,060 | |||
| Total current liabilities |
38,552 | |||
| Long-term debt, less current maturities |
786 | |||
| Deferred revenue |
754 | |||
| Deferred income taxes |
1,465 | |||
| Total liabilities |
41,557 | |||
| Commitments and contingencies (Notes 1 and 6) |
||||
| Redeemable convertible preferred stock |
||||
| Series I convertible preferred stock ($0.01 par value. Authorized 3,055,000 shares; liquidation value $40,010; issued and outstanding 3,051,880 shares at December 31, 2007) |
40,010 | |||
| Series II convertible preferred stock ($0.01 par value. Authorized 16,148,000 shares; redemption and liquidation value $48,052; issued and outstanding 9,707,427 shares at December 31, 2007) |
48,052 | |||
| Total redeemable convertible preferred stock |
88,062 | |||
| Stockholders’ equity |
||||
| Common stock ($0.001 par value. Authorized 25,000,000 shares; issued and outstanding 364,149 shares at December 31, 2007) |
— | |||
| Additional paid-in capital |
23,527 | |||
| Accumulated deficit |
(94,948 | ) | ||
| Total stockholders’ deficit |
(71,421 | ) | ||
| Total liabilities, redeemable convertible preferred stock and stockholders’ deficit |
$ | 58,198 | ||
The accompanying notes are an integral part of these consolidated financial statements.
F-87
Table of Contents
ChartOne, Inc. and Subsidiaries
Consolidated Statement of Operations
Year Ended December 31, 2007
(in thousands)
| Net service revenues |
$ | 84,600 | ||
| Cost of service revenues |
55,026 | |||
| Gross profit |
29,574 | |||
| Operating expenses |
||||
| Selling, general, and administrative expenses |
20,736 | |||
| Research and development expense |
3,251 | |||
| Provision for bad debts |
1,359 | |||
| Amortization and impairment of intangible assets |
2,257 | |||
| Total operating expenses |
27,603 | |||
| Gain (loss) from operations |
1,971 | |||
| Interest expense, net |
(2,425 | ) | ||
| Loss before provision (benefit) for income taxes |
(454 | ) | ||
| Provision (benefit) for income taxes |
213 | |||
| Net loss |
$ | (667 | ) | |
The accompanying notes are an integral part of these consolidated financial statements.
F-88
Table of Contents
ChartOne, Inc. and Subsidiaries
Consolidated Statement of Redeemable Convertible Preferred Stock and Stockholders’ Deficit
Year Ended December 31, 2007
(in thousands, except share amounts)
| Series I Convertible Preferred Stock |
Series II Convertible Preferred Stock |
Total Redeemable Convertible Preferred Stock |
Additional Paid-in Capital |
Accumulated Deficit |
Total Stockholders’ Deficit |
||||||||||||||||||||||||||||
| Common Stock | |||||||||||||||||||||||||||||||||
| Shares | Amount | Shares | Amount | Shares | Amount | Shares | Amount | ||||||||||||||||||||||||||
| Balances, December 31, 2006 |
3,051,880 | $ | 40,010 | 7,070,708 | $ | 35,000 | 10,122,588 | $ | 75,010 | 364,149 | $ | — | $ | 23,503 | $ | (81,230 | ) | $ | (57,727 | ) | |||||||||||||
| Issuance of dividend on Series II convertible preferred stock |
— | — | 2,636,719 | 13,052 | 2,636,719 | 13,052 | — | — | — | (13,051 | ) | (13,051 | ) | ||||||||||||||||||||
| Amortization of stock-based compensation |
— | — | — | — | — | — | — | — | 24 | — | 24 | ||||||||||||||||||||||
| Net loss |
— | — | — | — | — | — | — | — | — | (667 | ) | (667 | ) | ||||||||||||||||||||
| Balances, December 31, 2007 |
3,051,880 | $ | 40,010 | 9,707,427 | $ | 48,052 | 12,759,307 | $ | 88,062 | 364,149 | $ | — | $ | 23,527 | $ | (94,948 | ) | $ | (71,421 | ) | |||||||||||||
The accompanying notes are an integral part of these consolidated financial statements.
F-89
Table of Contents
ChartOne, Inc. and Subsidiaries
Consolidated Statement of Cash Flows
Year Ended December 31, 2007
(in thousands)
| Cash flows from operating activities |
||||
| Net loss |
$ | (667 | ) | |
| Adjustments to reconcile net loss to net cash provided by operating activities |
||||
| Depreciation and amortization |
3,268 | |||
| Amortization and impairment of intangible assets |
2,257 | |||
| Stock-based compensation |
24 | |||
| Provision for doubtful accounts |
1,359 | |||
| Loss on disposal of fixed assets |
16 | |||
| Deferred taxes |
198 | |||
| Gain on sale of storage business |
(238 | ) | ||
| Changes in operating assets and liabilities |
||||
| Accounts receivable |
(1,474 | ) | ||
| Prepaid expenses and other assets |
(172 | ) | ||
| Accounts payable |
(12 | ) | ||
| Accrued payroll and accrued liabilities |
1,323 | |||
| Deferred revenue |
345 | |||
| Other liabilities |
(52 | ) | ||
| Net cash provided by operating activities |
6,175 | |||
| Cash flows from investing activities |
||||
| Purchases of property, equipment, and software development costs |
(1,891 | ) | ||
| Net proceeds from sale of storage business |
477 | |||
| Net cash used in investing activities |
(1,414 | ) | ||
| Cash flows from financing activities |
||||
| Net (repayment) proceeds from line of credit |
(3,190 | ) | ||
| Principal payments of debt |
(1,126 | ) | ||
| Net cash used in financing activities |
(4,316 | ) | ||
| Increase in cash |
445 | |||
| Cash |
||||
| Beginning of year |
570 | |||
| End of year |
$ | 1,015 | ||
| Supplemental disclosures of cash flow information |
||||
| Cash paid during the period for |
||||
| Interest |
$ | 2,369 | ||
| Taxes |
204 | |||
| Noncash items |
||||
| Property and equipment acquired through capital lease obligations |
1,284 | |||
| Series II convertible, preferred stock dividend |
13,051 |
The accompanying notes are an integral part of these consolidated financial statements.
F-90
Table of Contents
ChartOne, Inc. and Subsidiaries
Notes to Consolidated Financial Statements
December 31, 2007
1. The Company
ChartOne, Inc. (“ChartOne” or the “Company”) was incorporated in Delaware on September 1, 1999. The Company’s principal line of business is to provide outsourcing services for the release of information (“ROI”) function for hospitals, medical clinics, and others in the healthcare industry. ROI services include the duplication of requested information to external third-party customers, such as hospital patients and attorneys. In addition, the Company has developed a series of web-based applications that provide patient chart management solutions to the healthcare industry.
The Company is the successor to a business that was previously a wholly-owned subsidiary of QuadraMed Corporation. The current stockholders acquired the net assets of ChartOne on September 28, 2000.
On December 17, 2001, the Company acquired MomsDesk Commerce Corporation (“MomsDesk”), which had previously served as the Company’s outsource software development organization. In connection with the acquisition, the Company incorporated a wholly-owned subsidiary, ChartOne Software Development, Inc.
On June 13, 2002, the Company acquired certain assets and liabilities of Electronic Health Information, Inc. (“EHI”). EHI was comprised of three companies: Correspondence Management Information Company, Med-Cor, and Health Data Company. At the time of acquisition, a wholly-owned subsidiary, ChartOne LLC, was incorporated.
On July 20, 2004, the Company acquired Intertech Information Management, Inc. (“eWebHealth”). In connection with the acquisition, the Company incorporated a wholly-owned subsidiary, eWebHealth Inc. eWebHealth developed and delivered remote coding medical records management software and services. On December 14, 2006, eWebHealth merged with ChartOne, Inc.
Liquidity
Since inception, the Company has incurred operating losses and at December 31, 2007 had an accumulated deficit of $94.9 million. At December 31, 2007, the Company had a working capital deficit of $26.3 million. Included in this amount was a balance due under the credit facility of $24.9 million and a line of credit of $1.3 million. The credit facility is due on its anniversary date annually and the line of credit expires in July 2008; therefore, both amounts are shown as current liabilities.
The Company’s majority shareholder has provided the bank with standby irrevocable letters of credit to repay up to $25.2 million in principal and interest due under the credit facility.
Consequently, the Company’s continuing operation is dependent on the credit facility and support of its major shareholder until such time it can generate profits.
F-91
Table of Contents
ChartOne, Inc. and Subsidiaries
Notes to Consolidated Financial Statements—(Continued)
December 31, 2007
2. Summary of Significant Accounting Policies
Basis of Presentation and Principles of Consolidation
The consolidated financial statements of the Company include the accounts of ChartOne, Inc., ChartOne Software Development, Inc., and ChartOne LLC. All significant intercompany balances and transactions have been eliminated upon consolidation. The accrual method of accounting is used in the preparation of the consolidated financial statements.
Deferred Charges
Deferred charges are costs incurred in connection with the implementation of the Company’s Chart Management Services. Costs incurred which directly relate to the implementation of Chart Management Solutions are deferred until the product is implemented and the associated revenue is recognized.
Property and Equipment
Property and equipment are recorded at cost, or allocated fair value for assets acquired in a business combination. Depreciation expense is computed for financial reporting purposes using the straight-line method over the estimated useful lives of the assets as follows:
| Years | ||
| Computer hardware and software |
3 | |
| Furniture and fixtures |
5 | |
| Office equipment |
5 | |
| Vehicles |
7 | |
| Leasehold improvements |
Over the shorter of the respective lease terms or life of the assets |
Assets acquired under capital leases are being amortized over the shorter of the respective lease term or the life of the assets. Amortization of capital leases is included in depreciation expense.
Software Development Costs
Historically, the Company has not developed software for external use. The Company is currently developing software for internal use and the costs incurred in the development of such software are accounted for in accordance with American Institute of Certified Public Accountants’ (“AICPA”) Statement of Position (“SOP”) 98-1, Accounting for the Costs of Computer Software Developed or Obtained for Internal Use. As such, costs incurred for internal use software are expensed as incurred until management commits to funding the project and is confident it will be completed and used in the functions intended; thereafter, qualified costs are capitalized. Once production release occurs, the capitalized cost is then amortized on a straight-line basis over the estimated product life. During the year ended December 31, 2007, the Company capitalized $614 of software development costs related to technology products and services (Chart Management Solutions). During the year ended December 31, 2007, the
F-92
Table of Contents
ChartOne, Inc. and Subsidiaries
Notes to Consolidated Financial Statements—(Continued)
December 31, 2007
2. Summary of Significant Accounting Policies—Continued
Company capitalized $84 of software development costs related to software that is used in the Company’s business applications. All costs are classified as software within property and equipment. During the year ended December 31, 2007, the Company amortized $530 of capitalized software development costs related to Chart Management Solutions and the Company’s business applications.
Goodwill and Intangible Assets
Goodwill represents the excess of costs over fair value of assets of businesses acquired. Goodwill and intangible assets acquired in a purchase business combination and determined to have an indefinite useful life are not amortized, but instead tested for impairment at least annually in accordance with the provisions of SFAS No. 142, Goodwill and Other Intangible Assets (“SFAS No. 142”), which requires that goodwill be tested for impairment at the reporting level, which is one level below an operating segment. The Company performs its annual assessment as of the end of its fiscal year.
The Company’s impairment determination is made at the reporting unit level and consists of two steps. First, the Company determines the fair value of a reporting unit and compares it to its carrying amount. Second, if the carrying amount of a reporting unit exceeds its fair value, an impairment loss is recognized for any excess of the carrying amount of the reporting unit’s goodwill over the implied fair value of that goodwill. The implied fair value of goodwill is determined by allocating the fair value of the reporting unit in a manner similar to a purchase price allocation, in accordance with SFAS No. 141, Business Combinations (“SFAS No. 141”). The residual fair value after this allocation is the implied fair value of the reporting unit goodwill.
As of December 31, 2007, goodwill is $30,075 and is related to the Core Services reporting unit. At December 31, 2006, the carrying value of goodwill related to the Chart Management Solutions reporting unit was found to be greater than its implied value and as a result, the Company recognized an impairment charge of $9,825.
Use of Estimates
The preparation of financial statements in conformity with accounting principles generally accepted in the United States of America requires management to make estimates and assumptions that affect the reported amounts of assets and liabilities, the disclosure of contingent assets and liabilities at the date of the financial statements, and the reported amounts of expenses during the reporting period. Actual results could differ from those estimates. The most significant estimates are for the allowance for doubtful accounts, the accrual for probable and estimable litigation contingencies, revenue recognition, valuation of intangible assets, and the carrying value of goodwill and long-lived assets.
Management analyzes the aging of accounts receivable, historical bad debts experience, and current economic trends when evaluating the adequacy of the allowance for doubtful accounts. Management analyzes the facts and circumstances of individual pending litigation
F-93
Table of Contents
ChartOne, Inc. and Subsidiaries
Notes to Consolidated Financial Statements—(Continued)
December 31, 2007
2. Summary of Significant Accounting Policies—Continued
cases, and assesses the likelihood of unfavorable outcomes and the possible exposures when evaluating the adequacy of the provision for litigation contingencies under the criteria of Statement of Financial Accounting Standards (“SFAS”) No. 5, Accounting for Contingencies.
Revenue Recognition
The Company’s revenue results primarily from providing ROI services. Such revenue is recorded in the period in which the services are rendered or when cash is received if collectibility is not reasonably assured. Chart Management Solutions revenue is recognized as services are delivered and payments become due and payable. Revenue arrangements that involve multiple elements are allocated to each of the elements based on the residual method utilizing objective fair value for the undelivered elements, regardless of any separate prices stated within the contract for each element. When fair value for undelivered elements cannot be obtained, the Company recognizes revenue under multi-element contracts as a single unit of accounting and recognizes all elements over the contract period based on a rationale and systematic basis.
The Company has different revenue streams related to its two operating segments, core services and chart management services.
Core Services
Core services consist of a variety of service offerings, the largest of which relates to ROI services. As previously mentioned, ROI services include the duplication of requested information to external third-party customers, such as hospital patients and attorneys. Generally, the Company charges the customer a per-page fee for the copying service. These fees are regulated in the majority of the states within the United States of America. The Company also provides ROI duplication services to the medical facilities in which they operate at rates stipulated in the contracts. Such revenue is recorded in the period in which the services are rendered or when cash is received if collectibility is not reasonably assured.
Chart Management Services
Chart management services revenue consists of eWebCoding and Chart Management Solutions. Under eWebCoding, the Company offers an entry level hosting option for medical facilities that wish to automate medical records management. Customers sign up for term agreements that typically range from two to three years and utilize term software licenses to scan medical records to an electronic format for on-demand storage and retrieval. The medical records are scanned and stored in a central hosting facility owned and operated by the Company.
Chart Management Solutions is an enhanced hosting option for medical facilities that wish to automate medical records management and streamline other related processes. The Chart Management Solutions includes the eWebCoding service, as well as the option to integrate additional services, such as eWebView (electronic archival and retrieval of online medical
F-94
Table of Contents
ChartOne, Inc. and Subsidiaries
Notes to Consolidated Financial Statements—(Continued)
December 31, 2007
2. Summary of Significant Accounting Policies—Continued
records), eWebSignature (electronic records sign-off) and eWebCompletion (electronic queuing for doctor review). Fees charged for eWebCoding and Chart Management Solutions services consist of minimum monthly fees plus, in the case of eWebCoding, an additional usage fee.
The Company recognizes revenue under its multi-element contracts for chart management services as a single unit of accounting and recognizes all elements over the contractual period of performance on a rationale and systematic basis.
Impairment of Long-Lived Assets and Goodwill
In accordance with SFAS No. 144, Accounting for the Impairment or Disposal of Long-Lived Assets (“SFAS No. 144”), long-lived assets, such as property, plant, and equipment, and purchased intangibles subject to amortization, are reviewed for impairment whenever events or changes in circumstances indicate that the carrying amount of an asset may not be recoverable. Recoverability of assets to be held and used is measured by a comparison of the carrying amount of an asset to estimated undiscounted future cash flows expected to be generated by the asset. If the carrying amount of an asset exceeds its estimated future cash flows, an impairment charge is recognized by the amount by which the carrying amount of the asset exceeds the fair value of the asset. An impairment loss is recognized to the extent that the carrying amount exceeds the asset’s fair value.
Income Taxes
We account for income taxes in accordance with SFAS 109, Accounting for Income Taxes. Accordingly, our provision for income taxes is determined using the asset and liability method. Under this method, deferred income tax assets and liabilities are calculated based upon the temporary differences between the financial statement and income tax bases of assets and liabilities using the combined federal and state effective tax rates that are applicable to us in a given year. The effect of a change in income tax rates on deferred income tax assets and liabilities is recognized as a component of income tax expense in the period which includes the enactment date.
The deferred income tax assets are recorded net of a valuation allowance when, based on the weight of available evidence, we believe it is more likely than not that some portion or all of the recorded deferred tax assets will not be realized in future periods. In making such determination, the Company considers all available positive and negative evidence, including scheduled reversals of deferred income tax liabilities, projected future taxable income, tax planning strategies and recent financial operations. In the event the Company was to determine that the Company would be able to realize the deferred income tax assets in the future in excess of their respective net recorded amounts, the Company would make an adjustment to the valuation allowance which would reduce the provision for income taxes in the period of determination. At December 31, 2007, the Company has recorded a full valuation allowance against the net deferred income tax asset, exclusive of a deferred income tax liability related indefinite lived intangible assets, as the Company believes that it is not more likely than not that it will ultimately realize the net deferred income tax asset recorded at December 31, 2007. The
F-95
Table of Contents
ChartOne, Inc. and Subsidiaries
Notes to Consolidated Financial Statements—(Continued)
December 31, 2007
2. Summary of Significant Accounting Policies—Continued
Company recorded approximately $8.8 million of the valuation allowance in purchase accounting in connection with prior business combinations. Under the current standard, to the extent that any valuation allowances established in purchase accounting are reduced, these reductions are recorded as adjustments to goodwill rather than to the provision for income taxes. Beginning January 1, 2009, these reductions will be recorded through our statement of operations as a result of our adoption of SFAS No. 141(R), Business Combinations.
Comprehensive Loss
The Company does not have any components of other comprehensive loss; consequently, comprehensive loss consists entirely of the net loss for the periods presented.
Stock-Based Compensation
Prior to 2006, the Company applied the intrinsic value method as prescribed in Accounting Principles Board Opinion No. 25, Accounting for Stock Issued to Employees (“APB No. 25”), and related interpretations, in accounting for stock options granted under the stock option plan. Under the intrinsic value method, no compensation cost is recognized if the exercise price of the Company’s employee stock options was equal to or greater than the market price of the underlying stock on the date of the grant. Accordingly, no compensation cost was recognized in the accompanying consolidated statements of operations prior to 2006 on stock options granted to employees, since all options granted under the Company’s stock option plan had an exercise price equal to the market value of the underlying common stock on the date of grant.
Effective January 1, 2006, the Company adopted SFAS No. 123(R), Share-Based Payment (“SFAS 123(R)”). This statement replaces SFAS No. 123, Accounting for Stock-Based Compensation (“SFAS No. 123”) and supersedes APB No. 25. SFAS No. 123(R) requires that all stock-based compensation be recognized as an expense in the financial statements and that such cost be measured at the fair value of the award. This statement was adopted using the prospective method of application, which requires the Company to recognize compensation cost on a prospective basis (Note 9).
Recently Issued Accounting Standards
In July 2006, the FASB issued Interpretation No. 48, Accounting for the Uncertainty in Income Taxes (“FIN 48”). FIN 48 clarifies the accounting for uncertainty in income taxes recognized in an entity’s financial statements in accordance with SFAS No. 109, Accounting for Income Taxes, and prescribes a recognition threshold or measurement attribute for financial statement disclosure of tax positions taken or expected to be taken on a tax return requiring that we determine whether it is more likely than not that a tax position will be sustained upon examination by the appropriate taxing authority. Additionally, FIN 48 provides guidance on derecognition, classification, interest and penalties, accounting in interim periods, disclosure and transition. FIN 48 is effective for fiscal years beginning after December 15, 2007, with early adoption permitted. The Company has not yet determined the impact of adoption on its consolidated financial statements.
F-96
Table of Contents
ChartOne, Inc. and Subsidiaries
Notes to Consolidated Financial Statements—(Continued)
December 31, 2007
2. Summary of Significant Accounting Policies—Continued
In September 2006, the FASB issued SFAS No. 157, Fair Value Measurements (“SFAS No. 157”). SFAS No. 157 establishes a framework for reporting fair value and expands disclosures about fair value measurements. The Company is required to adopt SFAS No. 157 as of January 1, 2008. The Company has not yet determined the impact of adoption on its consolidated financial statements.
In February 2007, the FASB issued SFAS No. 159, The Fair Value Option for Financial Assets and Financial Liabilities (“SFAS No. 159”). SFAS No. 159 provides companies with the option to measure specified financial instruments and certain other items at fair value. The Company is required to adopt SFAS No. 159 as of January 1, 2008. The Company has not yet determined the impact of adoption on its consolidated financial statements.
3. Property and Equipment
Property and equipment consist of the following as of December 31, 2007:
| Computer hardware and software |
$ | 14,824 | ||
| In-process software development costs |
1,088 | |||
| Leasehold improvements |
533 | |||
| Furniture and fixtures |
511 | |||
| Office equipment |
508 | |||
| Vehicles |
25 | |||
| 17,489 | ||||
| Less accumulated depreciation and amortization |
(11,942 | ) | ||
| Property and equipment, net |
$ | 5,547 | ||
Included in the above property and equipment are assets held under capital leases:
| Computer hardware and software |
$ | 3,489 | ||
| Less accumulated amortization |
(1,439 | ) | ||
| Assets under capital leases, net |
$ | 2,050 | ||
Depreciation expense was $3,268 for the year ended December 31, 2007.
F-97
Table of Contents
ChartOne, Inc. and Subsidiaries
Notes to Consolidated Financial Statements—(Continued)
December 31, 2007
4. Intangible Assets
Intangible assets consist of the following as of December 31, 2007:
| Gross Carrying Amount |
Accumulated Amortization |
Net Intangible Assets | |||||||
| Amortized intangible assets |
|||||||||
| Customer lists |
$ | 17,677 | $ | 9,981 | $ | 7,696 | |||
| Contracted revenue |
3,572 | 3,572 | — | ||||||
| Developed technology |
1,927 | 1,927 | — | ||||||
| 23,176 | 15,480 | 7,696 | |||||||
| Nonamortized intangible asset |
|||||||||
| Trade name |
2,576 | — | 2,576 | ||||||
| Total intangible assets |
$ | 25,752 | $ | 15,480 | $ | 10,272 | |||
In accordance with SFAS No. 142, the Company completed the annual impairment test of its nonamortizing intangible asset trade name as of December 31, 2007 for each reporting unit. At December 31, 2006 an impairment charge of $672 was recognized as the carrying value of the asset exceeded its fair value. No such impairment existed at December 31, 2007.
The intangible assets are being amortized on a straight-line basis over the following useful lives, except for the trade name, which is not amortized but is subject to an impairment test whenever events or changes in circumstances indicate that the carrying amount may not be recoverable:
| Years | ||
| Contracted revenue |
3 | |
| Developed technology |
3 | |
| Customer list |
8 to 10 | |
| Trade name |
Indefinite life |
Amortization expense was $2,257 for the year ended December 31, 2007.
Estimated amortization expense for the next five years is as follows:
| Year Ending December 31, |
|||
| 2008 |
$ | 2,073 | |
| 2009 |
2,073 | ||
| 2010 |
1,869 | ||
| 2011 |
1,061 | ||
| 2012 |
620 |
In conjunction with the SFAS No. 142 analysis, and in accordance with SFAS No. 144, the Company completed an analysis on long-lived assets, including amortized intangible assets, which resulted in no impairment as carrying values were less than fair values on an undiscounted cash flow basis as of December 31, 2007.
F-98
Table of Contents
ChartOne, Inc. and Subsidiaries
Notes to Consolidated Financial Statements—(Continued)
December 31, 2007
5. Short-Term and Long-Term Debt and Liquidity
Debt at December 31, 2007 consisted of the following:
| Fully collateralized loan payable, interest at prime rate less 1.40% (5.85% at December 31, 2007) |
$ | 12,321 | ||
| Fully collateralized loan payable, interest at prime rate less 1.40% (5.85% at December 31, 2007) |
12,530 | |||
| Line of credit agreement, interest at prime rate plus 2.25% (9.50% at December 31, 2007) |
1,261 | |||
| Other debt, weighted average interest rate of 11.55% at December 31, 2007 |
2,113 | |||
| Total long-term debt |
28,225 | |||
| Less current maturities |
(27,439 | ) | ||
| Long-term debt, less current maturities |
$ | 786 | ||
The Company entered into financing arrangements with various financing companies for computer hardware and software. These financing agreements have various interest rates and maturity dates through 2010. As of December 31, 2007, $1,327 of the $2,113 in other debt, is due in 2008.
The aggregate maturities of short-term and long-term debt for each of the three years subsequent to December 31, 2007 are: $27,439 in 2008, $723 in 2009 and $63 in 2010.
The Company’s accounts receivable financing line with Greater Bay Bancorp allows for maximum borrowings of $8,000 through March 12, 2008. An extension was received through July 17, 2008 allowing for maximum borrowings of $4,000 (Note 13). On December 31, 2007, the maximum amount available under the accounts receivable financing line was $6,052 of which $1,261 was outstanding. Under the terms of the line, the Company may borrow up to 80% of eligible accounts receivable (as defined in the agreement) and is required to submit weekly accounts receivable aging reports to support our borrowings. The secured line of credit has financial debt covenants tied to quarterly operating profits. The Company was not in compliance with all bank-related covenants during the fourth quarter, but obtained a waiver from Greater Bay Bancorp. In addition, the Company did not submit its December 31, 2006 financial statements within 150 days of year-end, but obtained a waiver from Greater Bay Bancorp.
Interest expense was $2,425 for the year ended December 31, 2007.
On September 19, 2003, the Company entered into a Loan and Security Agreement for $23,000 of loans with Greater Bay Bancorp which are fully collateralized by standby irrevocable letters of credit. Certain Company shareholders provided Greater Bay Bancorp with standby irrevocable letters of credit to repay up to $23,200 in principal and interest due under the credit facility with the Company in the event that the Company became unable to refinance or repay this obligation. The shareholders would receive an additional investment in the Company in the form of debt or equity in the event repayment of the Greater Bay Bancorp debt through letters of credit occurs.
F-99
Table of Contents
ChartOne, Inc. and Subsidiaries
Notes to Consolidated Financial Statements—(Continued)
December 31, 2007
5. Short-Term and Long-Term Debt and Liquidity—Continued
On March 29, 2007, the Company, under the Loan and Security Agreement with Greater Bay Bancorp, increased its outstanding borrowings by $2,000. At December 31, 2007, outstanding borrowings under this credit facility included loans of $12,321 and $12,530. The amounts due are extended annually at the anniversary dates of the borrowings, which are April 30, 2009 and February 15, 2009, respectively.
6. Commitments and Contingencies
Litigation and Asserted Claims
The Company is currently, and may be in the future, a party to pricing-related litigation in states in which it does business as well as other litigation related to the Company’s core business. The Company has estimated its exposure for such litigation and accrued $1,060 for such costs in its accounts as of December 31, 2007. This amount is reported in other liabilities on the accompanying consolidated balance sheets.
The Company is involved in various other legal actions arising in the normal course of business, none of which management expects to be material to the consolidated financial statements.
Lease Commitments
The Company leases its office facilities and certain equipment under operating lease agreements, which have terms up to six years. Certain of the office facilities leases contain options to extend the terms at monthly rentals, which include inflation escalation clauses. Certain of the equipment leases contain options to extend the terms at monthly rentals, which include reduced monthly rental charges subsequent to the expiration of the original terms.
The total office facilities rent expense for the year ended December 31, 2007 was $1,098. The total equipment rental expense (including copier rental charges for lease equipment, which continues to be rented after expiration of the lease term) for the year ended December 31, 2007 was $1,676.
Future minimum lease payments (assuming no cancellations by the Company) under operating leases as of December 31, 2007 are as follows:
| Year Ending December 31, |
|||
| 2008 |
$ | 1,819 | |
| 2009 |
1,290 | ||
| 2010 |
484 | ||
| 2011 |
386 | ||
| 2012 |
1 | ||
| $ | 3,980 | ||
F-100
Table of Contents
ChartOne, Inc. and Subsidiaries
Notes to Consolidated Financial Statements—(Continued)
December 31, 2007
6. Commitments and Contingencies—Continued
Contingent Payment
On December 17, 2001, ChartOne acquired MomsDesk. A $350 contingent payment was specified in the acquisition agreement and is payable upon the Company’s sale of 25 eWebView service offerings. There have been no related payments through December 31, 2007.
7. Income Taxes
The components of loss before income taxes were:
| Years ended December 31, |
2007 | |||
| U.S. |
$ | (454 | ) | |
Income tax expense/(benefit) consisted of the following:
| Years ended December 31, |
2007 | ||
| Current tax expense |
|||
| U.S. federal |
$ | 15 | |
| U.S. state |
— | ||
| 15 | |||
| Deferred tax expense |
|||
| U.S. federal |
162 | ||
| U.S. state |
36 | ||
| 198 | |||
| Total income tax expense |
$ | 213 | |
The following is a reconciliation of the U.S. federal statutory tax rate of 34% to our recorded income tax expense/(benefit):
| Years ended December 31, |
2007 | ||||||
| U.S. federal statutory tax |
$ | (154 | ) | 34.0 | % | ||
| State income taxes, net of federal benefit |
24 | (5.3 | )% | ||||
| Net losses and temporary differences for which no deferred benefit is recognized |
294 | (64.8 | )% | ||||
| Other |
49 | (10.8 | )% | ||||
| Income tax expense |
$ | 213 | (46.9 | )% | |||
F-101
Table of Contents
ChartOne, Inc. and Subsidiaries
Notes to Consolidated Financial Statements—(Continued)
December 31, 2007
7. Income Taxes—Continued
Significant components of our deferred tax assets, net of deferred tax liabilities, at December 31 were as follows:
| 2007 | ||||
| Deferred Tax Liabilities: |
||||
| Identifiable intangible assets |
$ | (2,557 | ) | |
| Total deferred tax liabilities |
(2,557 | ) | ||
| Deferred Tax Assets: |
||||
| Net operating loss carryforward |
27,999 | |||
| Payroll-related accruals |
300 | |||
| Litigation reserves |
409 | |||
| Depreciation |
244 | |||
| Research and development tax credits |
711 | |||
| Allowance for doubtful accounts |
1,053 | |||
| Other |
217 | |||
| Valuation allowance |
(29,841 | ) | ||
| Total deferred tax assets |
1,092 | |||
| Net deferred tax liabilities |
$ | (1,465 | ) | |
At December 31, 2007, the Company has federal net operating loss carryforwards of approximately $73.9 million, subject to annual utilization limitations pursuant to Internal Revenue Code section 382. If not utilized, the federal net operating loss carryforwards will expire between 2008 and 2027. At December 31, 2007, the Company had approximately $711 thousand of federal general business tax credits which will expire between 2008 and 2025 if not utilized. At December 31, 2007, the Company has state net operating loss carryforwards of approximately $62.8 million which have various dates of expiration.
Net deferred tax assets at December 31 were as follows:
| 2007 | ||||
| Deferred tax assets |
$ | 30,933 | ||
| Deferred tax liabilities |
(2,557 | ) | ||
| Valuation allowance |
(29,841 | ) | ||
| Net deferred tax assets |
$ | (1,465 | ) | |
In July 2006, the FASB issued FIN 48, Accounting for Uncertainty in Income Taxes, which provides clarification of SFAS 109 with respect to the recognition of income tax benefits of uncertain income tax positions in the financial statements. FIN 48 requires uncertain income tax positions to be reviewed and assessed with recognition and measurement of the income tax benefit related to such uncertain income tax position on a “more likely than not” standard. Income tax benefits of uncertain income tax positions taken on income tax returns which do not qualify for financial statement recognition are required to be disclosed in the financial statements.
F-102
Table of Contents
ChartOne, Inc. and Subsidiaries
Notes to Consolidated Financial Statements—(Continued)
December 31, 2007
7. Income Taxes—Continued
Pursuant to FASB Staff Position FIN 48-3, Effective Date of FASB Interpretation No. 48 for Certain Nonpublic Enterprises, non-public companies are required to adopt the provisions of FIN 48 for years beginning after December 15, 2008. Therefore, the Company will adopt the provisions of FIN 48 in 2009. Upon adoption, the cumulative effect of this change in accounting principle will be accounted for as an adjustment to retained earnings. The Company continues to evaluate the potential impact of this standard on its financial statements, though the potential impact
8. Redeemable Convertible Preferred Stock
Convertible Preferred Stock
In July 2004, the Company issued 3,051,880 of its Series I preferred stock in exchange for the then outstanding shares of Series A, B, C, D and E convertible preferred stock based on a certain defined exchange ratio.
In July 2004, the Company sold and issued 7,070,708 shares of Series II convertible preferred stock at a per share purchase price of $4.95.
At December 31, 2007, the Series II and Series I preferred stock have certain rights, preferences and restrictions with respect to dividends, conversion, liquidation, and voting as follows:
Dividends
The holders of the Series II preferred stock are entitled to receive, when and as declared by the board of directors, out of the net profits of the Company or out of any other funds legally available therefore, dividends of 10% per annum of the Stated Value as defined ($4.95 per share for the Series II preferred stock). Dividends on the Series II preferred stock will be paid solely in additional shares of Series II preferred stock. Dividends on the Series II preferred stock shall be cumulative, whether or not in any fiscal year they are declared. On December 31, 2007, a dividend of 2,636,719 shares of Series II convertible preferred stock, valued at $13,052 was issued. As such, cumulative Series II deferred stock issued as of December 31, 2007 is 9,707,427 shares.
The holders of the Series I preferred stock have no preferred dividend rights.
Liquidation
In the event of any liquidation, dissolution or winding-up of the Company, whether voluntary or involuntary, the holders of the Series II and Series I preferred stock are entitled to a per share cash distribution in the amount equal to the greater of (i) the Stated Value per share plus any dividends thereon accrued but unpaid (whether or not declared) or (ii) assuming conversion of the Series II or Series I preferred stock, the amount the holder would have received had the holder converted its Series II or Series I preferred stock into common stock immediately prior to the distribution. Stated Value is $4.95 for the Series II preferred stock and
F-103
Table of Contents
ChartOne, Inc. and Subsidiaries
Notes to Consolidated Financial Statements—(Continued)
December 31, 2007
8. Redeemable Convertible Preferred Stock—Continued
$13.11 for the Series I preferred stock. At December 31, 2007, the liquidation values of the Series II and Series I preferred stock were $48,052 and $40,010, respectively.
After payment of the all-preferential amounts required to be paid by the holders of the Series II and Series I preferred stock, the holders of the common stock are entitled to receive the remaining assets and funds of the Company available for distribution to the stockholders.
The merger or consolidation of the Company into or with another corporation, or the sale, conveyance, mortgage pledge or lease of all or substantially all of the assets of the Company will be deemed to be a liquidation, dissolution or winding-up of the Company, unless the holders of the Series II and Series I preferred stock, voting together as a single class, waive this right as to a specific transaction.
Voting
The Series II and Series I preferred stockholders are entitled to vote on all matters with the common stockholders on an as-converted basis as if they were one class of stock.
The Series II and Series I preferred stockholders are entitled to the number of votes equal to the number of shares of common stock into which each share of Series II and Series I preferred stock is then convertible.
The holders of the Series II and Series I preferred stock, voting together as a single class, have the right to elect up to three directors. In addition, certain preferred stockholders have the right to elect up to two directors based on their respective ownership.
Certain transactions require the approval of the holders of Series II and Series I preferred stock, voting together as a single class, including, but not limited to, a merger with another corporation or sale of the Company’s assets, declaration or payment of dividends or to approve the redemption or repurchase of the any capital stock.
Redemption
The holders of a majority of the outstanding shares of Series II preferred stock may require the Company to redeem all outstanding shares of the Series II preferred stock on the fifth anniversary of the initial issuance day of July 14, 2004 at a price in cash equal to the Stated Value per share plus any dividends accrued but unpaid thereon, whether or not declared. The holders of a majority of the outstanding shares of Series I preferred stock may require the Company to redeem all outstanding shares of the Series I preferred stock on the sixth anniversary of the initial issuance day of July 15, 2004 at a price in cash equal to the Stated Value per share plus any dividends accrued but unpaid thereon, whether or not declared. At December 31, 2007, the redemption values of the Series II and Series I preferred stock were $48,052 and $40,010, respectively.
F-104
Table of Contents
ChartOne, Inc. and Subsidiaries
Notes to Consolidated Financial Statements—(Continued)
December 31, 2007
8. Redeemable Convertible Preferred Stock—Continued
Conversion
Each share of Series II and Series I preferred stock may be converted at any time, at the option of the holder, into the number of shares of common stock obtained by dividing the Series II and Series I conversion value by the conversion price in effect. The initial conversion value for the Series II and Series I preferred stock is $4.95 per share. On any conversion of the Series II preferred stock, all accrued and unpaid dividends on the Series II preferred stock, whether or not declared, shall also convert into additional shares of common stock at the conversion price in effect. The initial conversion rate for the preferred stock is one share of common stock for one share of preferred stock. The applicable conversion rate and conversion price are subject to adjustment, including certain antidilution provisions.
Each share of Series II and Series I preferred stock will automatically convert into shares of common stock upon the closing of a qualified underwritten public offering in which the value of the Company is at least $200,000 and net proceeds to the Company are not less than $50,000.
9. Warrants
In December 2001, the Company issued warrants to certain Company shareholders to purchase 66,664 common shares for $14.16 per share in consideration for the issuance of the letters of credit and the execution of the agreement in connection with the October 2001 Comerica financing. In May 2006, the Company issued warrants to purchase 12,500 common shares for $1.38 per share to Greater Bay Bankcorp in consideration for the renewal of the finance agreement. All warrants are exercisable upon grant.
10. Stock Option Plan
In September 2001, the Company adopted the 2001 Stock Option/Stock Issuance Plan (the “2001 Plan”). The 2001 Plan, as amended, allows for the issuance of up to 1,800,000 shares of common stock. In March 2007, the Plan was amended to allow the issuance of 150,000 more shares of common stock, allowing up to 1,950,000. The 2001 Plan will terminate on September 17, 2011, or an earlier date on which all shares available for issuance under the Plan have been issued as fully vested shares.
At the Board’s discretion, employees, directors, and consultants may be granted options that allow for the purchase of shares of the Company’s common stock, or they may be issued common stock directly, either through the immediate purchase of such shares, or as a bonus for services rendered to the Company. Both nonstatutory and incentive stock options may be granted under the 2001 Plan. Incentive stock options are options that satisfy the requirements of Section 422 of the Internal Revenue Code of 1986, as amended. Nonstatutory options do not satisfy these requirements. Nonstatutory options may be granted to employees, directors, and consultants at a price not less than 85% of the fair market value of common stock on the date the option is granted, or 110% of the fair market value of common stock where the options are granted to those individuals owning more than 10% of the total combined voting power or value of all classes of stock of the Company (a 10% Stockholder). Incentive stock options may only be granted to employees at a price not less than 100% of the fair market value of common stock on
F-105
Table of Contents
ChartOne, Inc. and Subsidiaries
Notes to Consolidated Financial Statements—(Continued)
December 31, 2007
10. Stock Option Plan—Continued
the date the option is granted or, in the case of a 10% Stockholder, at a price not less than 110% of the fair market value of common stock on the date the option is granted.
Direct issuances of shares of the Company’s common stock may be granted to employees, directors, and consultants at a price not less than 85% of the fair market value of common stock on the date of grant, or 100% of the fair market value of common stock where the shares are granted to a 10% Stockholder.
Vesting is subject to determination by the Board, except that (i) no option shall have a term in excess of ten years from the date of grant, except where incentive stock options are granted to a 10% Stockholder, in which case the option term shall not exceed five years; and (ii) shares of common stock issued to employees must vest at a rate of at least 20% per year from the date of issuance.
At December 31, 2007, there were 214,603 additional shares available for the Company grant under the 2001 Plan. The fair value of each option award is estimated on the date of grant using the Black-Scholes option pricing model. The determination of the fair value of share-based payment awards utilizing the Black-Scholes option pricing model is affected by the stock price and a number of assumptions, including expected volatility, expected life, risk-free interest rate and expected dividends. The Company does not have a history of market prices of the common stock as it is not a public company, and as such volatility is estimated in accordance with Securities and Exchange Commission’s Staff Accounting Bulletin No. 107 (“SAB No. 107”) using historical volatilities of similar public entities. The expected life of the awards is estimated based on the simplified method, as defined in SAB No. 107. The risk-free interest rate assumption is based on observed interest rates appropriate for the terms of our awards. The dividend yield assumption is based on history and expectation of paying no dividends. Forfeitures are estimated at the time of grant and revised, if necessary, in subsequent periods if actual forfeitures differ from those estimates. Stock-based compensation expense recognized in the consolidated financial statements in 2006 and thereafter is based on awards that are ultimately expected to vest. The fair value of stock options issued to employees is measured with the following weighted average assumptions:
| 2007 | |||
| Risk-free interest rate |
3.45 | % | |
| Expected dividend yield |
— | ||
| Volatility factor |
57.80 | % | |
| Expected life of option (years) |
5.96 |
The weighted average fair value of stock options granted during the year ended December 31, 2007, under the Black-Scholes option pricing model was $0.95 per share. For the year ended December 31, 2007, the Company recorded stock-based compensation expense of approximately $24 in connection with share-based payment awards. As of December 31, 2007, there was approximately $94 of unrecognized compensation expense related to nonvested stock option awards that is expected to be recognized over a weighted average period of 3.02 years.
F-106
Table of Contents
ChartOne, Inc. and Subsidiaries
Notes to Consolidated Financial Statements—(Continued)
December 31, 2007
10. Stock Option Plan—Continued
A summary of the Company’s share option plan activity is as follows:
| Number of Options |
Weighted average Exercise Price | |||||
| Outstanding as of December 31, 2006 |
1,705,800 | $ | 2.65 | |||
| Granted |
457,950 | 1.38 | ||||
| Exercised |
— | — | ||||
| Canceled |
(439,374 | ) | 2.52 | |||
| Outstanding as of December 31, 2007 |
1,724,376 | 1.48 | ||||
| Options exercisable as of December 31, 2007 |
996,611 | $ | 1.55 | |||
The following table summarizes information about stock options outstanding and exercisable under the 2001 Plan as of December 31, 2007:
| Options Outstanding |
Options Exercisable | |||||||||
| Exercise Price |
Number of |
Weighted Average |
Weighted Average |
Number of |
Weighted Average | |||||
| $14.16 |
13,970 | 4.13 | $14.16 | 13,135 | $14.16 | |||||
| 1.38 |
1,710,406 | 7.58 | 1.38 | 983,476 | 1.38 | |||||
| 1,724,376 | 996,611 | |||||||||
In March 2007, the Board voted to modify the exercise price of 131,930 options granted prior to July 2004 from $14.16 to $1.38.
11. Retirement Plan
The Company sponsors a 401(k) retirement plan (the “Plan”) that covers all employees of the Company. To become a participant, an employee must attain 21 years of age and complete 90 days of service, at which point the employee is eligible to enroll on one of the four entry dates: January 1, April 1, July 1 and October 1. Participants can elect to defer, in the form of contributions to the Plan, their compensation subject to Internal Revenue Service limitations. The Plan permits the Company to make matching contributions to the Plan in which participants vest over four years. No matching contributions was made to the Plan during the year ended December 31, 2007.
12. Restructuring and Other Expenses
In June 2005, the Company announced the relocation of its engineering and development functions from California and Georgia to Massachusetts in an effort to reduce development costs and to better manage the Application Service Provider service. The Company recorded restructuring and other charges of $983 related to the California and Georgia facilities closing,
F-107
Table of Contents
ChartOne, Inc. and Subsidiaries
Notes to Consolidated Financial Statements—(Continued)
December 31, 2007
12. Restructuring and Other Expenses—Continued
which included employee severance related costs of $190 for approximately 25 individuals, $233 in facility exit costs and $560 for consulting services during 2006.
In September 2004, the Company announced the relocation of its corporate headquarters and administrative back office functions from California to a combination of Texas and Massachusetts in an effort to reduce general and administration operating costs and establish the corporate headquarters in Massachusetts where certain members of the executive team reside. The Company recorded restructuring and other charges of $767 in 2004 related to the California facility closing, which included employee severance related costs of $186 for approximately 65 individuals. Additionally, the Company exited the California headquarters facility and recorded facility exit costs of $387 and asset impairment charges of $194 during 2004.
The activity for accrued restructuring charges for the year ended December 31, 2007 was as follows:
| Accrued Restructuring Charges | |||||||||||
| Severance Benefits |
Facility Exit Costs |
Total | |||||||||
| Balance, December 31, 2006 |
$ | — | $ | 100 | $ | 100 | |||||
| Cash payments |
— | (100 | ) | (100 | ) | ||||||
| Balance, December 31, 2007 |
$ | — | $ | — | $ | — | |||||
13. Subsequent Events
The Company extended its current financing arrangements with Greater Bay Bancorp (acquired by Wells Fargo in March of 2008) through July 17, 2008. The extension allows for maximum borrowings of $4,000. The extension was obtained to allow the Company to evaluate its options for a longer term arrangement.
F-108
Table of Contents
ChartOne, Inc. and Subsidiaries
Consolidated Balance Sheets
(In thousands, except share and per share amounts)
| June 30, | ||||||||
| 2008 | 2007 | |||||||
| (unaudited) | ||||||||
| Assets | ||||||||
| Current assets: |
||||||||
| Cash |
$ | 795 | $ | 1,092 | ||||
| Accounts receivable, less allowance for doubtful accounts of $3,468 and $3,224 in 2008 and 2007, respectively |
10,426 | 9,987 | ||||||
| Prepaid expenses |
1,086 | 920 | ||||||
| Other current assets |
1,136 | 877 | ||||||
| Total current assets |
13,443 | 12,876 | ||||||
| Property, equipment, and software development cost, net |
5,279 | 5,189 | ||||||
| Goodwill |
30,075 | 30,075 | ||||||
| Intangible assets, net |
9,236 | 11,309 | ||||||
| Other assets, net |
393 | 48 | ||||||
| Total assets |
$ | 58,426 | $ | 59,497 | ||||
| Liabilities and Stockholders’ Equity | ||||||||
| Liabilities: |
||||||||
| Current liabilities: |
||||||||
| Current maturities of long-term debt and line of credit |
$ | 28,067 | $ | 30,252 | ||||
| Accounts payable |
1,642 | 957 | ||||||
| Accrued payroll |
3,154 | 2,727 | ||||||
| Accrued liabilities |
3,436 | 3,512 | ||||||
| Deferred revenue |
1,423 | 742 | ||||||
| Other liabilities |
773 | 1,113 | ||||||
| Total current liabilities |
38,495 | 39,303 | ||||||
| Long-term debt, less current maturities |
691 | 1,117 | ||||||
| Deferred revenue |
771 | 872 | ||||||
| Deferred income taxes |
1,542 | 1,465 | ||||||
| Total liabilities |
41,499 | 42,757 | ||||||
| Redeemable convertible preferred stock |
||||||||
| Series I convertible preferred stock ($0.01 par value. Authorized 3,055,000 shares; liquidation value $40,010; issued and outstanding 3,051,880 shares in 2008 and 2007) |
40,010 | 40,010 | ||||||
| Series II convertible preferred stock ($0.01 par value. Authorized 16,148,000 shares; redemption and liquidation value $50,279 and $45,736, in 2008 and 2007, respectively, issued and outstanding 10,157,407 shares in 2008 and 9,239,669 in 2007, respectively) |
50,279 | 45,736 | ||||||
| Total redeemable convertible preferred stock |
90,289 | 85,746 | ||||||
| Stockholders’ equity: |
||||||||
| Common stock ($0.001 par value. Authorized 25,000,000 shares; issued and outstanding 364,149 shares in 2008 and 2007) |
— | — | ||||||
| Additional paid-in capital |
23,529 | 23,516 | ||||||
| Accumulated deficit |
(96,891 | ) | (92,522 | ) | ||||
| Total stockholders’ equity |
(73,362 | ) | (69,006 | ) | ||||
| Total liabilities, redeemable convertible preferred stock and stockholders’ equity |
$ | 58,426 | $ | 59,497 | ||||
See accompanying condensed notes.
F-109
Table of Contents
CHARTONE, INC. AND SUBSIDIARIES
Consolidated Statements of Operations
(In thousands)
| Six Months Ended |
||||||||
| 2008 | 2007 | |||||||
| (unaudited) | ||||||||
| Net service revenues |
$ | 43,276 | $ | 42,439 | ||||
| Cost of service revenues |
27,855 | 27,691 | ||||||
| Gross profit |
15,421 | 14,748 | ||||||
| Selling, general, and administrative expenses |
10,340 | 10,497 | ||||||
| Research and development expense |
2,000 | 1,506 | ||||||
| Provision for bad debts |
818 | 683 | ||||||
| Amortization and impairment of intangible assets |
1,037 | 1,220 | ||||||
| Total operating expenses |
14,195 | 13,906 | ||||||
| Gain from operations |
1,226 | 842 | ||||||
| Interest expense, net |
(842 | ) | (1,300 | ) | ||||
| Gain / (loss) before provision for taxes |
384 | (458 | ) | |||||
| Provision for income taxes |
(99 | ) | (99 | ) | ||||
| Net gain / (loss) |
$ | 285 | $ | (557 | ) | |||
See accompanying condensed notes.
F-110
Table of Contents
CHARTONE, INC. AND SUBSIDIARIES
Consolidated Statements of Cash Flows
(In thousands)
| Six Months Ended |
||||||||
| June 30, 2008 |
June 30, 2007 |
|||||||
| (unaudited) | ||||||||
| Cash flows from operating activities: |
||||||||
| Net gain / (loss) |
$ | 285 | $ | (557 | ) | |||
| Adjustments to reconcile net gain / (loss) to net cash provided by operating activities: |
||||||||
| Depreciation and amortization |
1,592 | 1,629 | ||||||
| Amortization and impairment of intangible assets |
1,037 | 1,220 | ||||||
| Stock-based compensation |
— | 12 | ||||||
| Provision for doubtful accounts |
818 | 683 | ||||||
| Loss on disposal of fixed assets |
1 | 14 | ||||||
| Deferred taxes |
77 | 198 | ||||||
| Changes in operating assets and liabilities: |
||||||||
| Accounts receivable |
(1,926 | ) | (1,300 | ) | ||||
| Prepaid expenses and other assets |
(645 | ) | (211 | ) | ||||
| Accounts payable |
232 | (441 | ) | |||||
| Accrued payroll and accrued liabilities |
(744 | ) | 130 | |||||
| Deferred revenue |
132 | (103 | ) | |||||
| Other liabilities |
(286 | ) | 1 | |||||
| Net cash provided by operating activities |
573 | 1,275 | ||||||
| Cash flows from investing activities: |
||||||||
| Purchases of property, equipment, and software development costs |
(768 | ) | (770 | ) | ||||
| Net cash used by investing activities |
(768 | ) | (770 | ) | ||||
| Cash flows from financing activities: |
||||||||
| Net proceeds from line of credit |
789 | 514 | ||||||
| Principal payments of debt |
(814 | ) | (497 | ) | ||||
| Net cash (used) / provided by financing activities |
(25 | ) | 17 | |||||
| (Decrease) / increase in cash |
(220 | ) | 522 | |||||
| Cash beginning of year |
1,015 | 570 | ||||||
| Cash end of year |
$ | 795 | $ | 1,092 | ||||
| Noncash items: |
||||||||
| Property and equipment acquired through capital lease obligations |
557 | 309 | ||||||
| Series II convertible, preferred stock dividend |
2,227 | 2,199 | ||||||
See accompanying condensed notes.
F-111
Table of Contents
ChartOne, Inc. and Subsidiaries
Condensed Notes to Consolidated Financial Statements (Unaudited)
June 30, 2008 and 2007
Unaudited Interim Financial Information
The accompanying interim consolidated balance sheets as of June 30, 2008 and June 30, 2007, the consolidated statements of operations for the six months ended June 30, 2008 and 2007 and the consolidated statements of cash flows for the six months ended June 30, 2008 and 2007 are unaudited. These unaudited interim consolidated financial statements have been prepared in accordance with U.S. generally accepted accounting principles. In the opinion of the Company’s management, the unaudited interim consolidated financial statements have been prepared on the same basis as the audited consolidated financial statements and include all adjustments necessary for the fair presentation of the Company’s statement of financial position at June 30, 2008 and 2007, its results of operations and its cash flows for the six months ended June 30, 2008 and 2007. The results of operations for the six months ended June 30, 2008 are not necessarily indicative of the results to be expected for the year ending December 31, 2008 or any future periods.
Recent Accounting Pronouncements
Fair Value Measurements
In September 2006, the Financial Accounting Standards Board (FASB) issued SFAS No. 157, Fair Value Measurements, (“SFAS No. 157”) which, among other things, established a framework for measuring fair value and required supplemental disclosures about fair value measurements. The changes resulting from the application of this new accounting pronouncement primarily relate to the definition of fair value and the methods used to measure fair value. SFAS No. 157 was effective for fiscal years beginning after November 15, 2007. However, the FASB subsequently deferred SFAS No. 157 for one year insofar as it relates to certain non-financial assets and liabilities.
We adopted SFAS No. 157 on January 1, 2008, except for the provisions relating to non-financial assets and liabilities that are not required or permitted to be recognized or disclosed at fair value on a recurring basis. The adoption of SFAS No. 157 for financial assets and liabilities that are carried at fair value on a recurring basis did not have a material impact on our financial position or results of operations.
Commitments and Contingencies
Litigation and Asserted Claims
The Company is currently, and may be in the future, a party to pricing-related litigation in states in which it does business as well as other litigation related to the Company’s core business. The Company has estimated its exposure for such litigation and accrued $0.8 million and $1.1 million for such costs in its accounts as of June 30, 2008 and 2007, respectively. This amount is reported in other liabilities on the accompanying unaudited consolidated balance sheets.
F-112
Table of Contents
Pro Forma Consolidated Statement of Operations (Unaudited)
(In Thousands)
In September 2008, pursuant to a merger agreement, we purchased 100% of the outstanding stock of ChartOne for a purchase price of approximately $98.0 million. The purchase price was determined based upon the expected annual cash flows to be generated by ChartOne. We purchased ChartOne to expand our healthcare information technology market position and to capitalize on revenue opportunities within our hospital and physical practice customer base.
The following unaudited pro forma consolidated statement of operations for the year ended December 31, 2008 has been prepared to give effect to the acquisition of ChartOne and the 2008 Credit Agreement as if this event had occurred on January 1, 2008.
This unaudited pro forma consolidated statement of operations is presented for illustrative purposes only and is not necessarily indicative of the results of operations that would have actually been reported had the acquisition and the 2008 Credit Agreement occurred on January 1, 2008, nor are they necessarily indicative of future results of operations. The pro forma combined condensed consolidated statement of operations includes pro forma adjustments based upon available information and certain assumptions that we believe are reasonable under the circumstances. Certain non-recurring transactions have been excluded from the statements of operations. The acquisition was accounted for under the purchase method of accounting. The allocation of the purchase price was based upon the estimated fair value of the acquired assets and liabilities in accordance with SFAS No. 141.
F-113
Table of Contents
| Year Ended December 31, 2008 | ||||||||||||||||||||
| Historical | Pro-Forma Adjustments for Acquisition |
Notes | Pro-Forma for Acquisition |
Notes | ||||||||||||||||
| HealthPort, Inc. |
Acquisition (a) |
|||||||||||||||||||
| Net revenues |
$ | 188,169 | $ | 63,088 | $ | (9,180 | ) | b | $ | 242,077 | ||||||||||
| Costs of services and products (exclusive of items shown separately below) |
109,973 | 40,431 | (5,834 | ) | b | 144,570 | ||||||||||||||
| Bad debt expense (recovery) |
9,088 | 1,205 | — | 10,293 | ||||||||||||||||
| Selling, general and administrative |
56,575 | 26,750 | (9,750 | ) | b | 73,575 | ||||||||||||||
| Depreciation and amortization expense |
12,183 | 3,907 | 479 | b | 16,569 | d | ||||||||||||||
| Impairment of goodwill and intangible assets |
25,966 | — | — | 25,966 | ||||||||||||||||
| Total operating costs and expenses |
213,785 | 72,293 | (15,105 | ) | 270,973 | |||||||||||||||
| Loss from operations |
(25,616 | ) | (9,205 | ) | 5,925 | (28,896 | ) | |||||||||||||
| Interest expense, net |
(20,906 | ) | (1,416 | ) | (7,424 | ) | b | (29,746 | ) | c | ||||||||||
| Change in fair value of interest rate swaps |
(1,945 | ) | — | — | (1,945 | ) | ||||||||||||||
| — | ||||||||||||||||||||
| Loss from continuing operations before income tax benefit |
(48,467 | ) | (10,621 | ) | (1,499 | ) | (60,587 | ) | ||||||||||||
| Income tax benefit |
1,409 | (22 | ) | — | b | 1,387 | ||||||||||||||
| Loss from continuing operations |
(47,058 | ) | (10,643 | ) | (1,499 | ) | (59,200 | ) | ||||||||||||
| Pro forma basic and diluted loss from continuing operations per share |
$ | (3.51 | ) | $ (3.68 | ) | |||||||||||||||
| Pro forma basic and diluted weighted average number of shares outstanding |
13,401 | 16,081 | e | |||||||||||||||||
| (a) | Represents the historical operating results of Chartone from January 1, 2008 through September 21, 2008, the acquisition date. |
| (b) | Adjustment to remove E-Web Health business that was not acquired but was part of ChartOne |
| (c) | This adjustment reflects the interest expense associated with the 2008 Credit Agreement used to fund the acquisition of ChartOne using a 7.9% interest rate. A 1/8% sensitivity applied to our current interest rate would yield an approximate $0.1 million impact to interest expense for the year ended December 31, 2008. |
| (d) | This adjustment reflects the amortization and depreciation expense associated with the fair value of the assets required as a result of purchase price adjustments. |
| (e) | This adjustment is to reflect shares granted in conjunction with the acquisition of ChartOne as if the shares had been outstanding as of January 1, 2008. |
| Additional Information |
| • | Cost of Revenues includes $1.1 million of severance and other costs relating to ChartOne business integration. |
| • | Cost of Revenues include $2.4 million of amortization of capitalized software development. |
| • | Selling, general and administrative includes $2.1 million of severance and other costs relating to ChartOne business integration, as well as, $0.5 million related to equity-based compensation expense. |
| • | As of December 31, 2008, the Company and ChartOne are in a full valuation allowance position. The pro forma tax benefit is offset entirely by an incremental valuation allowance. |
F-114
Table of Contents

Table of Contents
PART II
INFORMATION NOT REQUIRED IN PROSPECTUS
| Item 13. | Other Expenses of Issuance and Distribution. |
The following table sets forth all costs and expenses, other than the underwriting discounts and commissions payable by us, expected to be incurred in connection with the offer and sale of the securities being registered. All amounts shown are estimates except for the Securities and Exchange Commission registration fee and the FINRA filing fee.
| Securities and Exchange Commission registration fee |
$5,580 | ||
| FINRA filing fee |
$10,500 | ||
| NASDAQ listing fee |
* | ||
| Printing expenses |
* | ||
| Legal fees and expenses |
* | ||
| Accounting fees and expenses |
* | ||
| Miscellaneous expenses |
* | ||
| Total expenses |
$ | * | |
| * | To be provided by amendment. |
| Item 14. | Indemnification of Directors and Officers. |
Section 102(b)(7) of the Delaware General Corporation Law allows a corporation to provide in its certificate of incorporation that a director of the corporation will not be personally liable to the corporation or its stockholders for monetary damages for breach of fiduciary duty as a director, except where the director breached the duty of loyalty, failed to act in good faith, engaged in intentional misconduct or knowingly violated a law, authorized the payment of a dividend or approved a stock repurchase or redemption in violation of Section 174 of the Delaware General Corporation Law or obtained an improper personal benefit. Our amended and restated certificate of incorporation will provide for this limitation of liability.
Section 145, or Section 145 of the Delaware General Corporation Law provides that a Delaware corporation may indemnify any person who was, is or is threatened to be made, party to any threatened, pending or completed action, suit or proceeding, whether civil, criminal, administrative or investigative, other than an action by or in the right of such corporation, by reason of the fact that such person is or was an officer, director, employee or agent of such corporation or is or was serving at the request of such corporation as a director, officer, employee or agent of another corporation or enterprise. The indemnity may include expenses, including attorneys’ fees, judgments, fines and amounts paid in settlement actually and reasonably incurred by such person in connection with such action, suit or proceeding, provided such person acted in good faith and in a manner he reasonably believed to be in or not opposed to the corporation’s best interests and, with respect to any criminal action or proceeding, had no reasonable cause to believe that his or her conduct was illegal. A Delaware corporation may indemnify any persons who are, were or are threatened to be made, a party to any threatened, pending or completed action or suit by or in the right of the corporation by reasons of the fact that such person is or was a director, officer, employee or agent of another corporation or enterprise. The indemnity may include expenses, including attorneys’ fees, actually and reasonably incurred by such person in connection with the defense or settlement of such action or suit, provided such person acted in good faith and in a manner he reasonably believed to be in or not opposed to the corporation’s best interests, provided that no indemnification is permitted without judicial approval if the officer, director, employee or agent is adjudged to be
II-1
Table of Contents
liable to the corporation. Where an officer or director is successful on the merits or otherwise in the defense of any action referred to above, the corporation must indemnify him against the expenses which such officer or director has actually and reasonably incurred.
Section 145 further authorizes a corporation to purchase and maintain insurance on behalf of any person who is or was a director, officer, employee or agent of the corporation or is or was serving at the request of the corporation as a director, officer, employee or agent of another corporation or enterprise, against any liability asserted against him and incurred by him in any such capacity, or arising out of his or her status as such, whether or not the corporation would otherwise have the power to indemnify him under Section 145.
Our amended and restated certificate of incorporation will provide that we must indemnify our directors and officers to the fullest extent authorized by the DGCL and must also pay expenses incurred in defending any such proceeding in advance of its final disposition upon delivery of an undertaking, by or on behalf of an indemnified person, to repay all amounts so advanced if it should be determined ultimately that such person is not entitled to be indemnified under this section or otherwise.
We intend to enter into indemnification agreements with each of our current directors and executive officers. These agreements will require us to indemnify these individuals to the fullest extent permitted under Delaware law against liabilities that may arise by reason of their service to us, and to advance expenses incurred as a result of any proceeding against them as to which they could be indemnified.
The indemnification rights set forth above shall not be exclusive of any other right which an indemnified person may have or hereafter acquire under any statute, provision of our certificate of incorporation, our by-laws, agreement, vote of stockholders or disinterested directors or otherwise.
We expect to maintain standard policies of insurance that provide coverage (1) to our directors and officers against loss rising from claims made by reason of breach of duty or other wrongful act and (2) to us with respect to indemnification payments that we may make to such directors and officers.
The proposed form of Underwriting Agreement to be filed as Exhibit 1.1 to this Registration Statement provides for indemnification to our directors and officers by the underwriters, but only with respect to written information relating to such underwriters furnished to us by or on behalf of such underwriters specifically for inclusion in this registration statement.
| Item 15. | Recent Sales of Unregistered Securities. |
Set forth below is information regarding shares issued, and incentive shares granted, by us within the past three years that were not registered under the Securities Act. Also included is the consideration, if any, received by us for such shares, incentive shares and information relating to the section of the Securities Act, or rule of the SEC, under which exemption from registration was claimed.
Series A Shares
In connection with our acquisition of Companion, on December 29, 2006, we issued and sold 90,000 of our Series A shares for approximately $37.2 million as follows: 82,741 shares to ABRY Partners and its affiliated funds, 3,871 shares to entities controlled by Mr. Haynes, our Chairman, 1,936 shares to Mr. Labedz, our President and Chief Executive Officer, 1,210 shares to Mr. Webb, our Executive Vice President and 242 shares to W.C.M II, LLC.
II-2
Table of Contents
In connection with our acquisition of SDS, on June 15, 2007, we issued and sold 74,050 Series A shares for approximately $30.6 million as follows: 63,403 shares to ABRY Partners and its affiliated funds, 9,679 shares to Ares Capital Corporation and 484 shares to an entity controlled by Mr. Haynes, our Chairman and 484 shares to Mr. Webb, our Executive Vice President.
In connection with our merger with ChartOne, on September 22, 2008, we issued and sold 54,825 Series A shares for approximately $31.6 million as follows: 33,989 shares to ABRY Partners and its affiliated funds, 5,556 shares to Pennant Park Investment Corporation, 6,132 shares to New York Life Investment Management Mezzanine Partners II, LP, 1,508 shares to NYLIM Mezzanine Partners II Parallel Fund, LP, 6,932 shares to DLJ Investment Partners and its affiliated funds and 707 shares to IP III Plan Investors, L.P.
The issuance and sales of our Series A shares described above were exempt from the registration provisions under the Securities Act in reliance upon Section 4(2) of the Securities Act and Regulation D promulgated thereunder because the transactions were by an issuer not involving a public offering. All investors were ”accredited investors” as defined in the Securities Act and the regulations promulgated thereunder. Each investor represented their intention to acquire the securities for investment only and not with a view to or for sale in connection with any distribution thereof and appropriate legends were affixed to the share certificates and other instruments issued in such transactions. Each investor either received adequate information about us or had access, through employment or other relationships, to such information.
Series B Shares
Since our formation through June 30, 2009, we have granted Series B-1 and Series B-2 shares for no cash consideration to 36 members of our management, our employees and other affiliates through incentive share purchase agreements. Since our formation, we have granted 10,000,000 Series B-1 shares of which 3,323,629 Series B-1 shares have vested as of June 30, 2009. Since our formation, we have granted 25,000,000 Series B-2 shares of which 8,313,803 Series B-2 shares have vested as of June 30, 2009. The Series B shares vest over periods ranging from five to six years and are subject to continuing employment with us (for those shares issued to employees). On March 31, 2008, we effected a 500:1 share split of our Series B shares.
The issuance and sales of our Series B shares described above were deemed to be exempt from the registration provisions under the Securities Act in reliance upon Rule 701 promulgated under Section 3(b) of the Securities Act as transactions pursuant to a compensatory benefit plan or a written contract relating to compensation.
Senior Preferred Shares and Series C Shares
In connection with our acquisition of SDS, on June 15, 2007, we issued and sold 30,000 of our senior preferred shares and 7,730 of our Series C shares for an aggregate offering price of $30.0 million as follows: 24,000 senior preferred shares and 6,184 Series C shares to ABRY Partners and its affiliated funds and 6,000 senior preferred shares and 1,546 Series C shares to Ares Capital Corporation.
The issuance and sales of our senior preferred shares and Series C shares described above were exempt from the registration provisions under the Securities Act in reliance upon Section 4(2) of the Securities Act and Regulation D promulgated thereunder because the
II-3
Table of Contents
transactions were by an issuer not involving a public offering. All investors were “accredited investors” as defined in the Securities Act and the regulations promulgated thereunder. Each investor represented their intention to acquire the securities for investment only and not with a view to or for sale in connection with any distribution thereof and appropriate legends were affixed to the share certificates and other instruments issued in such transactions. Each investor either received adequate information about us or had access, through employment or other relationships, to such information.
Corporate Reorganization
Prior to the effectiveness of this registration statement, we entered into a contribution agreement with each member of CT Technologies Holdings, LLC, pursuant to which each member contributed all of its equity interests, including all Series A, B and C shares and all senior preferred shares, in CT Technologies Holdings, LLC to us in return for 16,509,286 shares of our common stock, and shares of our senior preferred stock based upon a price of $15.00 per share, the midpoint of the range set forth on the cover page of this prospectus.
The issuance and sales of common stock and senior preferred stock described above were exempt from the registration provisions under the Securities Act in reliance upon Section 4(2) of the Securities Act and Regulation D promulgated thereunder because the transactions were by an issuer not involving a public offering. All investors were “accredited investors” as defined in the Securities Act and the regulations promulgated thereunder. Each investor represented their intention to acquire the securities for investment only and not with a view to or for sale in connection with any distribution thereof and appropriate legends were affixed to the share certificates and other instruments issued in such transactions. Each investor either received adequate information about us or had access, through employment or other relationships, to such information.
| Item 16. | Exhibits and Financial Statement Schedules. |
| (a) | Exhibits |
The exhibit index attached hereto is incorporated herein by reference.
| (b) | Financial Statement Schedules |
No financial statement schedules are provided because the information called for is not applicable or is shown in the financial statements or notes thereto.
| Item 17. | Undertakings. |
(a) The undersigned registrant hereby undertakes to provide to the underwriters at the closing specified in the underwriting agreement, certificates in such denominations and registered in such names as required by the underwriters to permit prompt delivery to each purchaser.
(b) Insofar as indemnification for liabilities arising under the Securities Act of 1933 may be permitted to directors, officers and controlling persons of the registrant pursuant to the provisions referenced in Item 14 of this registration statement or otherwise, the registrant has been advised that in the opinion of the Securities and Exchange Commission such indemnification is against public policy as expressed in the Securities Act and is, therefore, unenforceable. In the event that a claim for indemnification against such liabilities (other than the payment by the registrant of expenses incurred or paid by a director, officer or controlling
II-4
Table of Contents
person of the registrant in the successful defense of any action, suit or proceeding) is asserted by such director, officer or controlling person in connection with the securities being registered hereunder, the registrant will, unless in the opinion of its counsel the matter has been settled by controlling precedent, submit to a court of appropriate jurisdiction the question whether such indemnification by it is against public policy as expressed in the Securities Act and will be governed by the final adjudication of such issue.
(c) The undersigned registrant hereby undertakes that:
(1) For purposes of determining any liability under the Securities Act of 1933, the information omitted from the form of prospectus filed as part of this registration statement in reliance upon Rule 430A and contained in the form of prospectus filed by the registrant pursuant to Rule 424(b)(1) or (4) or 497(h) under the Securities Act shall be deemed to be part of this registration statement as of the time it was declared effective; and
(2) For the purpose of determining any liability under the Securities Act of 1933, each post-effective amendment that contains a form of prospectus shall be deemed to be a new registration statement relating to the securities offered therein, and the offering of such securities at the time shall be deemed to be the initial bona fide offering thereof.
II-5
Table of Contents
SIGNATURES
Pursuant to the requirements of the Securities Act, the registrant has duly caused this Amendment No. 2 to the registration statement to be signed on its behalf by the undersigned, thereunto duly authorized, in Alpharetta, Georgia on October 21, 2009.
| HEALTHPORT, INC. | ||
| By: | /s/ Michael J. Labedz | |
| Name: | Michael J. Labedz | |
| Title: | President and Chief Executive Officer | |
Pursuant to the requirements of the Securities Act of 1933, this Amendment No. 2 to the registration statement has been signed on October 21, 2009, by the following persons in the capacities indicated.
| Signature |
Title |
Date | ||
| * Patrick J. Haynes, III |
Chairman |
October 21, 2009 | ||
| /s/ Michael J. Labedz Michael J. Labedz |
President, Chief Executive Officer and Director (principal executive officer) |
October 21, 2009 | ||
| /s/ Brian M. Grazzini Brian M. Grazzini |
Chief Financial Officer (principal financial officer) |
October 21, 2009 | ||
| * Lori Reel |
Chief Accounting Officer (principal accounting officer) |
October 21, 2009 | ||
| * Erik Brooks |
Director |
October 21, 2009 | ||
| * Jay Grossman |
Director |
October 21, 2009 | ||
| * Hilary K. Grove |
Director |
October 21, 2009 | ||
| *By: | /s/ Brian M. Grazzini | |
| Brian M. Grazzini, as Attorney-in-Fact | ||
II-6
Table of Contents
EXHIBIT INDEX
| Exhibit |
Description | |
| 1.1* | Form of Underwriting Agreement. | |
| 2.1† | Stock Purchase Agreement, dated December 31, 2006, between Blue Cross and Blue Shield of South Carolina and CT Technologies Holdings, LLC. | |
| 2.2† | Purchase Agreement, dated May 15, 2007, among CT Technologies Holdings, LLC , Smart Document Solutions, LLC, Smart Imaging Holdings, Inc., the Stockholders of Smart Holdings Corp., and Arcapita Inc. | |
| 2.3† | Merger Agreement, dated August 4, 2008, among HealthPort Technologies, LLC, ChartOne Acquisition Corp., and ChartOne, Inc. | |
| 3.1* | Form of Amended and Restated Certificate of Incorporation of HealthPort, Inc. | |
| 3.2* | Form of By-laws of HealthPort, Inc. | |
| 3.3† | Amended and Restated Limited Liability Company Agreement of CT Technologies Holdings LLC, dated as of September 22, 2008. | |
| 4.1* | Specimen Common Stock Certificate. | |
| 4.2 | Amended and Restated Registration Rights Agreement, dated September 22, 2008, among CT Technologies Holdings, LLC and its Members named therein. | |
| 4.3† | Amended and Restated Securities Purchase Agreement, dated September 22, 2008, among CT Technologies Holdings, LLC, ABRY Senior Equity II, L.P., ABRY Senior Equity II-A, L.P., ABRY Senior Equity Co-Investment Fund, L.P. and Ares Capital Corporation. | |
| 4.4† | Investor Securities Purchase Agreement, dated September 22, 2008, among CT Technologies Holdings, LLC and the Investors named therein. | |
| 4.5† | Investor Securities Purchase Agreement, dated June 15, 2007, among CT Technologies Holdings, LLC and the Investors named therein. | |
| 4.6† | Investor Securities Purchase Agreement, dated December 29, 2006, among CT Technologies Holdings, LLC and the Investors named therein. | |
| 4.7† | Amended and Restated Members Agreement, dated September 22, 2008, between CT Technologies Holdings, LLC and the Members named therein. | |
| 5.1 | Form of Opinion of Kirkland & Ellis LLP. | |
| 10.1* | Form of HealthPort, Inc. 2009 Omnibus Incentive Plan.+ | |
| 10.2† | Executive Employment Agreement, dated as of December 29, 2006, by and among Companion Technologies Corporation and Patrick J. Haynes, III.+ | |
| 10.3† | First Amendment to Employment Agreement with Patrick J. Haynes, III.+ | |
| 10.4† | Employment Agreement, dated as of January 1, 2007, between Smart Document Solutions, LLC and Peter A. Schmitt.+ | |
| 10.5† | Employment Agreement, dated as of September 12, 2007, between Smart Document Solutions, LLC and Frank Murphy.+ | |
| 10.6† | Employment Agreement, dated as of March 3, 2008, between HealthPort Technologies, LLC and Brian M. Grazzini.+ | |
| 10.7† | Amendment No. 1, dated as of December 30, 2008, to Employment Agreement, dated as of March 3, 2008, between HealthPort Technologies, LLC and Brian M. Grazzini.+ | |
| 10.8† | Employment Agreement, dated as of December 29, 2006, between Companion Technologies Corporation and Michael J. Labedz. + | |
| 10.9† | Amendment No. 1, dated as of December 30, 2008, to Employment Agreement, dated as of December 29, 2006, between Companion Technologies Corporation and Michael J. Labedz. + |
Table of Contents
| Exhibit |
Description | |
| 10.10† | Employment Agreement, dated as of January 15, 2007, between Companion Technologies Corporation and William V.B. Webb.+ | |
| 10.11† | Amendment No. 1, dated as of December 23, 2008, to Employment Agreement, dated as of January 15, 2007, between Companion Technologies Corporation and William V.B. Webb. + | |
| 10.12† | Employment Agreement, dated as of January 5, 2009, between HealthPort Technologies, LLC and William Matits.+ | |
| 10.13† | Employment Agreement, dated as of September 22, 2008, between HealthPort Technologies, LLC and Steve Roberts.+ | |
| 10.14† | Credit Agreement, dated as of September 22, 2008, among CT Technologies Intermediate Holdings, Inc., the other credit parties signatory thereto, the several lenders from time to time parties thereto, General Electric Capital Corporation, as Agent and Collateral Agent, Newstar Financial, Inc., as Co-Lead Arranger, Syndication Agent and Joint Bookrunner, The Governor and Company of the Bank of Ireland, Maranon Capital L.P. and Ares Capital Corporation, each as a Co-Documentation Agent and GE Capital Markets, Inc., as Co-Lead Arrange and Joint Bookrunner. | |
| 10.15† | Form of Incentive Share Purchase Agreement for executive officers and directors.+ | |
| 10.16* | Form of Restricted Stock Agreement.+ | |
| 10.17† | HealthPort Technologies, LLC Deferred Compensation Plan, as amended and restated, effective as of January 1, 2008.+ | |
| 10.18† | Note Purchase Agreement, dated as of September 22, 2008, among CT Technologies Intermediate Holdings, Inc., the Guarantors named therein and the Purchasers listed on the signature page thereto. | |
| 10.19† | Assignment and Assumption of Lease, dated as of March 20, 2009, between John A. Smart and Pam Smart, not individually, but as Trustees of the John and Pam Smart Family Trust and Bluegrass Valley, LLC, to the Lease Agreement, dated as of August 1, 2008, between John A. Smart and Pam Smart, not individually, but as Trustees of the John and Pam Smart Family Trust and HealthPort Technologies, LLC. | |
| 10.20* | Form of Transition Services Agreement by and between Thurston Group, LLC and HealthPort Technologies, LLC. | |
| 10.21* | Consulting Agreement by and between HealthPort, Inc. and Haynes, LLC. | |
| 10.22* | Form of Non-Qualified Stock Option Agreement.+ | |
| 10.23* | Form of Consulting Agreement by and between HealthPort, Inc. and Patrick J. Haynes, III. | |
| 10.24* | Form of Senior Preferred Stock Investor Rights Agreement, by and among CT Technologies Holdings, LLC, HealthPort, Inc., ABRY Senior Equity II, L.P., ABRY Senior Equity II-A, L.P., ABRY Senior Equity Co-Investment Fund, L.P. and Ares Capital Corporation. | |
| 21.1* | List of subsidiaries of HealthPort, Inc. | |
| 23.1 | Consent of Ernst & Young LLP, independent registered public accounting firm. | |
| 23.2 | Consent of Derrick, Stubbs & Stith, L.L.P., independent registered public accounting firm. | |
| 23.3 | Consent of PricewaterhouseCoopers LLP, independent registered public accounting firm. | |
| 23.4 | Consent of Ernst & Young LLP, independent registered public accounting firm. | |
| 23.5* | Consent of Kirkland & Ellis LLP (included in Exhibit 5.1). | |
| 24.1† | Powers of Attorney. | |
| 99.1 | Consent of Director Nominee. | |
| 99.2 | Consent of Director Nominee. | |
| * | To be filed by amendment. |
| + | Indicates a management contract or compensatory plan or arrangement. |
| † | Previously filed. |