Attached files
| file | filename |
|---|---|
| 8-K - VIRGIN MEDIA INC. | tp8k_virginmedia.htm |
| EX-99.4 - VIRGIN MEDIA INC. | tp8kex99_4.htm |
| EX-99.2 - VIRGIN MEDIA INC. | tp8kex99_2.htm |
| EX-99.1 - VIRGIN MEDIA INC. | tp8kex99_1.htm |
Exhibit 99.3

Amendment request
Lender presentation
October 20, 2009

Forward-looking statements
“Safe Harbor” Statement under the Private Securities Litigation Reform Act of
1995
Various statements contained in this document constitute “forward‑looking statements” as that term is defined under the Private
Securities
Litigation Reform Act of 1995. Words like “believe,” “anticipate,” “should,” “intend,” “plan,” “will,” “expects,” “estimates,” “projects,” “positioned,”
“strategy,” and similar expressions identify these forward‑looking statements, which involve known and unknown risks, uncertainties and other
factors that may cause our actual results, performance or achievements or industry results to be materially different from those contemplated,
projected, forecasted, estimated or budgeted, whether expressed or implied, by these forward‑looking statements. These factors, among others,
include: (1) the ability to compete with a range of other communications and content providers; (2) the ability to manage customer churn; (3) the
ability to maintain and upgrade our networks in a cost-effective and timely manner; (4) the ability to implement our restructuring plan successfully
and realize the anticipated benefits; (5) the general deterioration in economic conditions; (6) the continued right to use the Virgin name and logo;
(7) possible losses in revenues due to systems failures; (8) the ability to provide attractive programming at a reasonable cost; (9) the ability to
control unauthorized access to our network; (10) the effect of technological changes on our businesses; (11) the reliance on single-source
suppliers for some equipment, software and services and third party distributors of our mobile services; (12) currency and interest rate fluctuations;
(13) the ability to fund debt service obligations through operating cash flow and refinance our debt obligations; (14) the ability to obtain additional
financing in the future; (15) the ability to comply with restrictive covenants in our indebtedness agreements; and (16) the extent to which our future
cash flow will be sufficient to cover our fixed charges.
These and other factors are discussed in more detail under “Risk Factors” and elsewhere in Virgin Media’s Form 10-K as filed with the SEC
February 26, 2009 and revised by our current report on Form 8-K as filed with the SEC on May 27, 2009, our Form 10-Q as filed with the SEC on
May 6, 2009 and our Form 10-Q as filed with the SEC on August 7, 2009. We assume no obligation to update our forward-looking statements to
reflect actual results, changes in assumptions or changes in factors affecting these statements.
Adjustment
Prior period results have been adjusted to reflect the treatment of our former sit-up business as discontinued operations and the reorganization
of
our reporting segments.
our reporting segments.
2

3
Agenda
• Business overview
• Trading performance and financing strategy
• Amendment request
• Q&A
Today’s speakers
Neil Berkett
CEO
Rick Martin
Treasurer

Our Journey
2006-2007 2007-2008 2008-2009 2009+
Consolidate
Fix Fundamentals
Differentiate Products
Grow
• Extract cable merger
synergies
synergies
• Reduce headcount
• Single cable billing and
management system
management system
• Harmonise processes
across Cable
across Cable
• Launch UK’s first quad
play offering
play offering
• Reduce churn
• Address back book issue
• Improve call answer rates
• Reduce fault rates
• Embed NPV focus across
organisation
organisation
• Start next phase of cost
savings program to align
operating structure with
strategy => £120m pa
savings by 2012
savings program to align
operating structure with
strategy => £120m pa
savings by 2012
Broadband
• Docsis 3.0 rollout
• Speed upgrades
• Value added services
Television
• Enhance VOD with BBC
iPlayer & Music
iPlayer & Music
• Free HD & ESPN from XL
TV tier
TV tier
Mobile
• Mobile broadband
• Market leading data rate
• Network expansion
• Retail
• Exploit network
advantage: more VAS,
NGTV, VOD adverts
advantage: more VAS,
NGTV, VOD adverts
• Select content
investment: HD
investment: HD
• Price rises => ARPU
growth
growth
• National
• Grow business data
4

Our priorities
Growth strategy focused on leveraging our network advantage
Continually improve product quality and reliability
Develop differentiated products to underpin value & ARPU growth
Enhance understanding of the market and our customers
Grow customer advocacy
Exploit operational leverage
On track for £120m annual P&L savings by 2012
Addressing our capital structure
Strategic
Operational
Financial
Lead next
generation
broadband
generation
broadband
Lead on-
demand TV
revolution
demand TV
revolution
Leverage mobile
as the 3rd screen
in the home
as the 3rd screen
in the home
Grow revenue and ARPU whilst keeping churn low
Address imperfections in the Regulatory Framework
Regulatory
Grow Business
data
data
5

Strong performance underscores
defensive characteristics
defensive characteristics
6
Triple play (%) and RGU(1)/customer
On-net RGUs(1) (‘000)
Monthly on-net churn (%)
1 RGUs include on-net broadband, TV and phone; 2 On-net ARPU for Q3-06 is shown before adjustment for disposal of sit-up

Broadband tier mix improving
• Investment in Docsis 3.0
– Improves quality of service
– Differentiates Virgin Media from competition
– Improves tier mix and revenue growth
7

Enriched TV content and capability
– VOD reach 55% at Q2-09 with an average of
32 views per user per month
• Significant V+ DVR growth potential from 19% penetration at Q2-09
• Content investments focused on HD
– Announced six new HD channels available free
to XL customers
• 4HD, ESPN HD, LIVING, FX, MTV Networks, National
Geographic
– Plan to launch more HD channels
– Added HD BBC iPlayer
• ESPN sports channels free to XL customers
Monthly VOD views (m)
V+ base (000s)
TV net adds
8

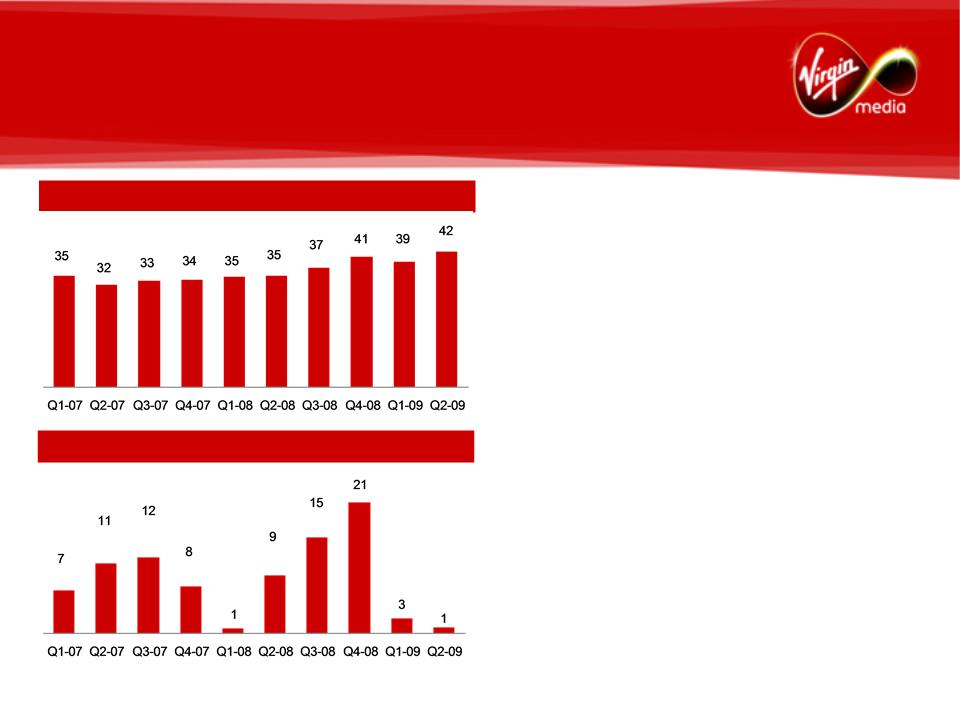
Continued success in contract mobile
• Contract customers up 60% in Q2-09 on Q2-08; increased market share
• Cross-sell and contract bundle opportunity
– 609k cable homes with at least one registered
mobile; 450k quad-play customers (at Q2-09)
– Churn profile improves for bundled customers
driving increased value
– Mobile contract churn in cable homes is significantly
lower than in non-cable homes
• Mix shift from prepay to contract improves value of mobile base
• New Mobile portal; Convergence opportunities
Contract customers (‘000s)
Monthly bundle churn Q2-09 (%)
9
Content overview
VMtv revenue (£m)¹
1 Before intersegment eliminations
2 Source: BARB figures for entertainment pay channels (excluding sports) year to date , weeks 1-38 2009, ranked by share of Pay TV adults viewing
Cash from UKTV (£m)
• VMtv channels include Virgin1, LIVING and Bravo
• UKTV: a 50/50 JV with BBC Worldwide with
channels including Dave and G.O.L.D. (not
consolidated)
channels including Dave and G.O.L.D. (not
consolidated)
• Virgin1 presence on Freeview to promote and cross-
sell pay-TV offerings and to increase share of ad-
sale revenue market
sell pay-TV offerings and to increase share of ad-
sale revenue market
• Channel portfolio demonstrated strong performance
– LIVING is no.2 payTV entertainment channel2
• New Sky carriage agreement for VMtv channels
concluded in November 2008
concluded in November 2008
• Additional cash contribution from UKTV
– £46m in 2008 (£38m in 2007)
10

Business services overview
Business revenue mix (£m/% of total)
• Network passes within 40m of 52% of all UK
businesses and could serve over 75% of all regional /
local authorities
businesses and could serve over 75% of all regional /
local authorities
• Targets medium-sized corporates and public sector
organizations in both retail and wholesale markets
organizations in both retail and wholesale markets
• Offering multi-site, managed network data solutions
tailored to the specific requirements of customers
tailored to the specific requirements of customers
• Strategic shift from lower margin voice to higher
margin data services
margin data services
• Continued growth in high-margin Retail Data product
lines
lines
– Data growth products include IPVPN, Ethernet
and internet services
and internet services
163
156
160
163
161
157
153
155
150
143
11

Positive policy and regulatory
developments
developments
• Government’s Digital Britain report sets framework for accelerated network
investment
investment
– Confirmed that no case for regulation of cable
network at present
– New 2Mb “universal service commitment”
and next generation access fund both
potentially provide opportunity to accelerate our network extension programme
potentially provide opportunity to accelerate our network extension programme
• Working closely with the Government on its proposals to tackle illegal file-sharing
• Significant progress in Ofcom’s investigation into pay TV
– Wholesale regime for Sky premium channels
would significantly enhance our
ability to compete
ability to compete
– Indication by Ofcom to address Sky’s
underlying advantage in the acquisition of
Premier League football and Hollywood movie rights
Premier League football and Hollywood movie rights
12
Strengthened management team
13
Bryan H. Hall
General Counsel
Neil Berkett
CEO
Andrew Barron
Chief Customer and
Operations Officer
Operations Officer
Mark Schweitzer
Chief Commercial Officer
Jeff Wollen
Executive Director of Change
Martin Wyke
Chief Technology and
Information Officer
Information Officer
1 Eamonn O'Hare will assume CFO responsibilities in November 2009
Eamonn O’Hare(1)
CFO
Elisa Nardi
Managing Director People

Investment highlights
• Disciplined focus on execution and improving fundamentals
• Superior network provides significant product and economic advantage now
and in future
and in future
– Superior 10/20/50Mb broadband offering
– Leading position in Video-On-Demand
– Leveraging mobile to cross-sell mobile contracts
into cable base
– Positioned to grow business data
• New operating model for a customer focused organisation
• Strong Free Cash Flow and deleveraging
• Continued proactive management of capital structure
14

15
Trading performance and financing strategy

Overview of financials
16
1 See Appendices for the calculation of LTM (last twelve months) data, some of which involve non-GAAP financial measures 2Exclusive
of depreciation. 3 Revenue less operating costs divided by revenue. 4 OCF is operating income
before depreciation, amortization, goodwill and intangible asset impairments and restructuring and other charges and is a non-GAAP financial measure. 5 OCF divided by revenue and is a non-GAAP financial measure. 6 Capex defined as
purchase of fixed and intangible assets, which is a GAAP financial measure 7 Free Cash Flow (FCF) is operating income before depreciation, amortization, goodwill and intangible asset impairments and restructuring and other charges
(OCF) reduced by purchase of fixed and intangible assets and net interest expense and is a non-GAAP financial measure. See Appendices for reconciliations of non-GAAP financial measures to their nearest GAAP equivalents.
OCF Margin(5)
OCF(4)
SG&A
Operating costs(2)
Revenue
Gross Margin(3)
35.7%
334
197
405
936
Q2-09
56.7%
85
33.3%
312
210
414
936
Q1-09
55.8%
62
35.5%
334
209
397
940
(£m)
Q2-08
57.8%
111
Free Cash Flow(7)
34.5%
1,302
828
1,647
3,777
FY-08
56.4%
351
34.3%
1,290
823
1,648
3,761
LTM
Jun-09(1)
Jun-09(1)
56.2%
306
Capex(6)
148
144
108
478
539
(adjusted)
(adjusted)
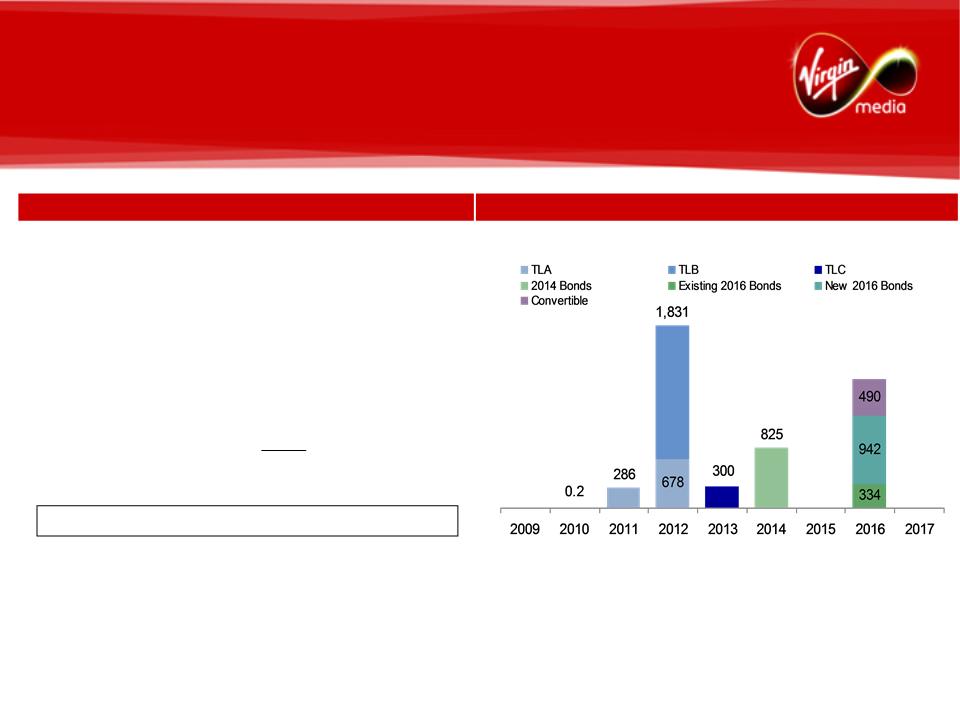
Proactive management of our debt
Note: The repayment schedule is based on spot rates as at end Q2-09 of £/$1.6452 and £/€1.1734
• Stable outlooks from all rating agencies: Ba3 (Moody’s), B+ (S&P), BB- (Fitch)
• Recent refinancing pushes out near-term maturities and improves financial flexibility
• Average cost of debt pro forma for recent bond issue is 7.1%
17
Repayment schedule after issue of 2016 bonds in July (£m)
Voluntary prepayment 120 Sep-06
TL A repayment 863 Apr-07
Excess cashflow 74 May-07
Voluntary prepayment 200 Dec-07
Convertible/cash on hand 504 Apr-08
Bank amendment - Nov-08
Voluntary prepayment 300 Dec-08
New 2016 Bonds/cash on hand 1,012 Jun/Jul-09
3,073
New TL B raised (890) Apr-07
Net bank prepayments 2,183
Bank prepayment Amount (£m) Date

18
VMED Pro forma capitalisation
|
|
Size (£m)(1) |
LQA leverage multiple(2) |
Maturity |
Credit rating |
|
TL A-A1 |
286 |
|
Mar-11 |
Ba2/BB |
|
TL A2-A3 |
678 |
|
Jun-12 |
Ba2/BB |
|
TL B1-B12 |
1,831 |
|
Sep-12 |
Ba2/BB |
|
TLC |
300 |
|
Mar-13 |
B1/BB- |
|
Senior secured debt(3) |
3,094 |
2.3x |
|
|
|
Cash |
(205) |
(0.2x) |
|
|
|
Net senior secured debt(4) |
2,889 |
2.2x |
|
|
|
Capital leases and other |
168 |
|
|
|
|
2014 Senior notes |
825 |
0.6x |
Apr-14 |
B2/B |
|
2016 Senior notes |
1,277 |
1.0x |
Aug-16 |
B2/B |
|
Net total debt (Bank group)(4) |
5,159 |
3.9x |
|
|
|
Convertible bond |
490 |
0.4x |
Nov-16 |
B- |
|
Net total group debt(4) |
5,649 |
4.2x |
|
|
1 Pro forma for the $600m 2016 senior notes offering in Jul-09 and subsequent prepayment of bank debt using the proceeds together with cash on hand. The exchange rates used
are as at end Q2-09 and were £/$1.6452 & £/ €1.1734
2 LQA leverage multiple, as shown, is a ratio calculated by dividing the relevant debt measure by the last quarter annualised (LQA) OCF. LQA OCF as shown is OCF for Q2 2009 multiplied
by four. LQA leverage multiple and OCF are non-
GAAP financial measures. See the Appendices for reconciliations of non-GAAP financial measures to their nearest GAAP equivalents
GAAP financial measures. See the Appendices for reconciliations of non-GAAP financial measures to their nearest GAAP equivalents
3 Excludes £27.7m revolving credit facility due Mar-11 and £72.3m revolving credit facility due Jun-12
4 Net senior secured debt, Net total debt (Bank group) and Net total group debt are non-GAAP financial measures. See the Appendices for reconciliations of non-GAAP financial
measures to their nearest GAAP equivalents

Deleveraging / refinancing strategy
• Our refinancing strategy envisions further reductions to the size of the senior credit
facilities, possible further diversification of funding sources to include senior secured
notes, extension of existing senior note maturities, and the ultimate refinancing of the
senior credit facility well in advance of 2012 maturities
facilities, possible further diversification of funding sources to include senior secured
notes, extension of existing senior note maturities, and the ultimate refinancing of the
senior credit facility well in advance of 2012 maturities
• Key steps of our refinancing strategy:
– Oct/Nov 2008: Bank amendment to extend SFA
maturities by ca. 1 year
– May/Jul 2009: $1.6bn senior note issuances
to reduce SFA
– Oct 2009: Bank amendment to allow for further
SFA reductions through the
issuance of senior secured bonds
issuance of senior secured bonds
– Through 2010: Address 2014 notes
– 2010/11: Full refinancing of SFA
19

Rationale for amendment
• No requirement nor request for covenant/margin relief, nor reduction/deferral of
amortisation
amortisation
• Seek to remain proactive, and ensure comprehensive suite of options to continue strong
track-record in optimisation of long-term capital structure
track-record in optimisation of long-term capital structure
– Potentially access senior secured bond market
in cost-effective fashion, thus
reducing quantum of bank debt refinancing required
reducing quantum of bank debt refinancing required
– Facilitate smoothing of amortisation profile
– Enhance swap capacity, to optimise all-in
cost of hedged debt
20

21
Amendment request

22
Summary of requests/timing
• Virgin Media is seeking the consent of its senior lenders to:
A. Allow the issuance of senior secured bonds (“SSBs”) pari
passu to SFA debt
– 100% of the net proceeds raised from SSBs must
be used to prepay SFA debt
– Bullet maturity no earlier than March 2014
B. Update the hedging related provisions in the intercreditor
agreements to bring
them in line with current market standard and hedge counterparty expectations
them in line with current market standard and hedge counterparty expectations
C. Make certain clarifying and technical amendments
• All amendments require the consent of majority senior lenders (66 2/3%)
– Amendment is supported by the Company’s
top 10 relationship banks
• Consenting lenders receive a 25bps amendment fee if they respond by 30 October
2009
2009

23
Amendment timetable
|
Date |
Description |
|
20 October |
Lender conference call |
|
21 October |
Upload draft documentation to Intralinks |
|
30 October |
Final deadline for lender response |
|
2 November |
Amendment becomes effective |
|
5 November |
Agent pays amendment fees to consenting lenders |
19
1
5
26
15
16
17
18
14
13
22
23
24
25
21
20
29
28
27
8
9
10
11
7
6
2
3
4
30
31
October
S
W
T
F
S
T
M
12
26
November
S
W
T
F
S
T
M
2
9
23
12
13
14
15
10
19
20
21
22
18
17
25
24
5
6
7
8
4
3
1
16
27
28
29
30
11
Public holidays

24
Q&A

25
Appendices

Non-GAAP measures
Virgin Media uses non-GAAP financial measures with a view to providing investors with a better understanding of the
operating results and underlying trends to measure past and future performance and liquidity.
operating results and underlying trends to measure past and future performance and liquidity.
We evaluate operating performance based on several non-GAAP financial measures, including (i) operating income
before depreciation, amortization, goodwill and intangible asset impairments and restructuring and other charges
(OCF), (ii) net total group debt, which we also refer to as net debt, and (iii) OCF less purchases of fixed and intangible
assets and net interest expense (FCF or Free Cash Flow), as we believe these are important measures of the
operational strength of our business and our liquidity. Since these measures are not calculated in accordance with
GAAP, they should not be considered as substitutes for operating income (loss), long-term debt (net of current portion),
and net cash provided by operating activities, respectively.
This presentation also includes, as additional non-GAAP financial measures (i) net senior secured debt, (ii) net total
debt (Bank group), and (iii) net total group debt because we believe that these measures potentially are of interest to
our senior lenders in assessing our financing obligations. Since these measures are not calculated in accordance with
GAAP they should not be considered as a substitute for long-term debt (net of current portion).
This presentation further includes another non-GAAP financial measure, net LQA leverage multiple, which is the ratio
of the relevant debt measure to the last quarter annualised (LQA) OCF. We believe that this ratio is potentially of
interest to our senior lenders in assessing our cash flows and liquidity. The amounts used in this calculation should not
be considered a substitute for measures calculated in accordance with GAAP, as discussed above.
26

27
Operating income before depreciation, amortization,
goodwill and intangible asset impairments and
restructuring and other charges (OCF)
goodwill and intangible asset impairments and
restructuring and other charges (OCF)
Operating income before depreciation, amortization, goodwill and intangible asset impairments and
restructuring and other charges, which we refer to as OCF, is not a financial measure recognized
under GAAP. OCF represents our operating income before depreciation, amortization, goodwill and
intangible asset impairments and restructuring and other charges. Our management, including our
chief executive officer, consider OCF as an important indicator of our operational strength and
performance. OCF excludes the impact of costs and expenses that do not directly affect our cash
flows. Restructuring and other charges are also excluded from OCF as management believes they are
not characteristic of our underlying business operations. OCF is most directly comparable to the
GAAP financial measure operating income (loss). Some of the significant limitations associated with
the use of OCF as compared to operating income (loss) are that OCF does not consider the amount of
required reinvestment in depreciable fixed assets and ignores the impact on our results of operations
of items that management believes are not characteristic of our underlying business operations.
We believe OCF is helpful for understanding our performance and assessing our prospects for the
future, and that it provides useful supplemental information to investors. In particular, this non-GAAP
financial measure reflects an additional way of viewing aspects of our operations that, when viewed
with our GAAP results and the reconciliation to operating income (loss) shown below, provides a more
complete understanding of factors and trends affecting our business. Because non-GAAP financial
measures are not standardized, it may not be possible to compare our OCF with other companies'
non-GAAP financial measures that have the same or similar names.

28
Net total group debt, Net senior secured
debt and Net total debt (Bank group)
debt and Net total debt (Bank group)
Net total group debt is defined as long-term debt inclusive of current portion, less cash and cash equivalents. Net
senior secured debt is defined as our long-term debt related to our senior credit facility inclusive of current portion, less
cash and cash equivalents. Net total debt (Bank group) is defined as our long term debt related to our senior credit
facility inclusive of current portion, senior notes, capital leases and other obligations, less cash and cash equivalents.
Our management, including our chief operating decision-maker, consider these measures as potentially of interest to
our senior lenders in assessing our financing obligations.
Net total group debt, net senior secured debt and net total debt (Bank group) are not financial measures recognised
under GAAP. These measures are most directly comparable to the GAAP financial measure, long term debt, net of
current portion. The significant limitation associated with the use of net total group debt as compared to long term debt,
net of current portion is that net total group debt includes the current portion of long term debt. The significant limitation
associated with the use of net senior secured debt as compared to long term debt, net of current portion is that net
senior secured debt includes the current portion of debt and excludes our subordinated debt obligations. The significant
limitation associated with the use of net total debt (Bank group) as compared to long term debt, net of current portion is
that net total debt (Bank group) includes the current portion of debt and excludes our convertible debt obligations.
These measures also assume that all of the cash and cash equivalents are available to service debt.
We believe these measures may be helpful for understanding our debt funding obligations and provide useful
supplemental information to senior lenders. Because non-GAAP financial measures are not standardised, it may not be
possible to compare net total group debt, net senior secured debt and net total debt (Bank group) with other
companies' non-GAAP financial measures that have the same or similar names. The presentation of this supplemental
information is not meant to be considered in isolation or as a substitute for long term debt, net of current portion or
other measures of financial performance or liquidity reported in accordance with GAAP.

Free Cash Flow
We define Free Cash Flow (FCF) as operating income before depreciation, amortization, goodwill and
intangible asset impairments and restructuring and other charges (OCF) reduced by purchase of fixed and
intangible assets, as reported in our statements of cash flows, and net interest expense, as reported in our
statements of operations. Our definition of FCF excludes the impact of working capital fluctuations and
restructuring costs as defined by FAS 146. FCF is a non-GAAP financial measure. We believe the most
directly comparable financial measure recognized under GAAP is net cash provided by operating activities.
Our management, including our chief executive officer, consider FCF as a helpful measure in assessing our
liquidity and prospects for the future. We also believe FCF is useful to investors as a basis for comparing our
performance and coverage ratios with other companies in our industry. In particular, this non-GAAP financial
measure reflects an additional way of viewing aspects of our operations that, when viewed with our GAAP
results and the reconciliation to net cash provided by operating activities shown below, provides a more
complete understanding of factors and trends affecting our business. FCF should not be understood to
represent our ability to fund discretionary amounts, as we have various contractual obligations which are not
deducted to arrive at FCF. Because non-GAAP financial measures are not standardized, it may not be
possible to compare our FCF with other companies’ non-GAAP financial measures that have the same or
similar names.
The presentation of this supplemental information is not meant to be considered in isolation or as a substitute
for net cash provided by operating activities, or other measures of financial performance or liquidity reported in
accordance with GAAP.
for net cash provided by operating activities, or other measures of financial performance or liquidity reported in
accordance with GAAP.
29

30
Reconciliation of operating income before depreciation, amortization, goodwill
and intangible asset impairments and restructuring and other charges (OCF) to
GAAP operating income (loss)
and intangible asset impairments and restructuring and other charges (OCF) to
GAAP operating income (loss)
(1) LTM or last twelve months information has been derived from previously reported results.
OCF - Non-GAAP Reconciliation

31
Last Twelve Months (LTM) calculation
as at June 30, 2009
as at June 30, 2009
Note: LTM information has been derived from previously reported annual and quarterly results. For further details regarding these results, see the information on our Earnings Releases
filed on Form 8-K and on Form 10-Q on August 7, 2009
filed on Form 8-K and on Form 10-Q on August 7, 2009
32
Net total group debt, Net senior secured debt and
Net total debt (Bank group) - Non-GAAP
reconciliations
Net total debt (Bank group) - Non-GAAP
reconciliations
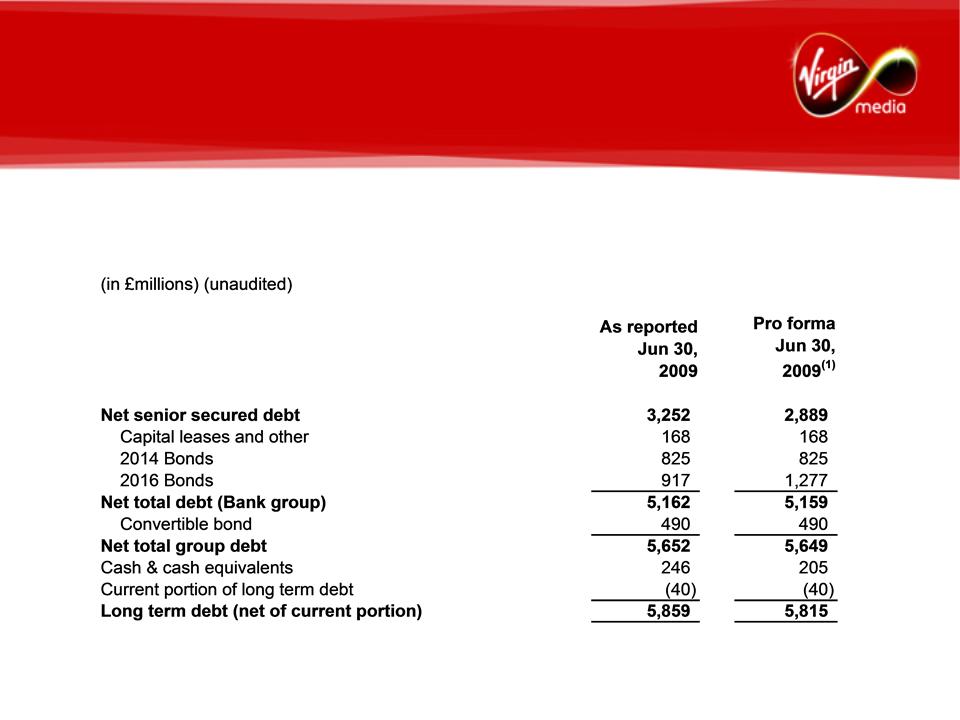
Reconciliation of net total group debt, net senior secured debt and net total debt
(bank group) to long term debt, net of current portion
(bank group) to long term debt, net of current portion
(1) Pro forma for the $600m 2016 senior notes offering in Jul-09 and subsequent prepayment of bank debt using the proceeds together with cash on hand. The exchange rates used are as
at end Q2-09 and were £/$1.6452 & £/ €1.1734
at end Q2-09 and were £/$1.6452 & £/ €1.1734

33
LQA leverage multiple - Non-GAAP
reconciliation
reconciliation
(1) Pro forma for the $600m 2016 senior notes offering in Jul-09 and subsequent prepayment of bank debt using the proceeds together with cash on hand. The exchange rates used are as
at end Q2-09 and were £/$1.6452 & £/ €1.1734
at end Q2-09 and were £/$1.6452 & £/ €1.1734

34
FCF Calculation and Non-GAAP
reconciliation
reconciliation
(1) LTM or last twelve months information has been derived from previously reported results.
Note: The line descriptions above are derived from our previously reported results. Non-cash interest includes non-cash interest and amortization of original issue discount and deferred
financing costs from our statements of cash flows. Share of net income of affiliates includes income from equity accounted investments, net of dividends received from our statements of
cash flows and share of income from equity investments from our statements of operations. Realized foreign exchange (losses)/gains includes unrealized foreign currency losses (gains)
from our statements of cash flows and foreign currency (losses) gains from our statements of operations. Realized gains/(losses) on derivatives includes unrealized (gains) losses on
derivative instruments from our statements of cash flows and gains (losses) on derivative instruments from our statements of operations. Income taxes includes income taxes from our
statements of cash flows and income tax benefit (expense) from our statements of operations.

35
Last Twelve Months (LTM)
June 30, 2009
June 30, 2009
Note: LTM information has been derived from previously reported annual and quarterly results. For further details regarding these results, see the information on our Earnings Releases
filed on Form 8-K and on Form 10-Q on August 7, 2009
filed on Form 8-K and on Form 10-Q on August 7, 2009