Attached files
| file | filename |
|---|---|
| 8-K - FORM 8-K - EL PASO CORP/DE | h68212e8vk.htm |
Exhibit 99.A
| El Paso E&P Company Haynesville Field Trip October 15, 2009 |
| 2 Cautionary Statement Regarding Forward-Looking Statements This presentation includes certain forward-looking statements and projections. The company has made every reasonable effort to ensure that the information and assumptions on which these statements and projections are based are current, reasonable, and complete. However, a variety of factors could cause actual results to differ materially from the projections, anticipated results or other expectations expressed in this presentation, including, without limitation, changes in unaudited and/or unreviewed financial information; volatility in, and access to, the capital markets; our ability to implement and achieve our objectives in our 2009 plan, including achieving our earnings and cash flow targets; the effects of any changes in accounting rules and guidance; our ability to meet production volume targets in our Exploration and Production segment; our ability to comply with the covenants in our various financing documents; our ability to obtain necessary governmental approvals for proposed pipeline and E&P projects and our ability to successfully construct and operate such projects; our ability to achieve production growth and drilling performance in the Haynesville and other production areas; actions by the credit rating agencies; the successful close of our financing transactions; our ability to close asset sales; credit and performance risk of our lenders, trading counterparties, customers, vendors and suppliers; changes in commodity prices and basis differentials for oil, natural gas, and power; our ability to obtain targeted cost savings in our businesses; general economic and weather conditions in geographic regions or markets served by the company and its affiliates, or where operations of the company and its affiliates are located, including the risk of a global recession and negative impact on natural gas demand; the uncertainties associated with governmental regulation; political and currency risks associated with international operations of the company and its affiliates; competition; and other factors described in the company's (and its affiliates') Securities and Exchange Commission filings. While the company makes these statements and projections in good faith, neither the company nor its management can guarantee that anticipated future results will be achieved. Reference must be made to those filings for additional important factors that may affect actual results. The company assumes no obligation to publicly update or revise any forward-looking statements made herein or any other forward-looking statements made by the company, whether as a result of new information, future events, or otherwise. Cautionary Note to U.S. Investors-The SEC permits oil and gas companies, in their filings with the SEC, to disclose only proved reserves that a company has demonstrated by actual production or conclusive formation tests to be economically and legally producible under existing economic and operating conditions. We use certain terms in this presentation that the SEC's guidelines strictly prohibit us from including in filings with the SEC. U.S. Investors are urged to consider closely the disclosures regarding proved reserves in this presentation and the disclosures contained in our Form 10-K for the year ended December 31, 2008, File No. 001-14365, available by writing; Investor Relations, El Paso Corporation, 1001 Louisiana St., Houston, TX 77002. You can also obtain this form from the SEC by calling 1-800-SEC-0330. Non-GAAP Financial Measures This presentation includes certain Non-GAAP financial measures as defined in the SEC's Regulation G. More information on these Non-GAAP financial measures, including EBIT, EBITDA, adjusted EBITDA, adjusted EPS, cash costs, and the required reconciliations under Regulation G, are set forth in this presentation or in the appendix hereto. El Paso defines Resource Potential or Resource Inventory as subsurface volumes of oil and natural gas the company believes may be present and eventually recoverable. The company utilizes a net, geologic risk mean to represent this estimated ultimate recoverable amount. |
| 3 Our Purpose El Paso Corporation provides natural gas and related energy products in a safe, efficient, and dependable manner |
| 4 the place to work the neighbor to have the company to own Our Vision & Values |
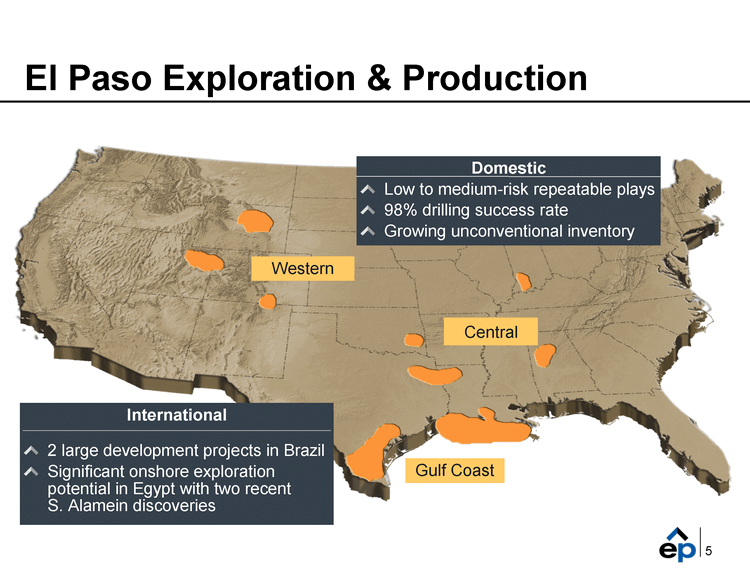
| El Paso Exploration & Production 5 Domestic Low to medium-risk repeatable plays 98% drilling success rate Growing unconventional inventory International 2 large development projects in Brazil Significant onshore exploration potential in Egypt with two recent S. Alamein discoveries Central Western Gulf Coast |
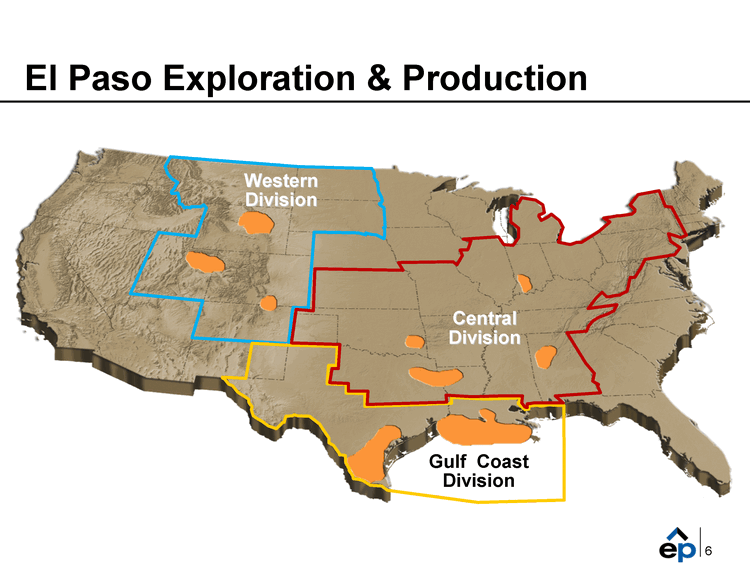
| El Paso Exploration & Production 6 Western Division Central Division Gulf Coast Division |
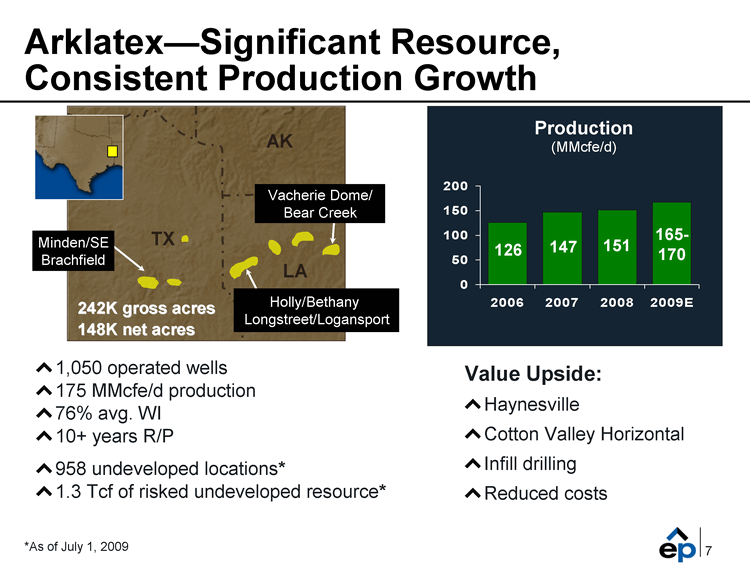
| Arklatex-Significant Resource, Consistent Production Growth Value Upside: Haynesville Cotton Valley Horizontal Infill drilling Reduced costs 1,050 operated wells 175 MMcfe/d production 76% avg. WI 10+ years R/P 958 undeveloped locations* 1.3 Tcf of risked undeveloped resource* 2006 2007 2008 2009E East 126 147 151 167 Production (MMcfe/d) 126 147 151 *As of July 1, 2009 165- 170 Minden/SE Brachfield TX AK LA Vacherie Dome/ Bear Creek Holly/Bethany Longstreet/Logansport 242K gross acres 148K net acres 7 |
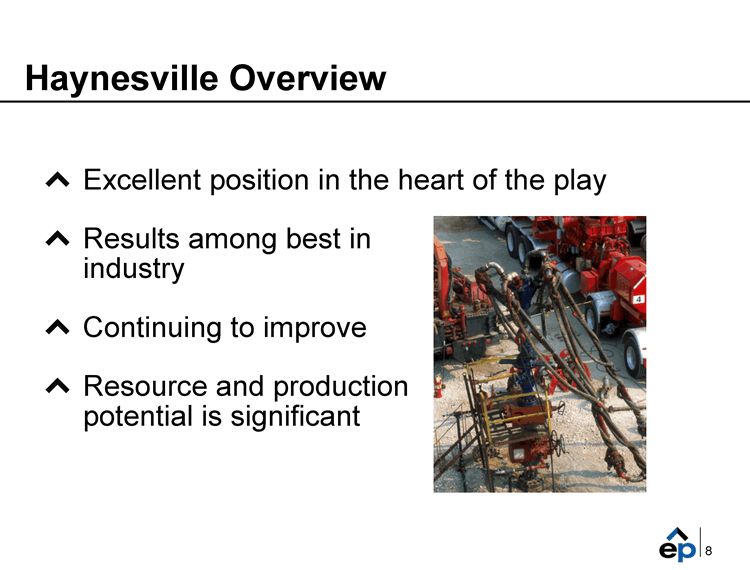
| Haynesville Overview Excellent position in the heart of the play Results among best in industry Continuing to improve Resource and production potential is significant 8 |
| Haynesville Formation Interstate Pipelines ? Exploration & Production |
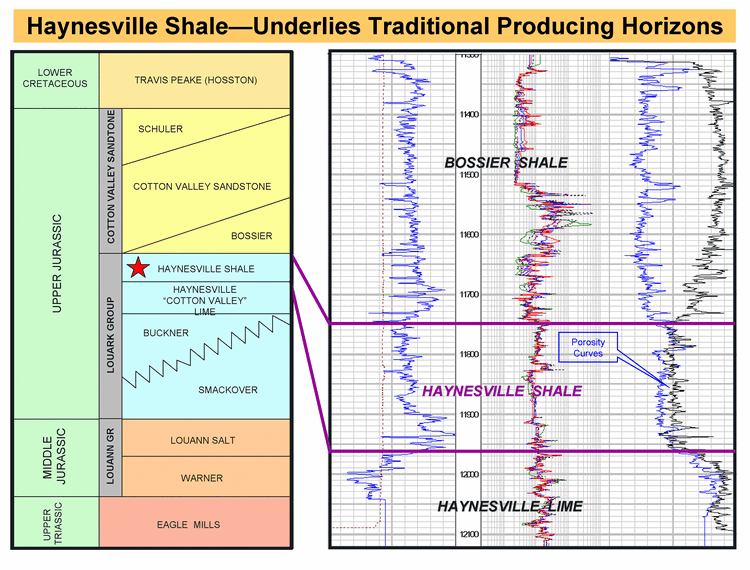
| LOWER CRETACEOUS TRAVIS PEAKE (HOSSTON) UPPER JURASSIC MIDDLE JURASSIC UPPER TRIASSIC LOUANN GR LOUARK GROUP COTTON VALLEY SANDTONE EAGLE MILLS WARNER LOUANN SALT SMACKOVER BUCKNER HAYNESVILLE "COTTON VALLEY" LIME HAYNESVILLE SHALE BOSSIER COTTON VALLEY SANDSTONE SCHULER HAYNESVILLE SHALE BOSSIER SHALE HAYNESVILLE LIME Porosity Curves Haynesville Shale-Underlies Traditional Producing Horizons |
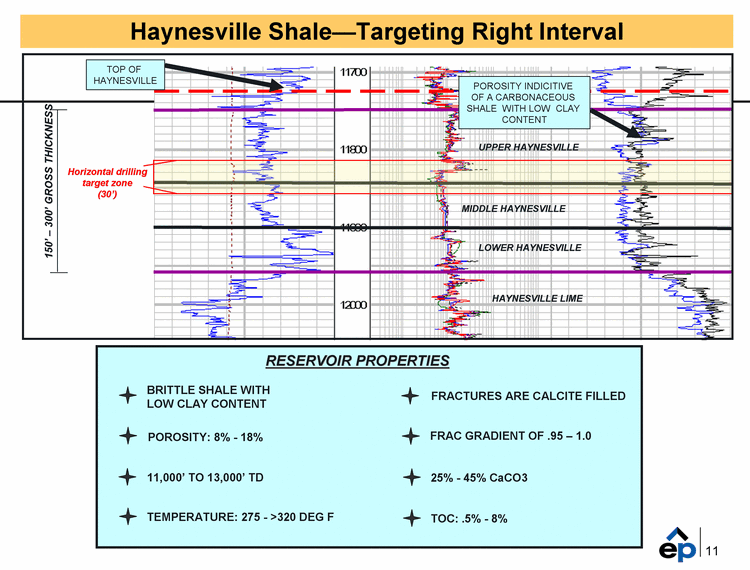
| TOP OF HAYNESVILLE UPPER HAYNESVILLE MIDDLE HAYNESVILLE LOWER HAYNESVILLE POROSITY INDICITIVE OF A CARBONACEOUS SHALE WITH LOW CLAY CONTENT HAYNESVILLE LIME RESERVOIR PROPERTIES Horizontal drilling target zone (30') 150' - 300' GROSS THICKNESS BRITTLE SHALE WITH LOW CLAY CONTENT POROSITY: 8% - 18% 11,000' TO 13,000' TD 25% - 45% CaCO3 FRACTURES ARE CALCITE FILLED FRAC GRADIENT OF .95 - 1.0 TOC: .5% - 8% TEMPERATURE: 275 - >320 DEG F Haynesville Shale-Targeting Right Interval 11 |
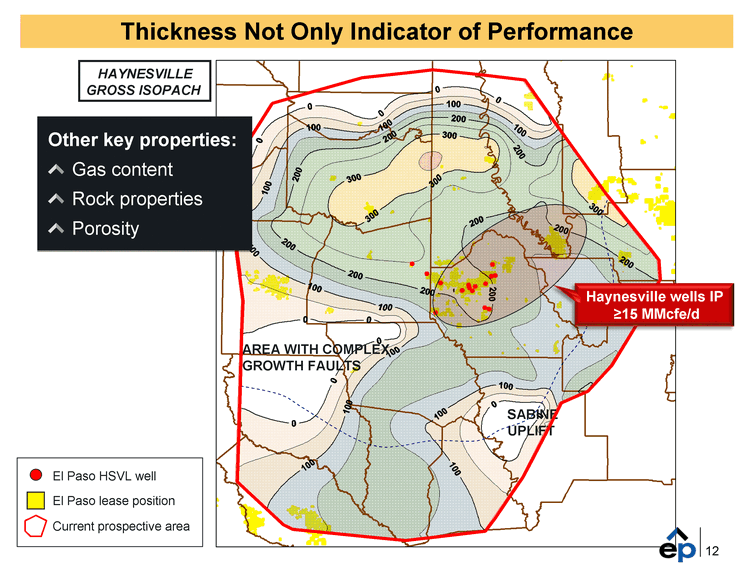
| SABINE UPLIFT AREA WITH COMPLEX GROWTH FAULTS HAYNESVILLE GROSS ISOPACH El Paso HSVL well El Paso lease position Current prospective area Other key properties: Gas content Rock properties Porosity Thickness Not Only Indicator of Performance Haynesville wells IP ^15 MMcfe/d 12 |
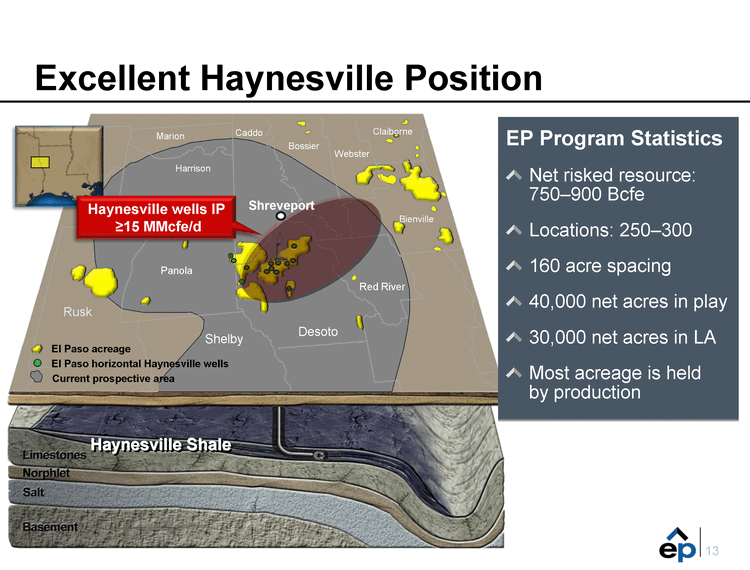
| 13 13 Excellent Haynesville Position Marion Red River Claiborne Webster Bossier Gregg Caddo Harrison Rusk Shelby Desoto Panola Bienville Haynesville Shale El Paso acreage El Paso horizontal Haynesville wells Current prospective area Haynesville wells IP ^15 MMcfe/d EP Program Statistics Net risked resource: 750-900 Bcfe Locations: 250-300 160 acre spacing 40,000 net acres in play 30,000 net acres in LA Most acreage is held by production Shreveport |
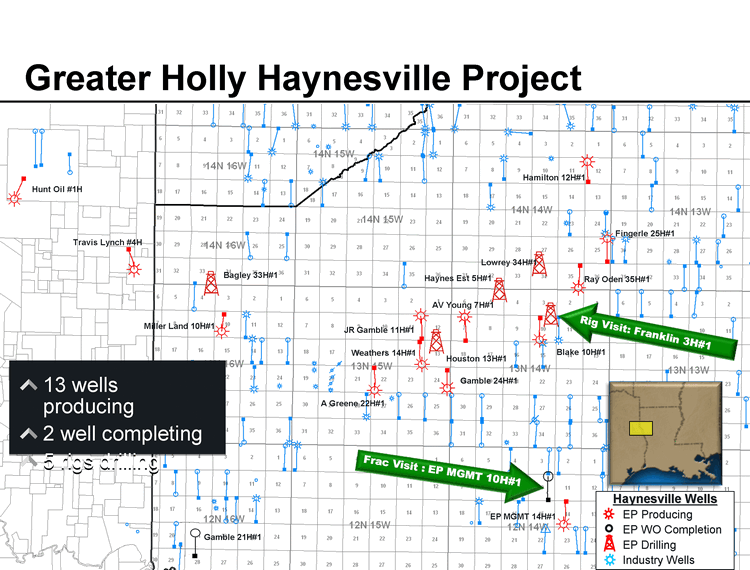
| Greater Holly Haynesville Project Haynesville Wells EP Producing EP WO Completion EP Drilling Industry Wells Hamilton 12H#1 Miller Land 10H#1 A Greene 22H#1 Gamble 24H#1 Weathers 14H#1 JR Gamble 11H#1 AV Young 7H#1 Blake 10H#1 Ray Oden 35H#1 Fingerle 25H#1 EP MGMT 14H#1 Travis Lynch #4H Gamble 21H#1 Hunt Oil #1H Lowrey 34H#1 Houston 13H#1 Haynes Est 5H#1 Bagley 33H#1 13 wells producing 2 well completing 5 rigs drilling Frac Visit : EP MGMT 10H#1 Rig Visit: Franklin 3H#1 |
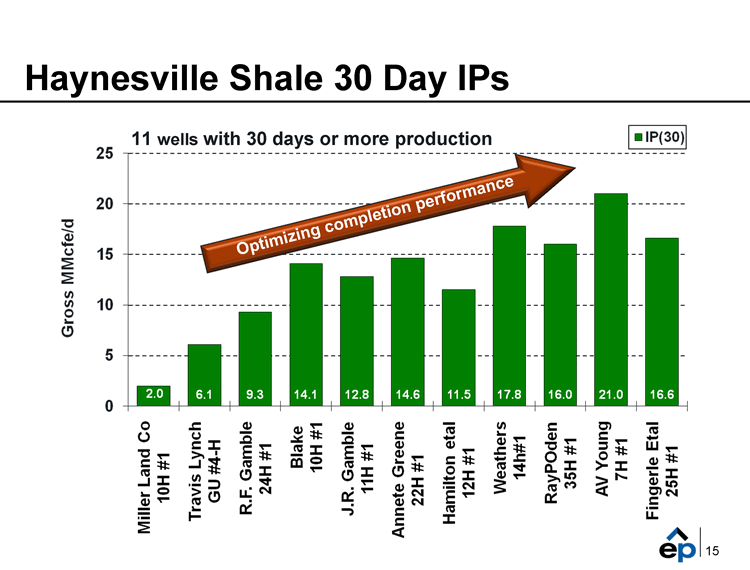
| Haynesville Shale 30 Day IPs 11 wells with 30 days or more production Optimizing completion performance 15 |
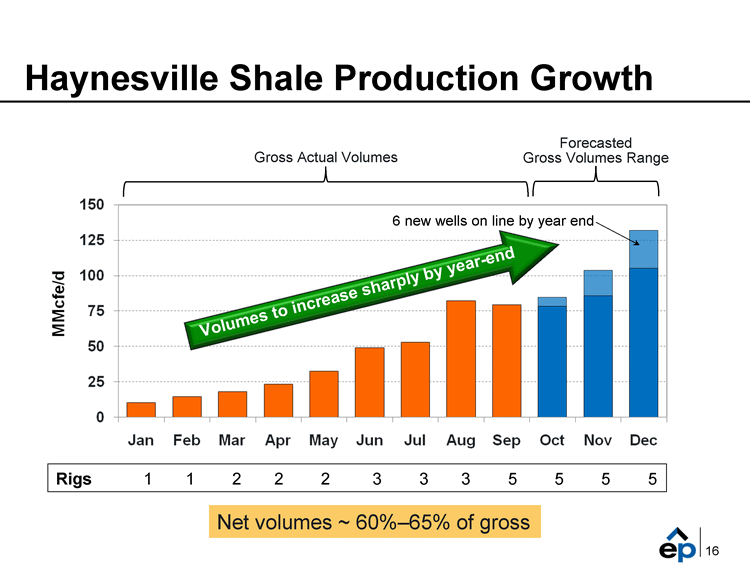
| Haynesville Shale Production Growth 16 Rigs 1 1 2 2 2 3 3 3 5 5 5 5 Gross Actual Volumes Forecasted Gross Volumes Range 6 new wells on line by year end Net volumes ~ 60%-65% of gross Volumes to increase sharply by year-end |
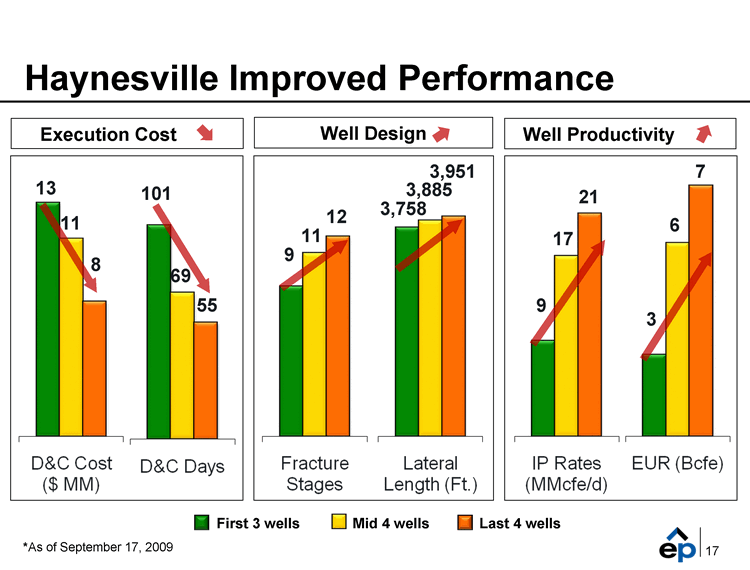
| 17 Haynesville Improved Performance 17 First 3 wells Mid 4 wells Last 4 wells Execution Cost Well Design Well Productivity 69 55 101 13 11 8 9 11 3,758 3,885 3,951 9 17 21 3 6 7 *As of September 17, 2009 12 |
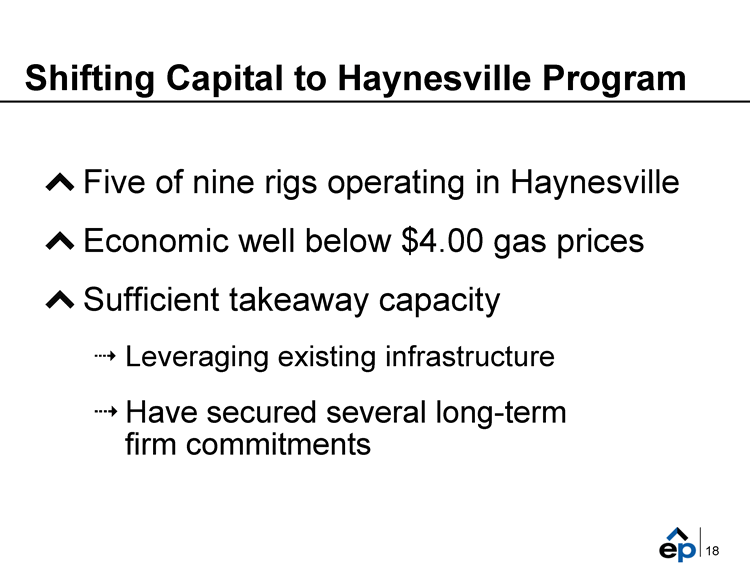
| Shifting Capital to Haynesville Program Five of nine rigs operating in Haynesville Economic well below $4.00 gas prices Sufficient takeaway capacity Leveraging existing infrastructure Have secured several long-term firm commitments 18 |
| Operations Update Interstate Pipelines ? Exploration & Production |
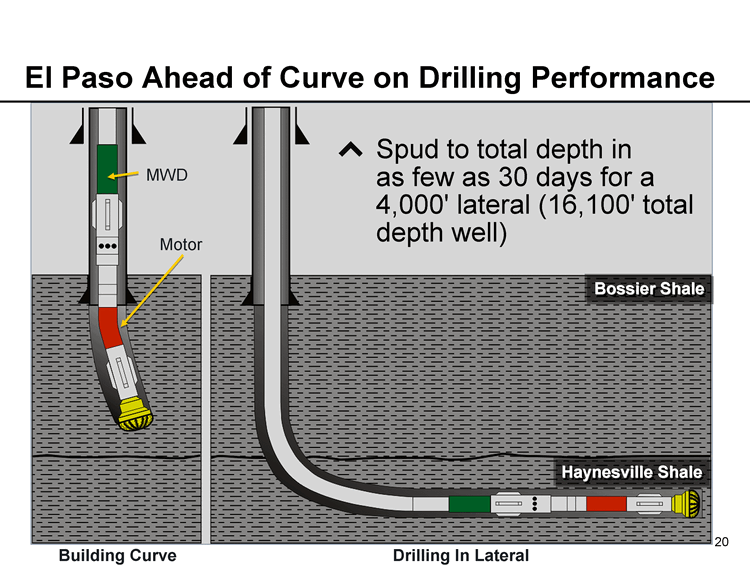
| El Paso Ahead of Curve on Drilling Performance Haynesville Shale Bossier Shale Building Curve Drilling In Lateral MWD Motor Spud to total depth in as few as 30 days for a 4,000' lateral (16,100' total depth well) 20 |
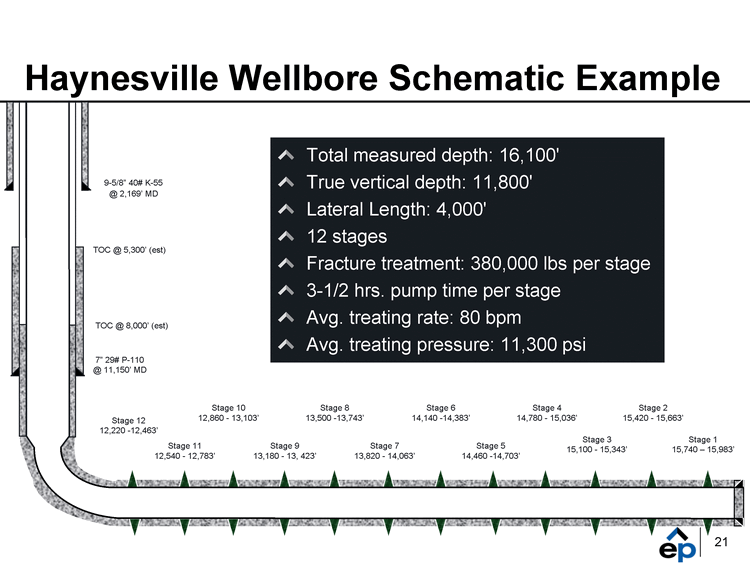
| Haynesville Wellbore Schematic Example 21 TOC @ 8,000' (est) 9-5/8" 40# K-55 @ 2,169' MD Total measured depth: 16,100' True vertical depth: 11,800' Lateral Length: 4,000' 12 stages Fracture treatment: 380,000 lbs per stage 3-1/2 hrs. pump time per stage Avg. treating rate: 80 bpm Avg. treating pressure: 11,300 psi Stage 1 15,740 - 15,983' 7" 29# P-110 @ 11,150' MD Stage 2 15,420 - 15,663' Stage 3 15,100 - 15,343' Stage 4 14,780 - 15,036' Stage 5 14,460 -14,703' Stage 7 13,820 - 14,063' Stage 9 13,180 - 13, 423' Stage 10 12,860 - 13,103' Stage 8 13,500 -13,743' Stage 6 14,140 -14,383' Stage 11 12,540 - 12,783' Stage 12 12,220 -12,463' TOC @ 5,300' (est) |
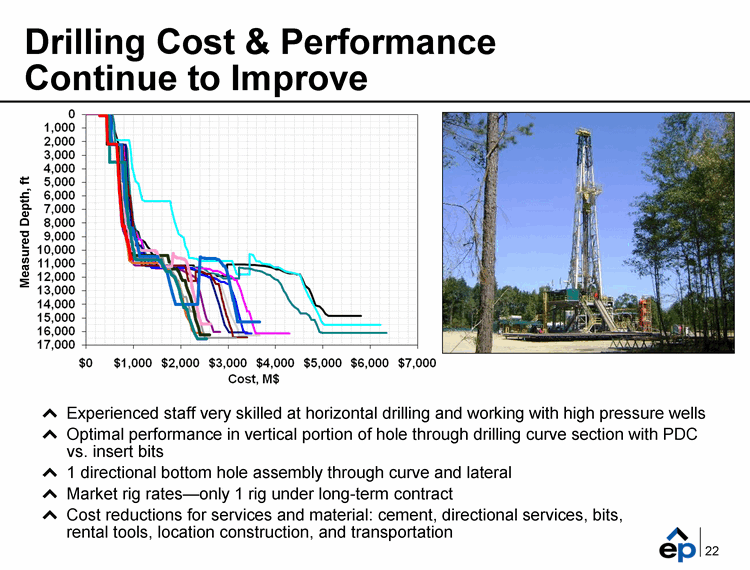
| Drilling Cost & Performance Continue to Improve 22 Experienced staff very skilled at horizontal drilling and working with high pressure wells Optimal performance in vertical portion of hole through drilling curve section with PDC vs. insert bits 1 directional bottom hole assembly through curve and lateral Market rig rates-only 1 rig under long-term contract Cost reductions for services and material: cement, directional services, bits, rental tools, location construction, and transportation Measured Depth, ft |
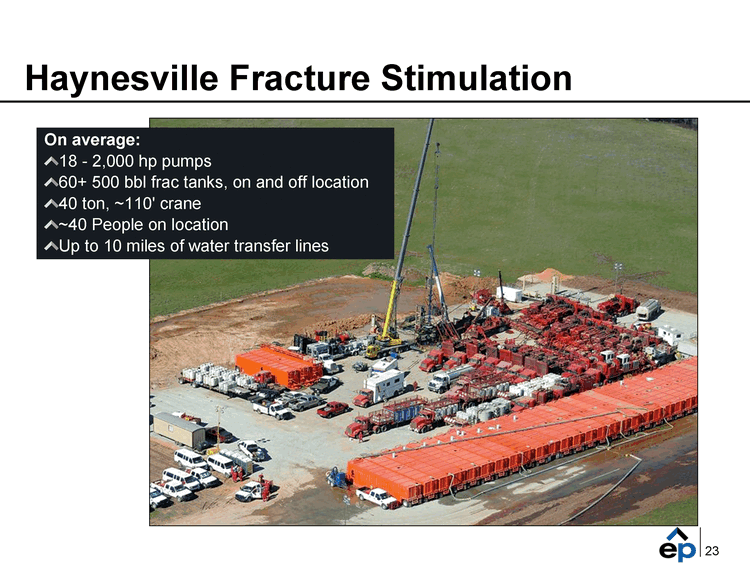
| Haynesville Fracture Stimulation On average: 18 - 2,000 hp pumps 60+ 500 bbl frac tanks, on and off location 40 ton, ~110' crane ~40 People on location Up to 10 miles of water transfer lines 23 |
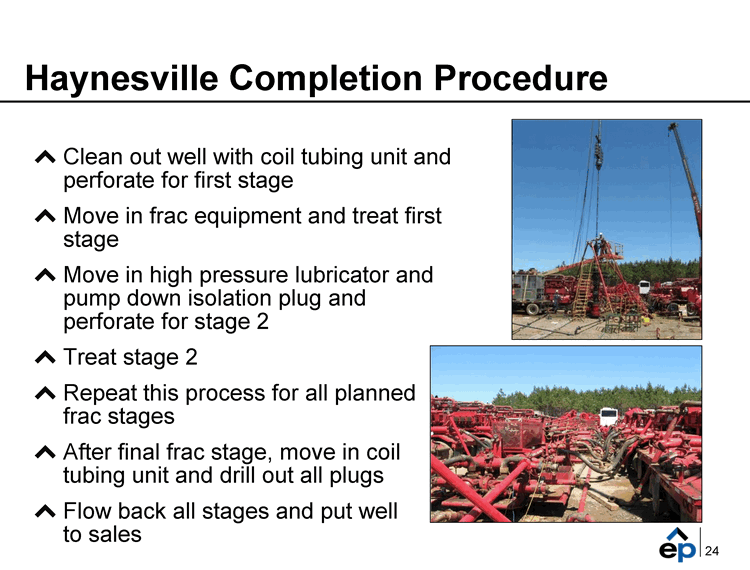
| Haynesville Completion Procedure Clean out well with coil tubing unit and perforate for first stage Move in frac equipment and treat first stage Move in high pressure lubricator and pump down isolation plug and perforate for stage 2 Treat stage 2 Repeat this process for all planned frac stages After final frac stage, move in coil tubing unit and drill out all plugs Flow back all stages and put well to sales 24 |
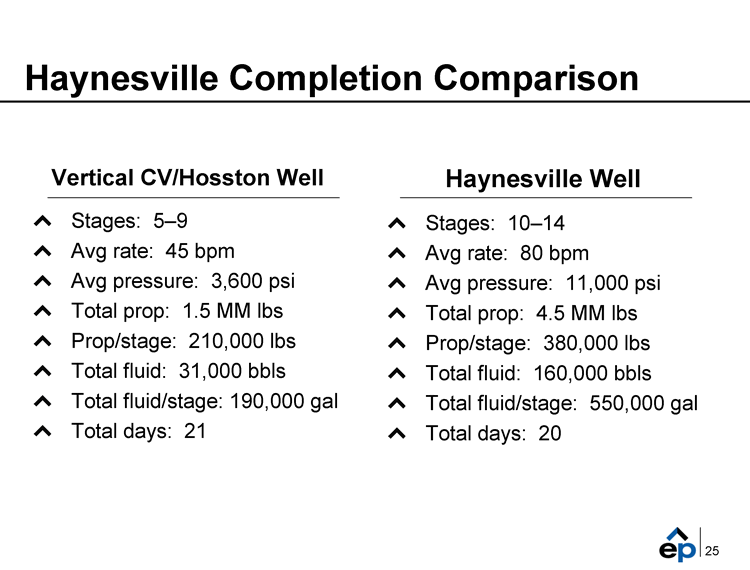
| Haynesville Well Stages: 10-14 Avg rate: 80 bpm Avg pressure: 11,000 psi Total prop: 4.5 MM lbs Prop/stage: 380,000 lbs Total fluid: 160,000 bbls Total fluid/stage: 550,000 gal Total days: 20 Haynesville Completion Comparison Vertical CV/Hosston Well Stages: 5-9 Avg rate: 45 bpm Avg pressure: 3,600 psi Total prop: 1.5 MM lbs Prop/stage: 210,000 lbs Total fluid: 31,000 bbls Total fluid/stage: 190,000 gal Total days: 21 25 |
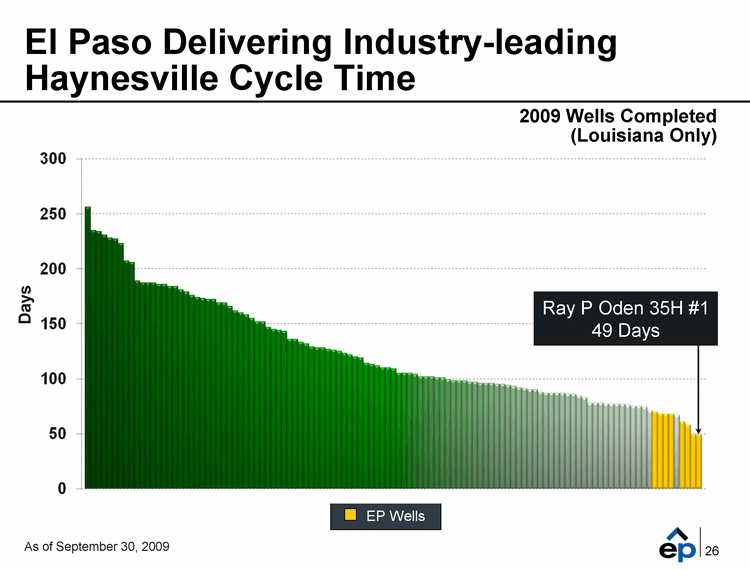
| El Paso Delivering Industry-leading Haynesville Cycle Time Days (Spud to First Sales) EP Wells 2009 Wells Completed (Louisiana Only) Ray P Oden 35H #1 49 Days 26 As of September 30, 2009 Days |
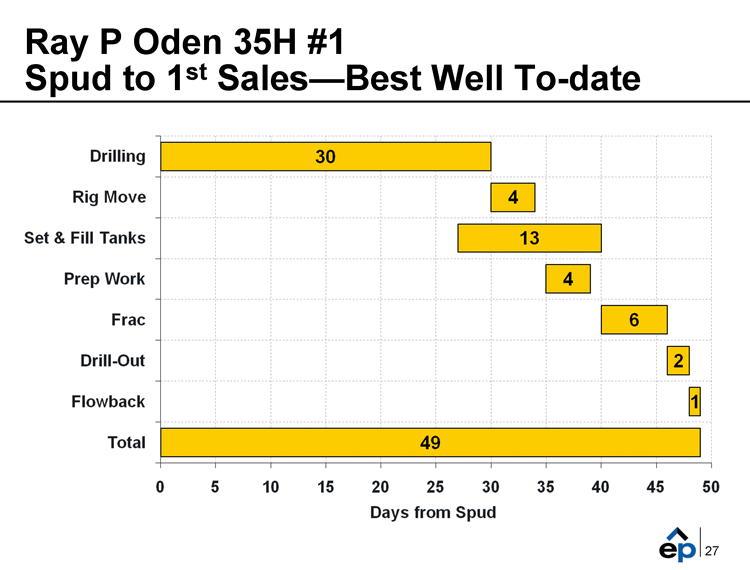
| Ray P Oden 35H #1 Spud to 1st Sales-Best Well To-date 27 |
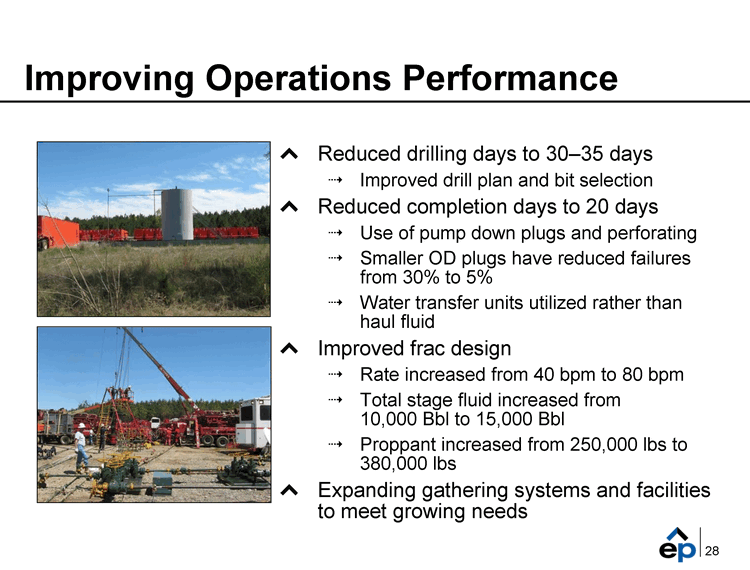
| Improving Operations Performance Gregg Reduced drilling days to 30-35 days Improved drill plan and bit selection Reduced completion days to 20 days Use of pump down plugs and perforating Smaller OD plugs have reduced failures from 30% to 5% Water transfer units utilized rather than haul fluid Improved frac design Rate increased from 40 bpm to 80 bpm Total stage fluid increased from 10,000 Bbl to 15,000 Bbl Proppant increased from 250,000 lbs to 380,000 lbs Expanding gathering systems and facilities to meet growing needs 28 |
| Summary Excellent position in the heart of the play Results among best in industry Continuing to improve Premier asset in E&P company Resource and production potential is significant Will apply experience to Eagle Ford shale 29 |
| El Paso E&P Company Haynesville Field Trip October 15, 2009 |
